Note
Access to this page requires authorization. You can try signing in or changing directories.
Access to this page requires authorization. You can try changing directories.
Azure DevOps Services | Azure DevOps Server 2022 - Azure DevOps Server 2019
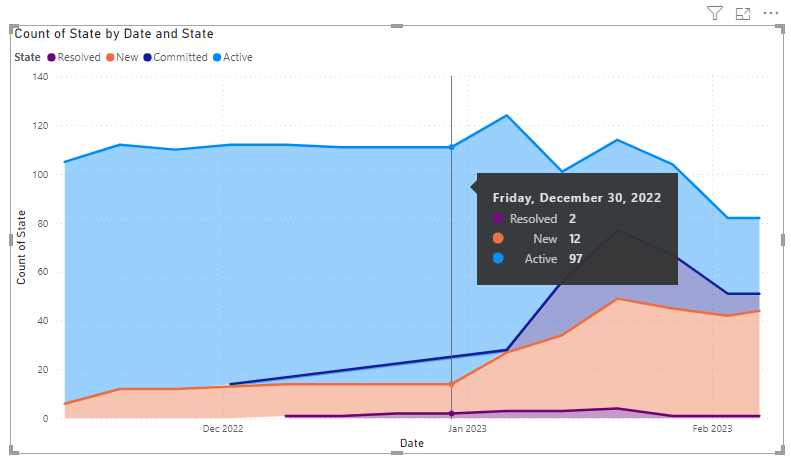
Analytics views support creating status and trend reports for work items based on teams or field criteria of your choosing. This article provides a tutorial for creating a custom Analytics view, loading it into Power BI, and then creating a stacked area trend report similar to the following image.
In this article, you learn how to:
- Create a custom Analytics view for active bugs
- Generate a Power BI report based on that view
- Create a trend chart
For an overview of Analytics views, see About Analytics views.
Prerequisites
| Category | Requirements |
|---|---|
| Access levels | - Project member. - At least Basic access. |
| Permissions | By default, project members have permission to query Analytics and create views. For more information about other prerequisites regarding service and feature enablement and general data tracking activities, see Permissions and prerequisites to access Analytics. |
| Tools | Power BI Desktop |
Open Analytics to access views
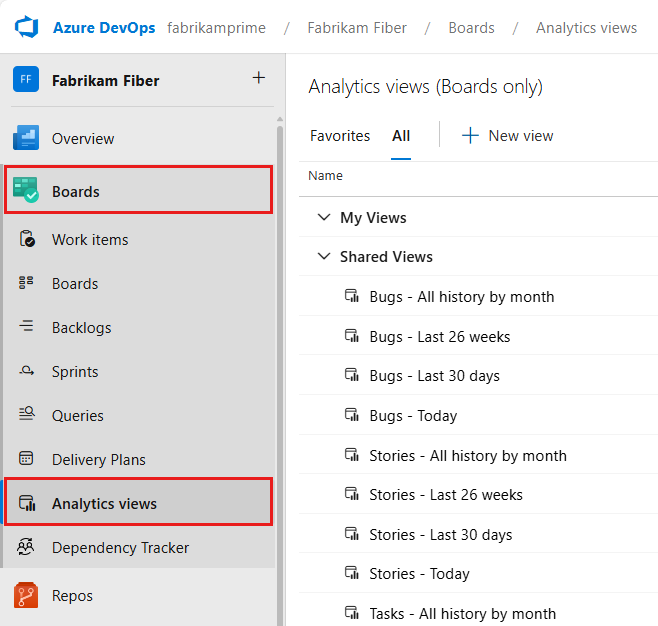
From your web portal, select Boards > Analytics views.
If you don't see Analytics views, check that you have permissions for viewing Analytics. See Permissions and prerequisites to access Analytics.
Create your custom view
From the web portal, Analytics view, choose ![]() New View to create a custom view. Fill out the forms provided in each tab as shown in the following steps.
New View to create a custom view. Fill out the forms provided in each tab as shown in the following steps.
Choose Save to move to the next tab in the panel. If you need to revisit a tab, select the tab title.
Name your view
Give your view a name, such as Active Bugs. Select Private view to save it under My Views. Only you have access to views saved under My Views. Otherwise, you can select Shared view to save it under Shared Views.
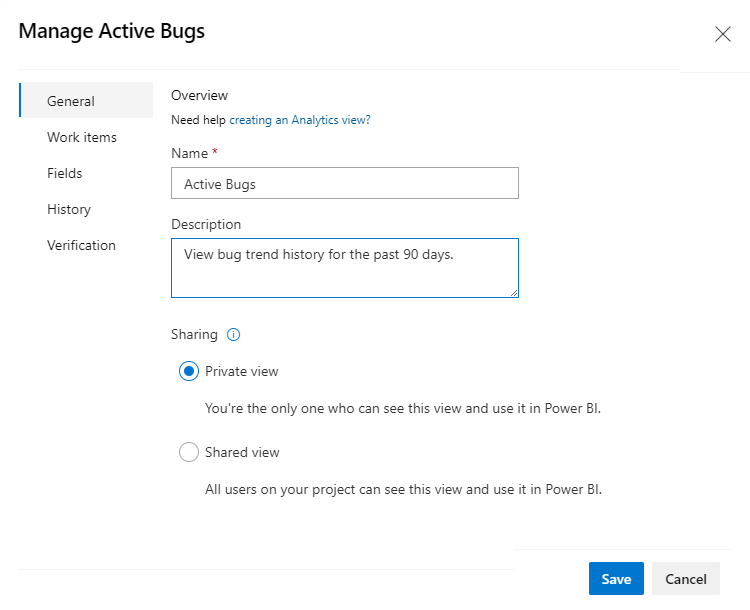
Choose Save to move to the next tab.
From the Work items tab, select the top-level filter for the work items.
- Choose Filter by team to select work items defined for one or more projects and teams.
- Choose Filter by area path to select work items defined for one or more projects and area paths.
Here we choose the Fabrikam Fiber project and the Production area path.

To add more projects or teams, select
 Add to add a new row, and then select the project and team.
Under Backlogs and work items, select
Add, and then select Bug from the list of work items types.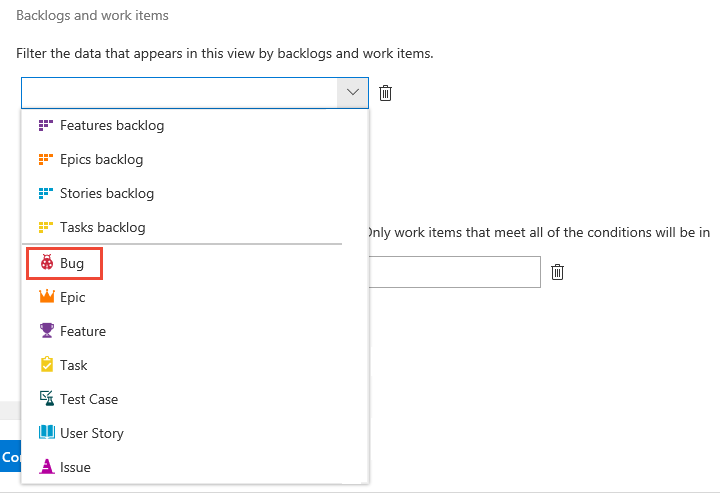
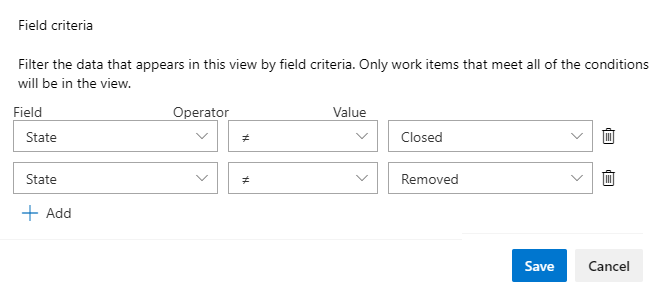
Under Field criteria, make the following selections to filter work items to only active bugs. Note, the bug states for your project may differ from those states used in this example.
- Select
Add, select State, choose ≠, and then choose Closed .
- Select
Add, select State, choose ≠, and then choose Removed .
Choose Save to move to the next tab.
- Select
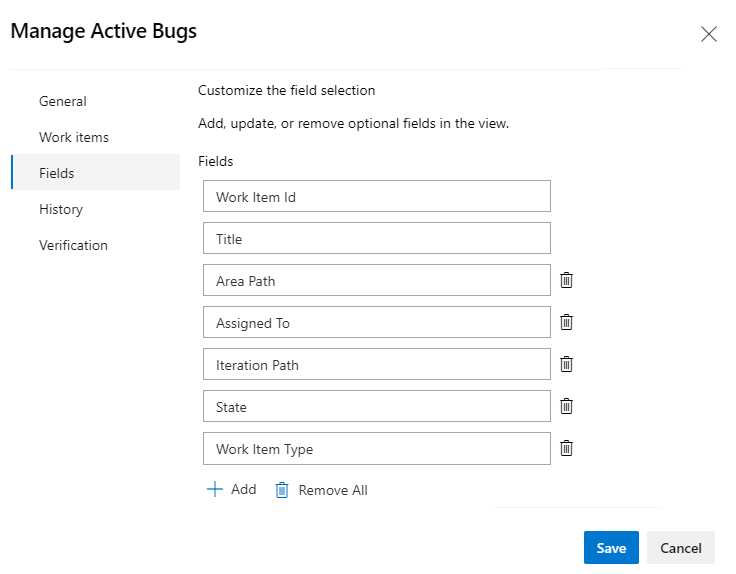
In the next tab, Fields, keep the set of fields automatically selected. Add any custom fields you may want to report on.
Choose Save to move to the next tab.
In the History tab, select Rolling period in days and enter the number of days of interest. Here we enter 90 days. For Granularity, choose Weekly. (For smaller or larger time periods, consider choosing Daily or Monthly, respectively.
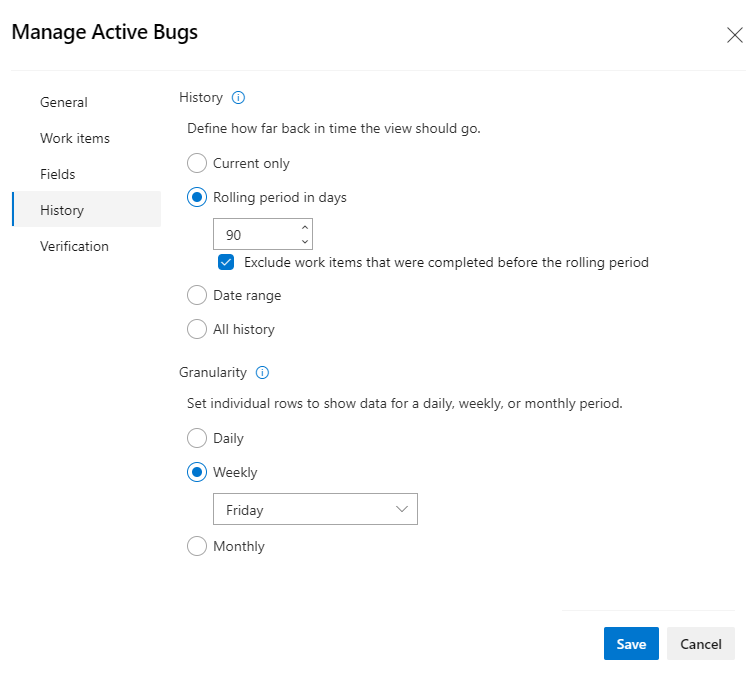
These selections generate a snapshot for each bug and for each week the bug is in a new, proposed, active, or resolved state. For more information about these defining trend data options, see Create an Analytics view, History.
Choose Save to move to the next tab.
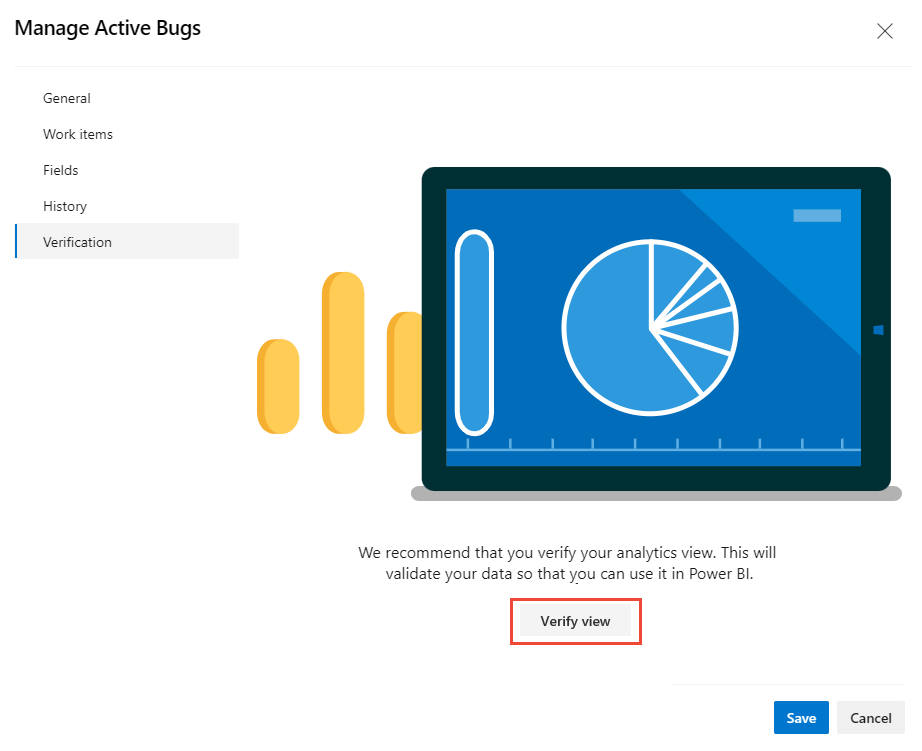
On the last tab, Verification, select Verify view. Azure DevOps verifies your view by running a test query against the dataset to your filter criteria.
Note
Verification time will vary based on the amount of data defined in your view. Verify your view to make sure all the definitions are correct.
Once your view successfully verifies, choose Save. You can then start using it in Power BI. Verification also returns an estimate of the number of rows in the dataset.
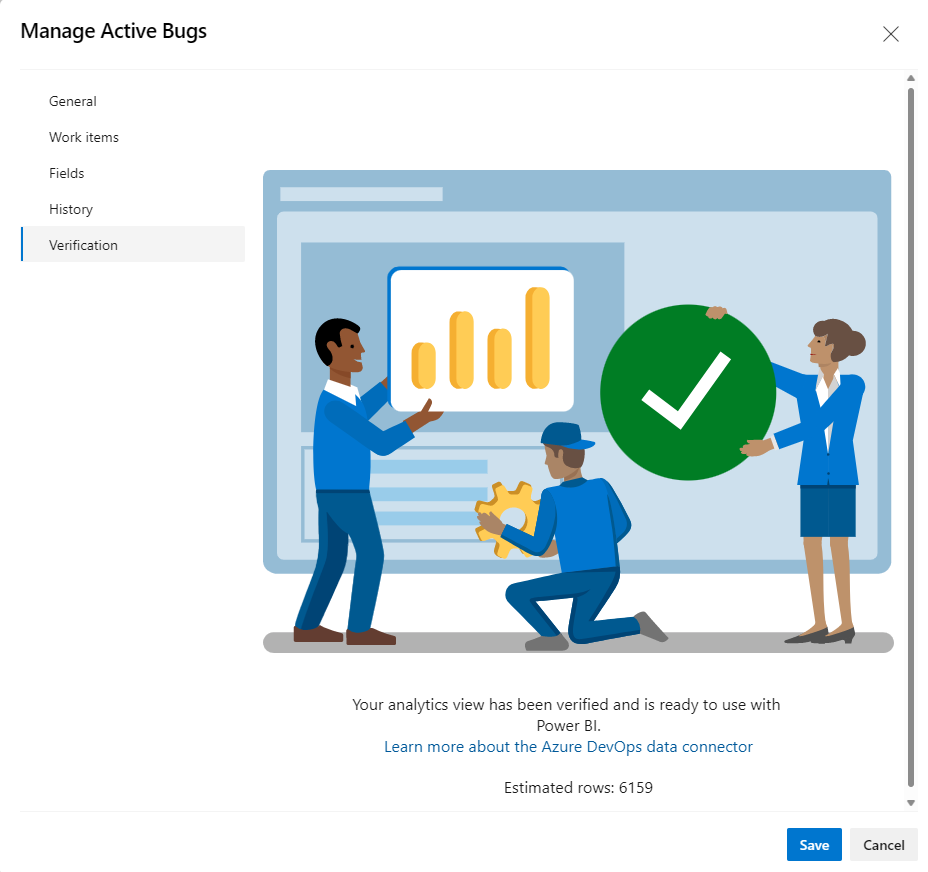
If your view fails to verify successfully, you get an error explaining the issue and pointing to a possible fix. Try changing the options you selected in the Work Items and History tabs to include less data, and then verify the view again.
Open Power BI desktop and load your view
- Open Power BI Desktop.
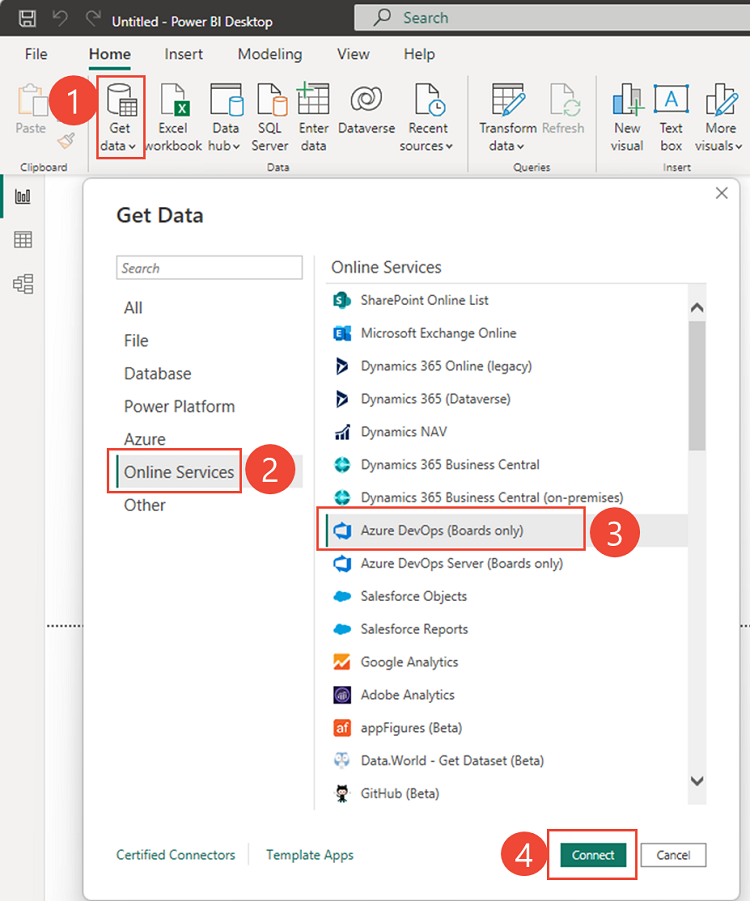
Choose (1) Get Data and select More..., (2) Online Services, (3) Azure DevOps (Boards only), and then (4) Connect.
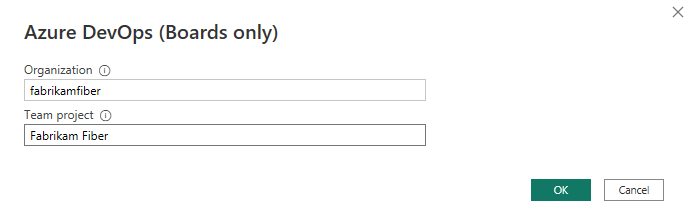
Enter your organization name, the same Azure DevOps name you used to create the Active Bugs view, and the same project for which you defined the Active Bugs view.
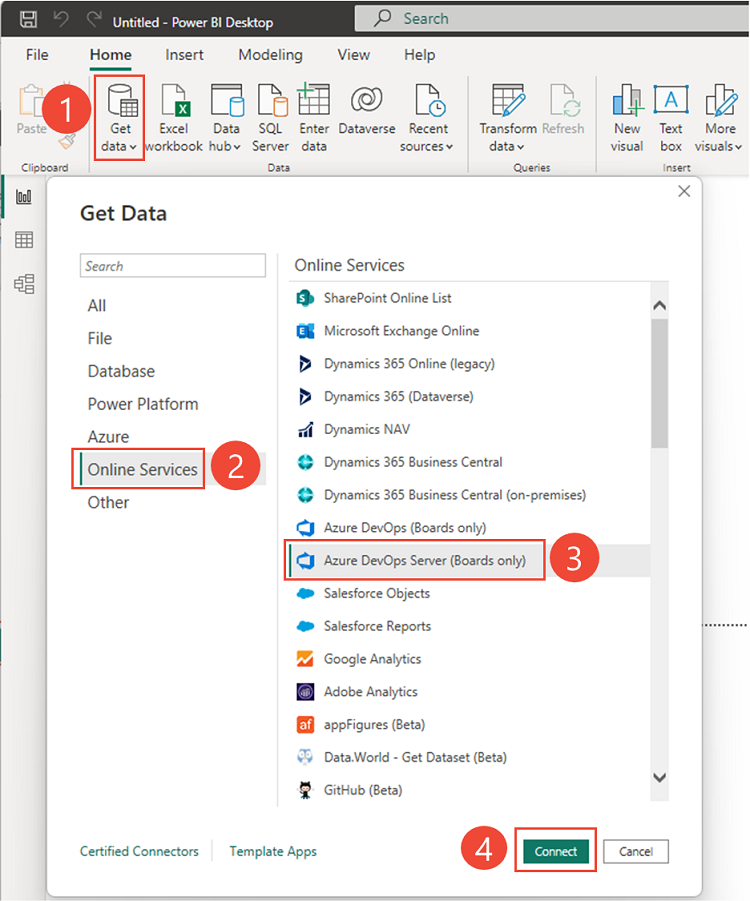
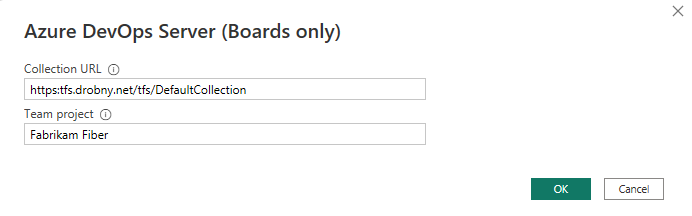
Choose (1) Get Data and select More..., (2) Online Services, (3) Azure DevOps Server (Boards only), and then (4) Connect.
Enter the URL for your server and collection, the same project for which you defined the Active Bugs view.
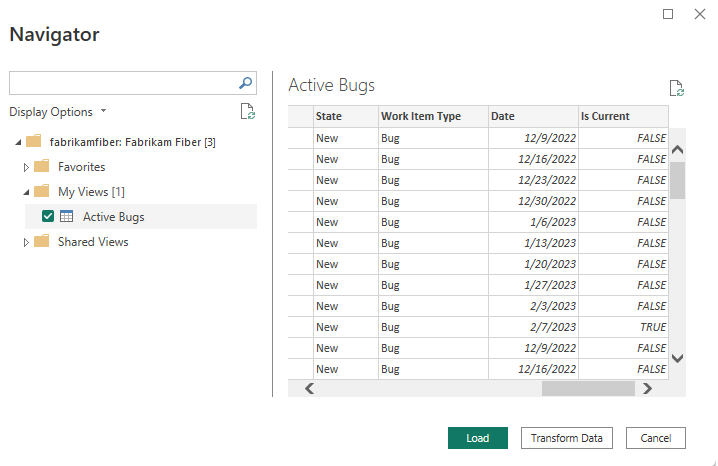
Expand the folders as needed, and choose the Active Bugs view you saved in the previous section, and then select Load.
Need help with connecting? See Connect with Power BI Data Connector.
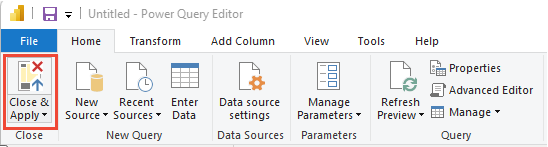
Close the query and apply your changes
Once you've completed all your data transformations, choose Close & Apply from the Home menu to save the query and return to the Report tab in Power BI.
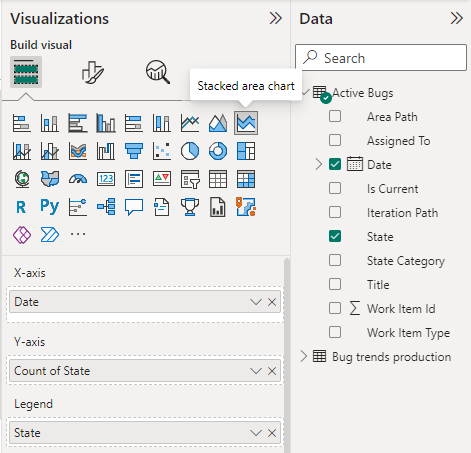
Create a stacked area chart report
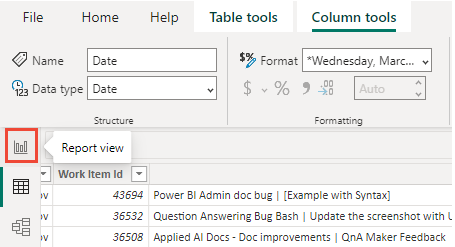
In Power BI, choose the Report view.
Under Visualizations, choose Stacked area chart report.
Add
Date" to X-axis, and right-clickDateand selectDaterather thanDate Hierarchy.Add
Stateto Y-axis, and right-clickCount.Add
Stateto Legend.
The example report displays.
Tip
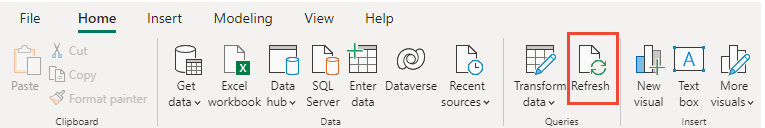
If you need to modify your Analytics view, you can do so and then return to your Power BI report and refresh the data. Simply select the Refresh option as shown.
Save and publish your report
Choose File > Save As to save your report to your local workspace.
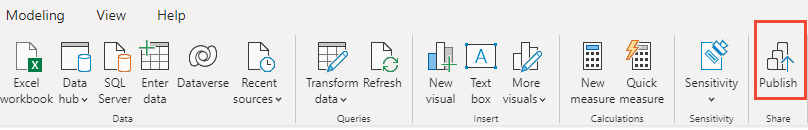
To publish your report to Power BI, choose the Publish tab. For more information, see Collaborate in your Power BI app workspace.
Continue to explore your data
Analytics views provide you with a great deal of power and flexibility to filter your data and generate useful reports quickly and easily using Power BI. Within a custom view, you can create datasets that span multiple teams or projects.