Events
Mar 17, 9 PM - Mar 21, 10 AM
Join the meetup series to build scalable AI solutions based on real-world use cases with fellow developers and experts.
Register nowThis browser is no longer supported.
Upgrade to Microsoft Edge to take advantage of the latest features, security updates, and technical support.
Azure DevOps Services | Azure DevOps Server 2022 - Azure DevOps Server 2019
Each Analytics view defines a dataset in Power BI. Datasets are the tables and properties used to create visualizations. The datasets generated by the Power BI Data Connector for Azure DevOps have the following characteristics:
For more information about Power BI and datasets, see Power BI - basic concepts for Power BI service.
The Analytics OData endpoint provides a normalized representation of Analytics data. The data is normalized primarily to support reporting on the "many-to-many" relationships that exist between the data, such as work items and associated tags.
The Power BI Data Connector represents this data as a single table so that the relationships shown in our Analytics data model don't need to be recreated in Power BI. This representation allows you to filter immediately on complex fields, such as work item tags.
The process greatly simplifies getting your reports up and running. However, not all of the fields available through the Analytics OData endpoint are available for selection in an Analytics view.
The fields you can select in an Analytics view correspond to regular work tracking fields and Analytics data store fields.
You can select all work tracking fields in an Analytics view, except for the following fields:
Important
Identity or person-name fields, such as Created By, Assigned To, etc., are selectable fields, however you can't select these fields at this time as field criteria for the purposes of filtering work items.
For a description of each work item tracking fields, see Entities and properties reference for Azure Boards.
You can select the following Analytics-based fields in an Analytics view:
| Field | Description |
|---|---|
| Cycle Time | Time for a work item to move from a state category of "In Progress" to "Completed." |
| Date (included automatically with history) | Supports viewing the daily, weekly, or monthly history of the filtered set of work items. |
| Is Current (included automatically with history) | Supports filtering the data to view the most recent snapshot of the filtered set of work items by setting the value to True. |
| Lead Time | Time for a work item to move from a state category of "Proposed" to "Completed". |
| Parent Work Item Id | The Work Item Id for the parent of a work item. |
| Project Name | Equivalent to the project field. |
| Revision | A number that is assigned to the historical revision of a work item. |
| Tags | Semicolon delimited list of tags. |
| WorkItemRevisionSK | The Analytics unique key for the work item revision, used to join related entities. |
For information about state categories, see Workflow states and state categories. For more detailed information on Analytics data model, see Data model for Analytics.
To access any other fields available through Analytics, include the corresponding Surrogate Keys (SK) or Work Item ID in the Analytics view. Then create the necessary mapping tables based on the Analytics Navigational Property.
Understanding the Analytics data model is critical to building good relationships between entities.
By default, when basic data is returned from Analytics, the data is related as shown in the figure below:
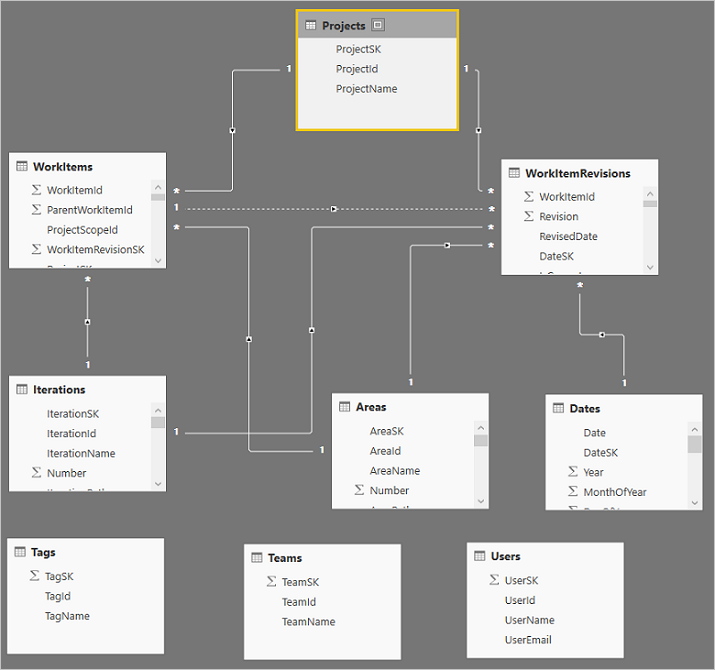
Tags, Teams, and Users aren't related to any of the other data. It's related to how those entities are related. They could be related in a couple of ways:
You can handle multiple relationships fairly simply. For example, in the default model you can edit the query, select the AssignedTo column of the WorkItems table and expand the column to include all of the data from the Users table and you can repeat this process for the Created By and Changed By columns as well. It gets you around having multiple links from one table to another which isn't allowed.
Another reason for expanding columns in this way is to handle circular relationships that are also not allowed. For example, take the following path: Projects > Areas > Work Items > Projects. It presents a typical circular problem. What if you wanted to see which ares were part of a given project? The model as it is build has relationships between Areas and Work Items and Projects and Work Items but Projects can't be related to Areas because that completes the circular relationship and so it's not allowed. To handle this scenario, you could expand the Project column in the Areas table. To do that, take the following steps:
Select Edit Queries from the Home tab.
Select the Areas query.
Scroll to the Project column (the last column) and select the Expand icon at the top of the column.

Uncheck all of the columns except for the ProjectName and select OK.

Now you can list Areas by Project and get a count of Areas in each project.
Events
Mar 17, 9 PM - Mar 21, 10 AM
Join the meetup series to build scalable AI solutions based on real-world use cases with fellow developers and experts.
Register now