Example reports based on Analytics views
Azure DevOps Services | Azure DevOps Server 2022 - Azure DevOps Server 2019
Learn how to generate the following example reports in Power BI based on an Analytics view.
Before generating these reports, you must first connect to Analytics using the Power BI data connector.
Tip
Use the search box if you are working with tables that contain many columns.
Prerequisites
- Access level: You must be a member of a project with Basic access or higher.
- Permission: By default, project members have permission to query Analytics and create views.
- For more information about other prerequisites regarding service and feature enablement and general data tracking activities, see Permissions and prerequisites to access Analytics.
Show card with total count of work items
Load the
Work Items - TodayAnalytics view into Power BI.From the Visualizations pane, choose Card, and drag the
Work Item IDto Fields.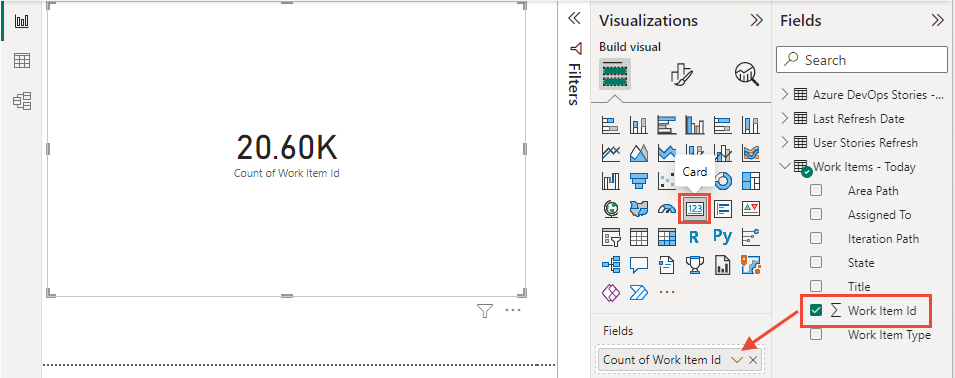
Number of work items by area path and state
Load
Work Items - TodayAnalytics view into Power BI. The data table should include the following columns:Area Path,Assigned To,Iteration Path,State,Title,Work Item ID, andWork Item Type.From the Visualizations pane, choose Matrix, and add
Area Path,State, andWork Item IDto Rows, Columns, and Values, respectively.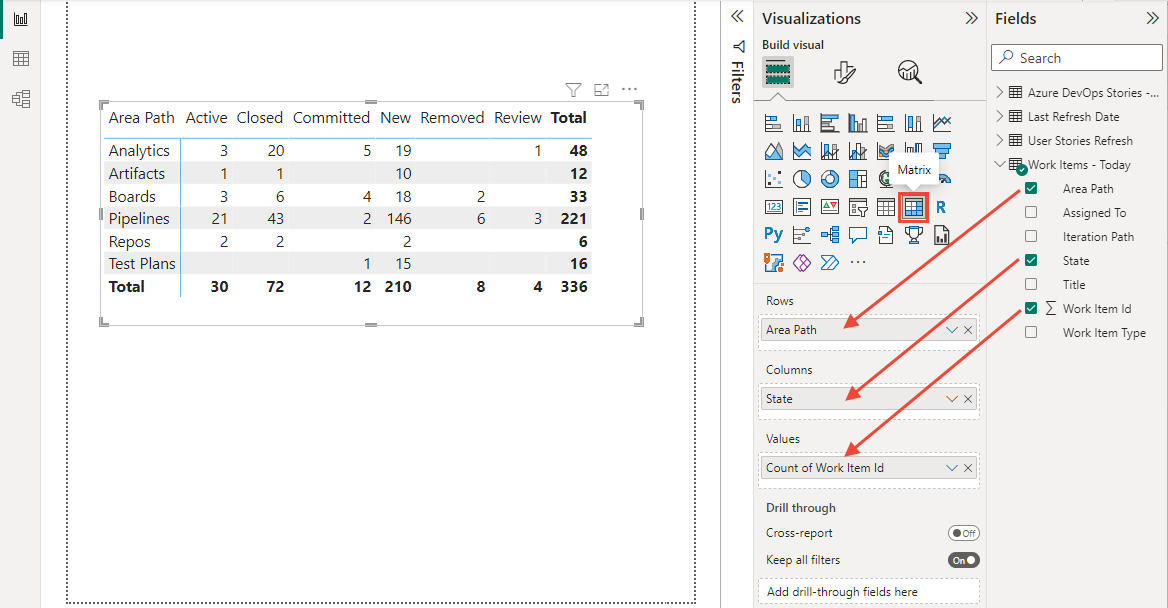
(Optional) Expand the Filters pane and choose one or more fields to filter the report. For example, the example report shown in the previous image only shows select
Area Paths.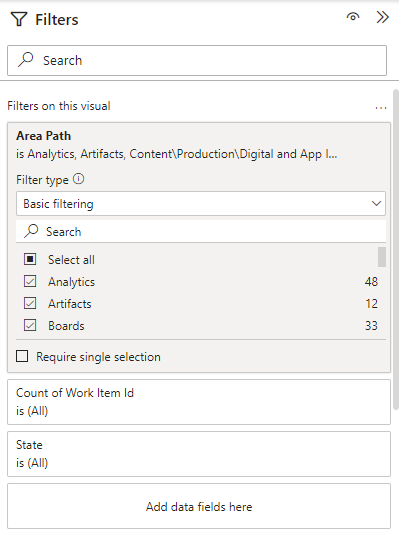
Note
To simplify the report, select
Area Pathswere renamed to shorten their labels. To learn how to replace values in a column, see Transform Analytics data to generate Power BI reports, Replace values.To filter on other fields, such as
Iteration PathorWork Item Type, drag the field to Columns in the Visualizations pane, and then filter the data from the Filters pane.
Related articles
Feedback
Coming soon: Throughout 2024 we will be phasing out GitHub Issues as the feedback mechanism for content and replacing it with a new feedback system. For more information see: https://aka.ms/ContentUserFeedback.
Submit and view feedback for