Note
Access to this page requires authorization. You can try signing in or changing directories.
Access to this page requires authorization. You can try changing directories.
Azure DevOps Services | Azure DevOps Server 2022 | Azure DevOps Server 2020
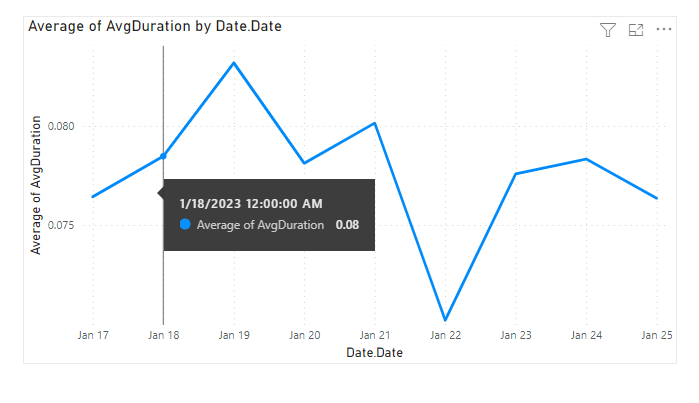
Test duration trend reports, similar to the one shown in the following image, provide insight into the day-wise trend of the average time taken to execute a test for a selected time range. For information on adding tests to a pipeline, see the Test task resources section later in this article.
Important
Power BI integration and access to the OData feed of the Analytics Service are generally available for Azure DevOps Services and Azure DevOps Server 2020 and later versions. The sample queries provided in this article are valid only against Azure DevOps Server 2020 and later versions, and depend on v3.0-preview or later version. We encourage you to use these queries and provide us feedback.
| Category | Requirements |
|---|---|
| Access levels | - Project member. - At least Basic access. |
| Permissions | By default, project members have permission to query Analytics and create views. For more information about other prerequisites regarding service and feature enablement and general data tracking activities, see Permissions and prerequisites to access Analytics. |
Note
This article assumes you read Overview of Sample Reports using OData Queries and have a basic understanding of Power BI.
Sample queries
You can use the following queries of the TestResultsDaily entity set to create different but similar test duration reports. The TestResultsDaily entity set provides a daily snapshot aggregate of TestResult executions, grouped by test.
Note
To determine available properties for filter or report purposes, see Metadata reference for Test Plans Analytics and Metadata reference for Azure Pipelines. You can filter your queries or return properties using any of the Property values under an EntityType or NavigationPropertyBinding Path values available with an EntitySet. Each EntitySet corresponds to an EntityType. For more information about the data type of each value, review the metadata provided for the corresponding EntityType.
Use the following queries to view the test duration trend report for a pipeline with a Build workflow.
Copy and paste the following Power BI query directly into the Get Data > Blank Query window. For more information, see Overview of sample reports using OData queries.
https://analytics.dev.azure.com/{organization}/{project}/_odata/v4.0-preview/TestResultsDaily?
$apply=filter(
	Pipeline/PipelineName eq '{pipelineName}'
	And Date/Date ge {startdate}
	And Workflow eq 'Build'
	)
/groupby(
	(TestSK, Test/TestName, Date/Date),
	aggregate(
	  ResultCount with sum as TotalCount,
	  ResultDurationSeconds with sum as TotalDuration
	))
/compute(
	TotalDuration div TotalCount as AvgDuration
	)
Substitution strings and query breakdown
Substitute the following strings with your values. Don't include brackets {} with your substitution. For example if your organization name is "Fabrikam", replace {organization} with Fabrikam, not {Fabrikam}.
{organization}- Your organization name{project}- Your team project name{pipelinename}- Your pipeline name. Example:Fabrikam hourly build pipeline{startdate}- The date to start your report. Format: YYYY-MM-DDZ. Example:2022-09-01Zrepresents September 1, 2022. Don't enclose in quotes or brackets and use two digits for both, month and date.
Tip
Depending on the number of tests added to a pipeline, the data returned can be significant. We recommend that you use a {startdate} for a few days to gauge the amount of data returned and adjust accordingly.
Query breakdown
The following table describes each part of the query.
Query part
Description
$apply=filter(
Start filter() clause.
Pipeline/PipelineName eq '{pipelineName}'
Return test runs for the named pipeline.
And Date/Date ge {startdate}
Return test runs on or after the specified date.
and Workflow eq 'Build'
Return test runs for a Build workflow.
)
Close filter() clause.
/groupby(
Start groupby() clause.
(TestSK, Test/TestName, Date/Date),
Group by test, test name, and run date.
aggregate(
Start aggregate clause to sum different test run outcomes matching the filter criteria.
ResultCount with sum as TotalCount,
Count the total number of test runs as TotalCount.
ResultDurationSeconds with sum as TotalDuration
Sum the total duration of all the runs as TotalDuration.
))
Close aggregate() and groupby() clauses.
/compute(
Start compute() clause.
TotalDuration div TotalCount as AvgDuration
For all the tests, calculate the average duration by dividing the total duration by total number of runs.
)
Close compute() clause.
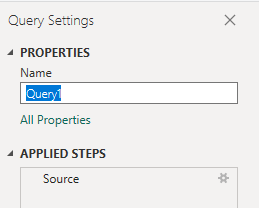
(Optional) Rename query
You can rename the default query label, Query1, to something more meaningful. Simply enter a new name from the Query Settings pane.
Expand the Test and Date columns in Power BI
Expanding a column flattens the record into specific fields. To learn how, see Transform Analytics data to generate Power BI reports, Expand columns.
- Expand the
Testcolumn to show the expanded entitiesTestSKandTest.TestName. - Expand the
Datecolumn to show the expanded entityDate.Date.
Change column data type
From the Power Query Editor, select the
TotalCountcolumn; select Data Type from the Transform menu; and then choose Whole Number.Select the
TotalDurationandAvgDurationcolumns; select Data Type from the Transform menu; and then choose Decimal Number.
For more information about changing the data type, see Transform Analytics data to generate Power BI reports, Transform a column data type.
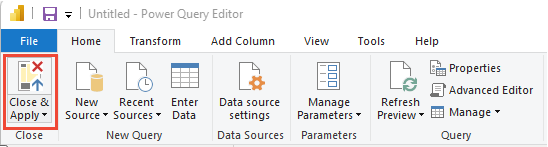
Close the query and apply your changes
Once you've completed all your data transformations, choose Close & Apply from the Home menu to save the query and return to the Report tab in Power BI.
Create the Line chart report
In Power BI, under Visualizations, choose Line chart and drag and drop the fields onto the Columns area.
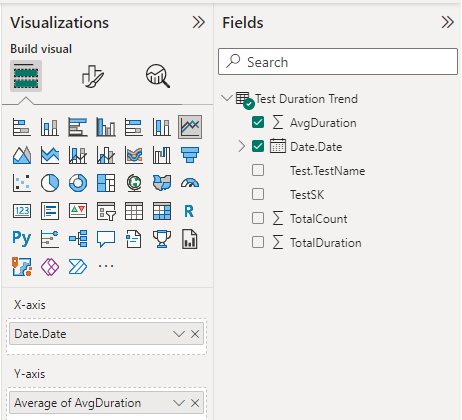
Add
Date.Dateto the X-axis, right-click the field and select Date.Date, rather than Date.Hierarchy.Add AvgDuration to the Y-axis.
Your report should look similar to the following image.
Test task resources
- Run tests in parallel using the Visual Studio Test task
- Run tests in parallel for any test runner
- Speed up testing by using Test Impact Analysis (TIA)
- Manage flaky tests
- UI testing considerations
- Azure Load Testing
- Azure Pipelines task reference, Test tasks