Note
Access to this page requires authorization. You can try signing in or changing directories.
Access to this page requires authorization. You can try changing directories.
Azure DevOps Services | Azure DevOps Server 2022 - Azure DevOps Server 2019
Grafana is an open source, feature-rich metrics dashboard, and graph editor. It supports Graphite, Elasticsearch, OpenTSDB, Prometheus, and InfluxDB analytics services. Use the Grafana service hook to annotate Grafana dashboards upon completion of Azure Pipelines deployments.

Prerequisites
| Category | Requirements |
|---|---|
| Permissions | - Member of the Project Collection Administrators group. Organization owners are automatically members of this group. - Edit subscriptions and View subscriptions permissions set to Allow. By default, only project administrators have these permissions. To grant the permissions to other users, you can use the command-line tool or the Security REST API. |
| Tools | Grafana |
Create a service hook subscription
Navigate to project settings:
https://dev.azure.com/{orgName}/{project_name}/_settings/serviceHooks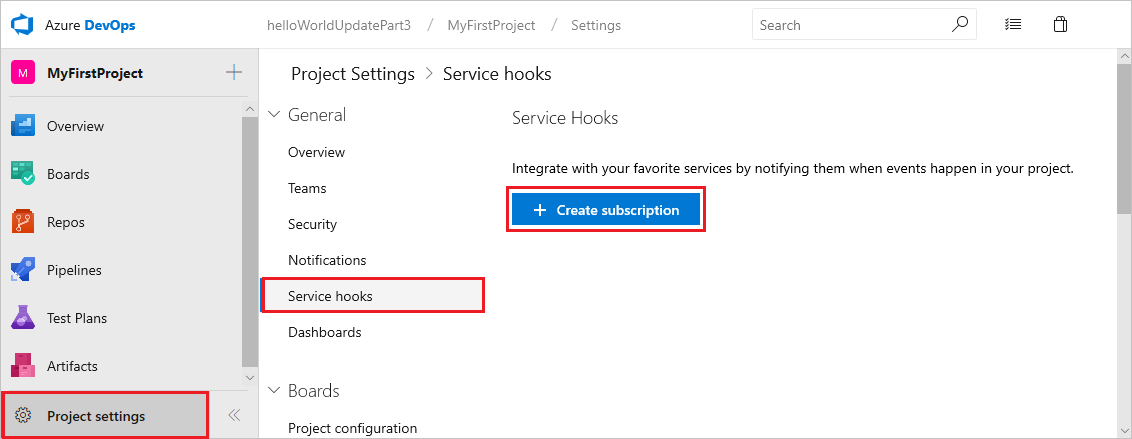
Select Create Subscription.
Choose Grafana among the list of services and choose Next

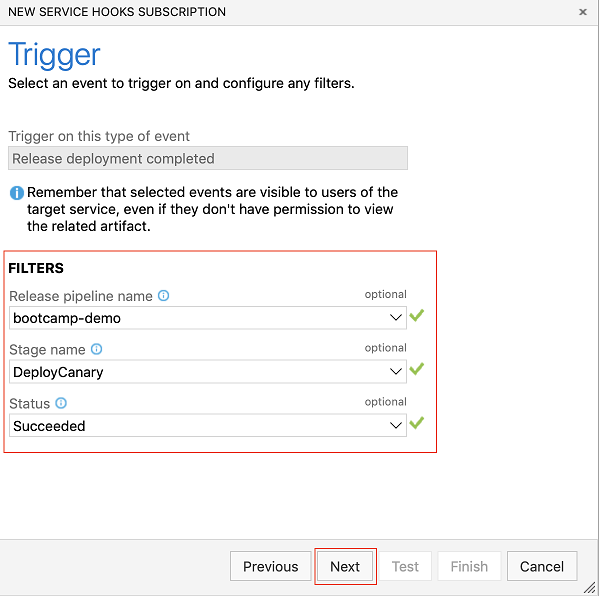
For Release deployment completed event, configure the optional filters: Release pipeline name, Stage name, and Status
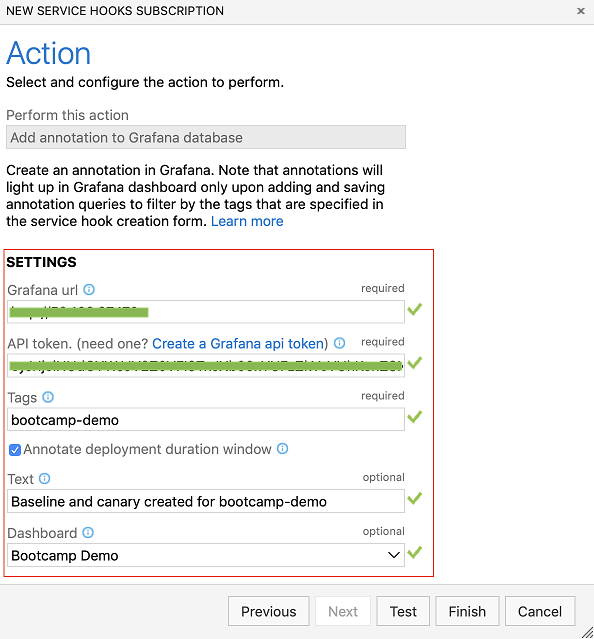
Provide the Grafana URL and Grafana API token required for Azure DevOps to post annotations.
- If you check the Annotate deployment duration window, the annotation added corresponds to the duration of the deployment (start and end timestamps of deployment).
- If not checked, annotation corresponds to only the completion timestamp of the deployment. The dashboard input can be used to choose a specific dashboard as the target of annotations rather than the default behavior of annotating all dashboards.
Choose Test to verify that Azure DevOps can use the provided configuration and successfully create a subscription.
Once verified, choose Finish to complete the creation of subscription.