Note
Access to this page requires authorization. You can try signing in or changing directories.
Access to this page requires authorization. You can try changing directories.
Azure DevOps Services | Azure DevOps Server | Azure DevOps Server 2022
View completed exploratory testing sessions and derive meaningful insights at team or individual level, and for a specific period.
Prerequisites
| Category | Requirements |
|---|---|
| Project access | Project member. |
| Access levels | At least Basic access. For more information, see Manual test access and permissions. |
Open recent exploratory sessions
Open the Recent exploratory sessions page, with either of the following actions:
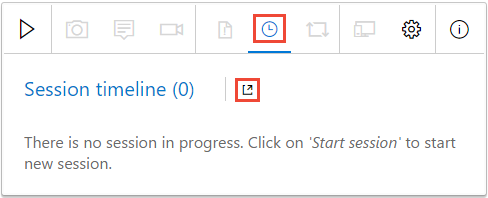
From the Test - Feedback extension, select the "view" icon on the Session timeline page.
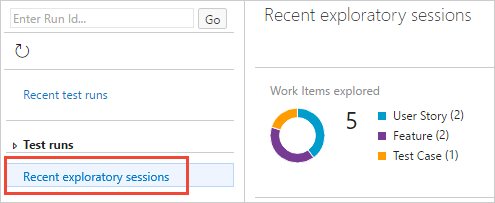
From Test Plans, select Runs > Recent exploratory sessions.
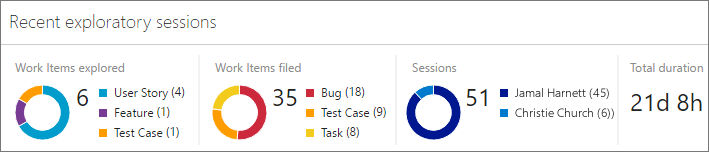
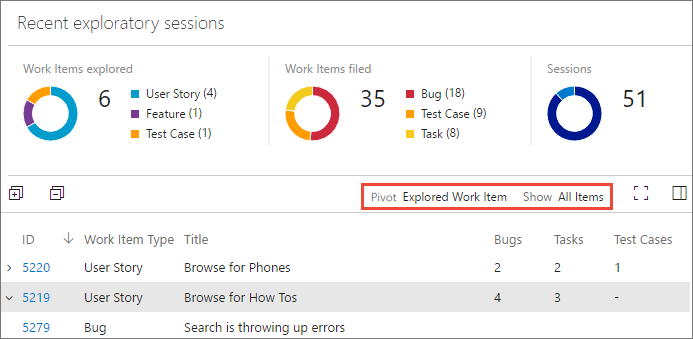
Explore the Recent exploratory sessions page. It contains the following three main sections:
- Summary view - shows a graphical breakdown of the work items explored, work items created, session owners, and the total time for these sessions.
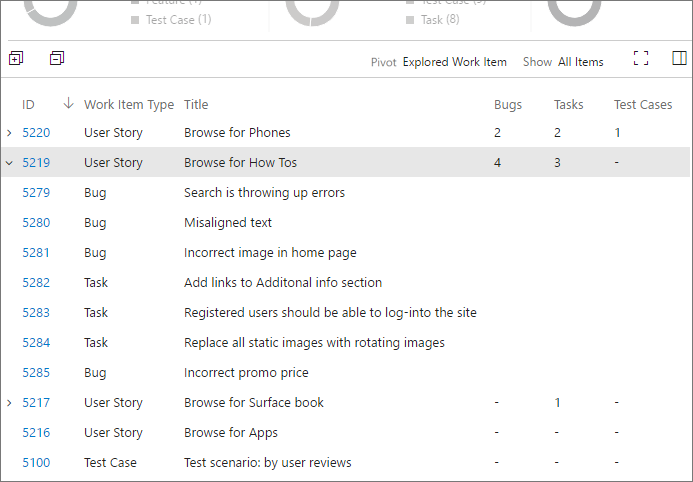
- Pivot view - shows a collapsible nested and sortable list of items grouped in different ways.
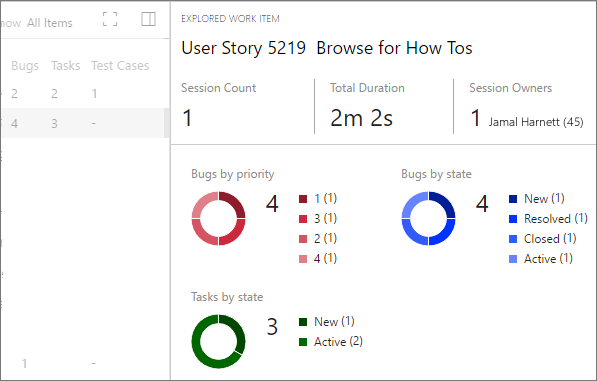
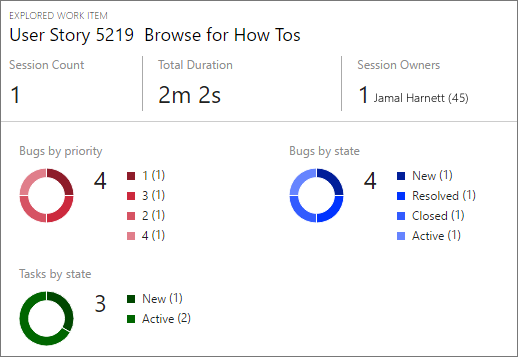
- Details view - shows the work item selected in the Pivot view or a summary of information about a selection of items.
Get insights from your exploratory testing sessions:
Use the Recent exploratory sessions page to get insights about your app from the information collected during your exploratory testing sessions.
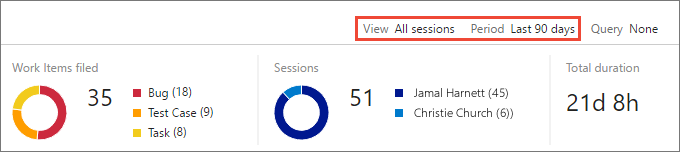
Set the scope for the data. Summary view provides the highest level view of your test results. Use it to get insights into the overall effort and results of the exploratory testing sessions.
- Use the View filter to scope the summary view to all sessions or just your own sessions.
- Use the Period filter to scope the summary view to sessions in the period from the last 7 to the last 90 days.
Pivot the data on the type of work item. Pivot view lets you focus on all the work items you created in your exploratory testing sessions, or just on bugs, tasks, or test cases; and group the results in different ways.
- Use the Pivot filter to group the work items as a nested list based on explored and unexplored (requires a query), by the session in which they were created, or by session owner.
- Use the Show filter to show all items, or only bugs, tasks, or test cases.
Get deep insights from Details view. The Details view gives insights into the items selected in Pivot view. Depending on the type of item you select, you see the work item as an editable form, or a series of charts.
- Select a row in Pivot view to see a summary of all the related information in Details view. For example, if you pivoted the list based on sessions, select a session to see a summary of all the information from the work items in just that session.
- Select a child row in Pivot view to display the work item form for that individual item. For example, if you pivoted the list based on explored work items, expand a work item and select a child bug, task, or test case to see the work item form for just that item.
Discover work items not yet explored
Use a query to discover unexplored work items.
Create a shared query that selects work items using the Test - Feedback extension, such as work items in the epic category, feature category, requirement category, requirement-based suites, or test cases.
You must use a shared query. If this query returns a mix of supported and unsupported work items, only supported categories display.
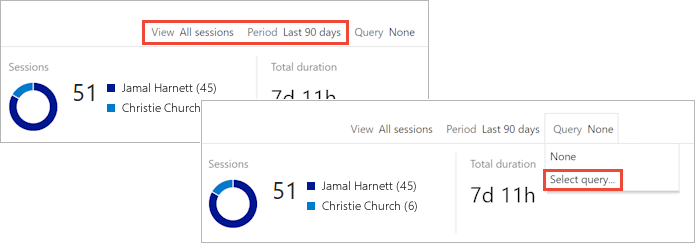
Use the View and Period filters to scope the view to the type of session (all sessions or just your own sessions) and the time span (from the last 7 to the last 90 days). Open the Query list and select Select query.
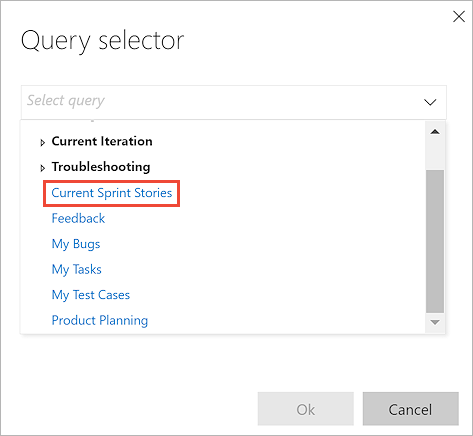
In the Query selector dialog, select the shared query you created earlier.
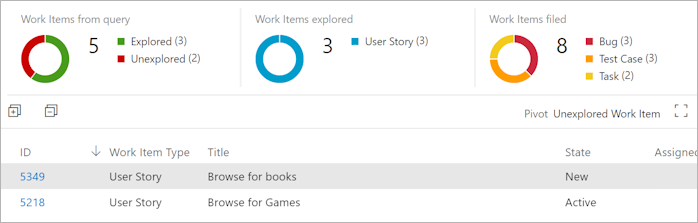
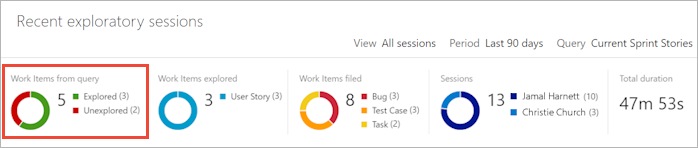
View all the work items returned by the query in the Summary view. You see a breakdown of explored and unexplored work items, work items filed, sessions, and total session duration.
Open the Pivot list and choose Unexplored Work Item.
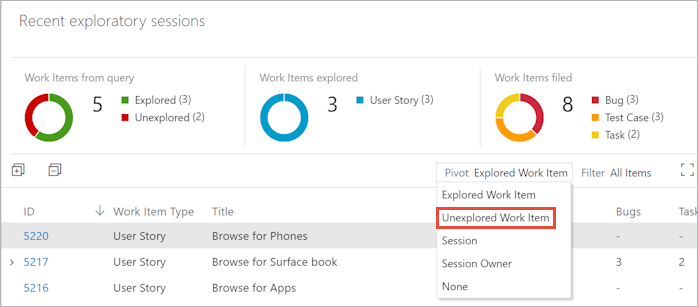
The view shows only the unexplored work items.