Progress Report
Azure DevOps Services | Azure DevOps Server 2022 | Azure DevOps Server 2020
To track the progress of more than one test plan or test suite, use the Progress Report. The Progress Reports helps you track status of passed, failed, or blocked tests, estimations, rate of execution, progress, and more for your team.
- The Progress Report lets you view data for one or more Test Plans in a single project. To view data across projects, use the OData APIs. This report is also rendered using the same OData APIs.
- The report, always shows you the data for the test plan you last accessed. Filter selections aren't stored.
- Report data corresponds to the the current test suite hierarchy in the selected test plans. Hierarchy history isn't stored.
- Report data is updated approximately every 15 minutes. Do not use this report for real-time analysis or reporting. Expect ~15 mins of duration between a test execution and the same to show up in the report.
- Data for test plans migrated from an on-premises Azure DevOps server won't show up in this report.
- Percentage Data will not display the decimal values in this report.
- Some Outcomes are not identified on the Details section even though they contribute to the "Run%" column. Test Cases with Outcome "Blocked", "Not Applicable", and in the paused state are not reflected on the "Passed%" or "Failed%". If you have Test Cases with these Outcomes there will be a difference between the "Run%" and the "Passed%" + "Failed%" sum. The "Not Run" column only counts Test Cases that are showing as "Active" in the current Outcome. You can use the report filters to fine tune the results.
Prerequisites
- You must be a member of a project with Basic access or higher. If you don't have a project yet, create one. For more information, see Sign up for free.
- If you aren't a project member, get added now. Anyone with access to the project, except stakeholders, can view Analytics views.
- Test Plans must be enabled. If it's disabled, the Test Plans > Progress Report page doesn't display. To re-enable Test Plans, see Turn an Azure DevOps service on or off
- Have the View Analytics permission set to Allow. For more information, see Grant permissions to access the Analytics service.
- You must be a member of a project with Basic access or higher. If you aren't a project member, get added now. Anyone with access to the project, except Stakeholders, can view Analytics views.
- Verify that Analytics] is installed, and if not, then enable it. You must be the Organization owner or a member of the Project Collection Administrators group to add extensions or enable the service.
- Test Plans must be enabled. If it's disabled, the Test Plans > Progress Report page doesn't display. To re-enable Test Plans, see Turn an Azure DevOps service on or off
- Have the View Analytics permission set to Allow. For more information, see Grant permissions to access the Analytics service.
Configure the report
Open the report from the web portal by going to Test Plans > Progress Report. The report shows you the status of the test plan you last accessed. However, using the filter bar, you can select one or more test plans in the project.
Understand the report
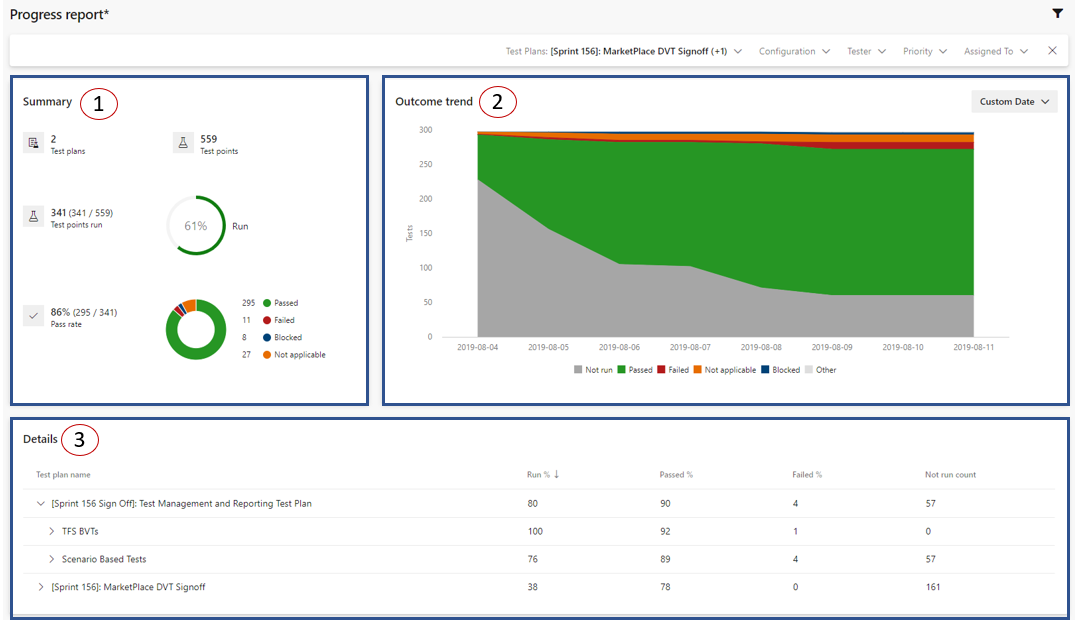
The progress report consists of the following sections.
- Summary: This section provides you with a consolidated view for the selected test plans. To understand what test points are, see Navigate Test Plans.
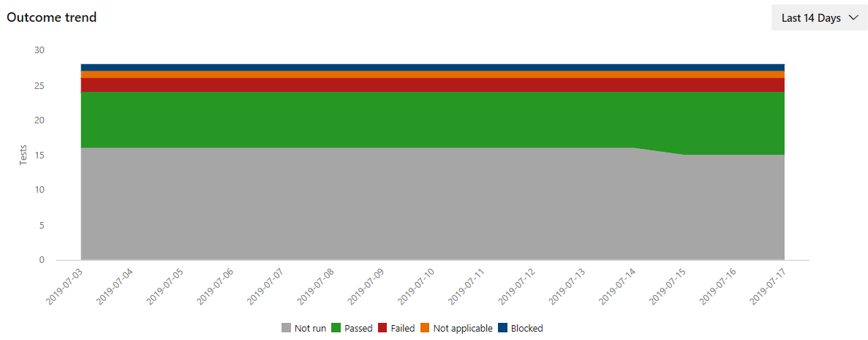
- Outcome trend: This graph renders a daily snapshot to give you an execution and status trendline. It can show data for 14 days (default), 30 days, or a custom range of your choice. Data for today might not appear in this chart based on the time of the day you're looking at the report.
- Details: This section lets you drill down by each test plan and gives you a summary of each test suite. The section also lets you navigate to a test plan or suite of choice by double-clicking on it.
An example of a healthy outcome trend would be as time progresses, the number of unrun tests decreases and the number of passed tests rises.
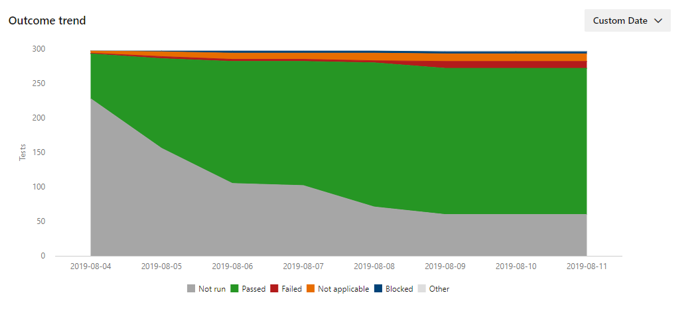
An example of an unhealthy outcome trend would be as time progresses, no significant execution occurs and the number of passed and failed tests remains flat. In such situations, use the details card to drill down and take suitable actions.
Filter
Filter by Test Suites, Configuration, Tester, Test Case Priority, and Test Case Assigned To. For example, you can filter by configuration 'Chrome' and then 'Microsoft Edge' to understand where the execution and pass % are higher. Tester is the user to whom the test point is assigned for execution whereas Assigned To is the user responsible for the reusable test case.
Note
The test plan is considered Level 1. Its child suites are considered level 2. Their child suites in turn are considered level 3. The Test Suites filter shows only the Level 3 test suites inside the selected test plans. To select a Level 2 test suite select all the Level 3 test suites underneath it. This assumes the Level 2 test suites itself does not have any test points.
Related articles
Feedback
Coming soon: Throughout 2024 we will be phasing out GitHub Issues as the feedback mechanism for content and replacing it with a new feedback system. For more information see: https://aka.ms/ContentUserFeedback.
Submit and view feedback for