Note
Access to this page requires authorization. You can try signing in or changing directories.
Access to this page requires authorization. You can try changing directories.
Azure DevOps Services
Use the Test Run Hub to track test execution, analyze results, and maintain quality across development cycles.
A test run captures the execution of one or more test cases – recording outcome, duration, and environment. The system automatically creates test runs when you run test cases from a test plan or pipeline.
Test runs help teams:
- Monitor quality trends – Track pass rates and test progress over time.
- Identify issues quickly – Spot regressions, failures, and blocked tests.
- Maintain test history – Audit and analyze historical execution data.
Access test runs
In your Azure DevOps project, select Test Plans > Runs.

The test runs page lists all manual and automated runs with filtering and search capabilities.

Tip
You can use AI to help with this task later in this article, or see Enable AI assistance with Azure DevOps MCP Server to get started.
Search and filter test runs
The Test Run Hub defaults to manual runs from the past seven days. Use the dropdown filters to narrow results by timeline, run type, and other attributes.
The Test Run Hub supports the following search and filter capabilities:
- Run ID search—Enter an exact test run ID to jump directly to that run. An ID search overrides all other active filters.
- Run title search—Search by run title. The search matches run titles that start with your search term.
- Time range—Search across a timeframe of up to 90 days from any point in time.
- Persistent filters—Filter selections and column widths persist across sessions until you clear them.
Filters work additively. The Test Run Hub displays a maximum of 5,000 results. You can select and copy text from any screen for sharing or documentation.
To customize which columns appear:
Select Column options.
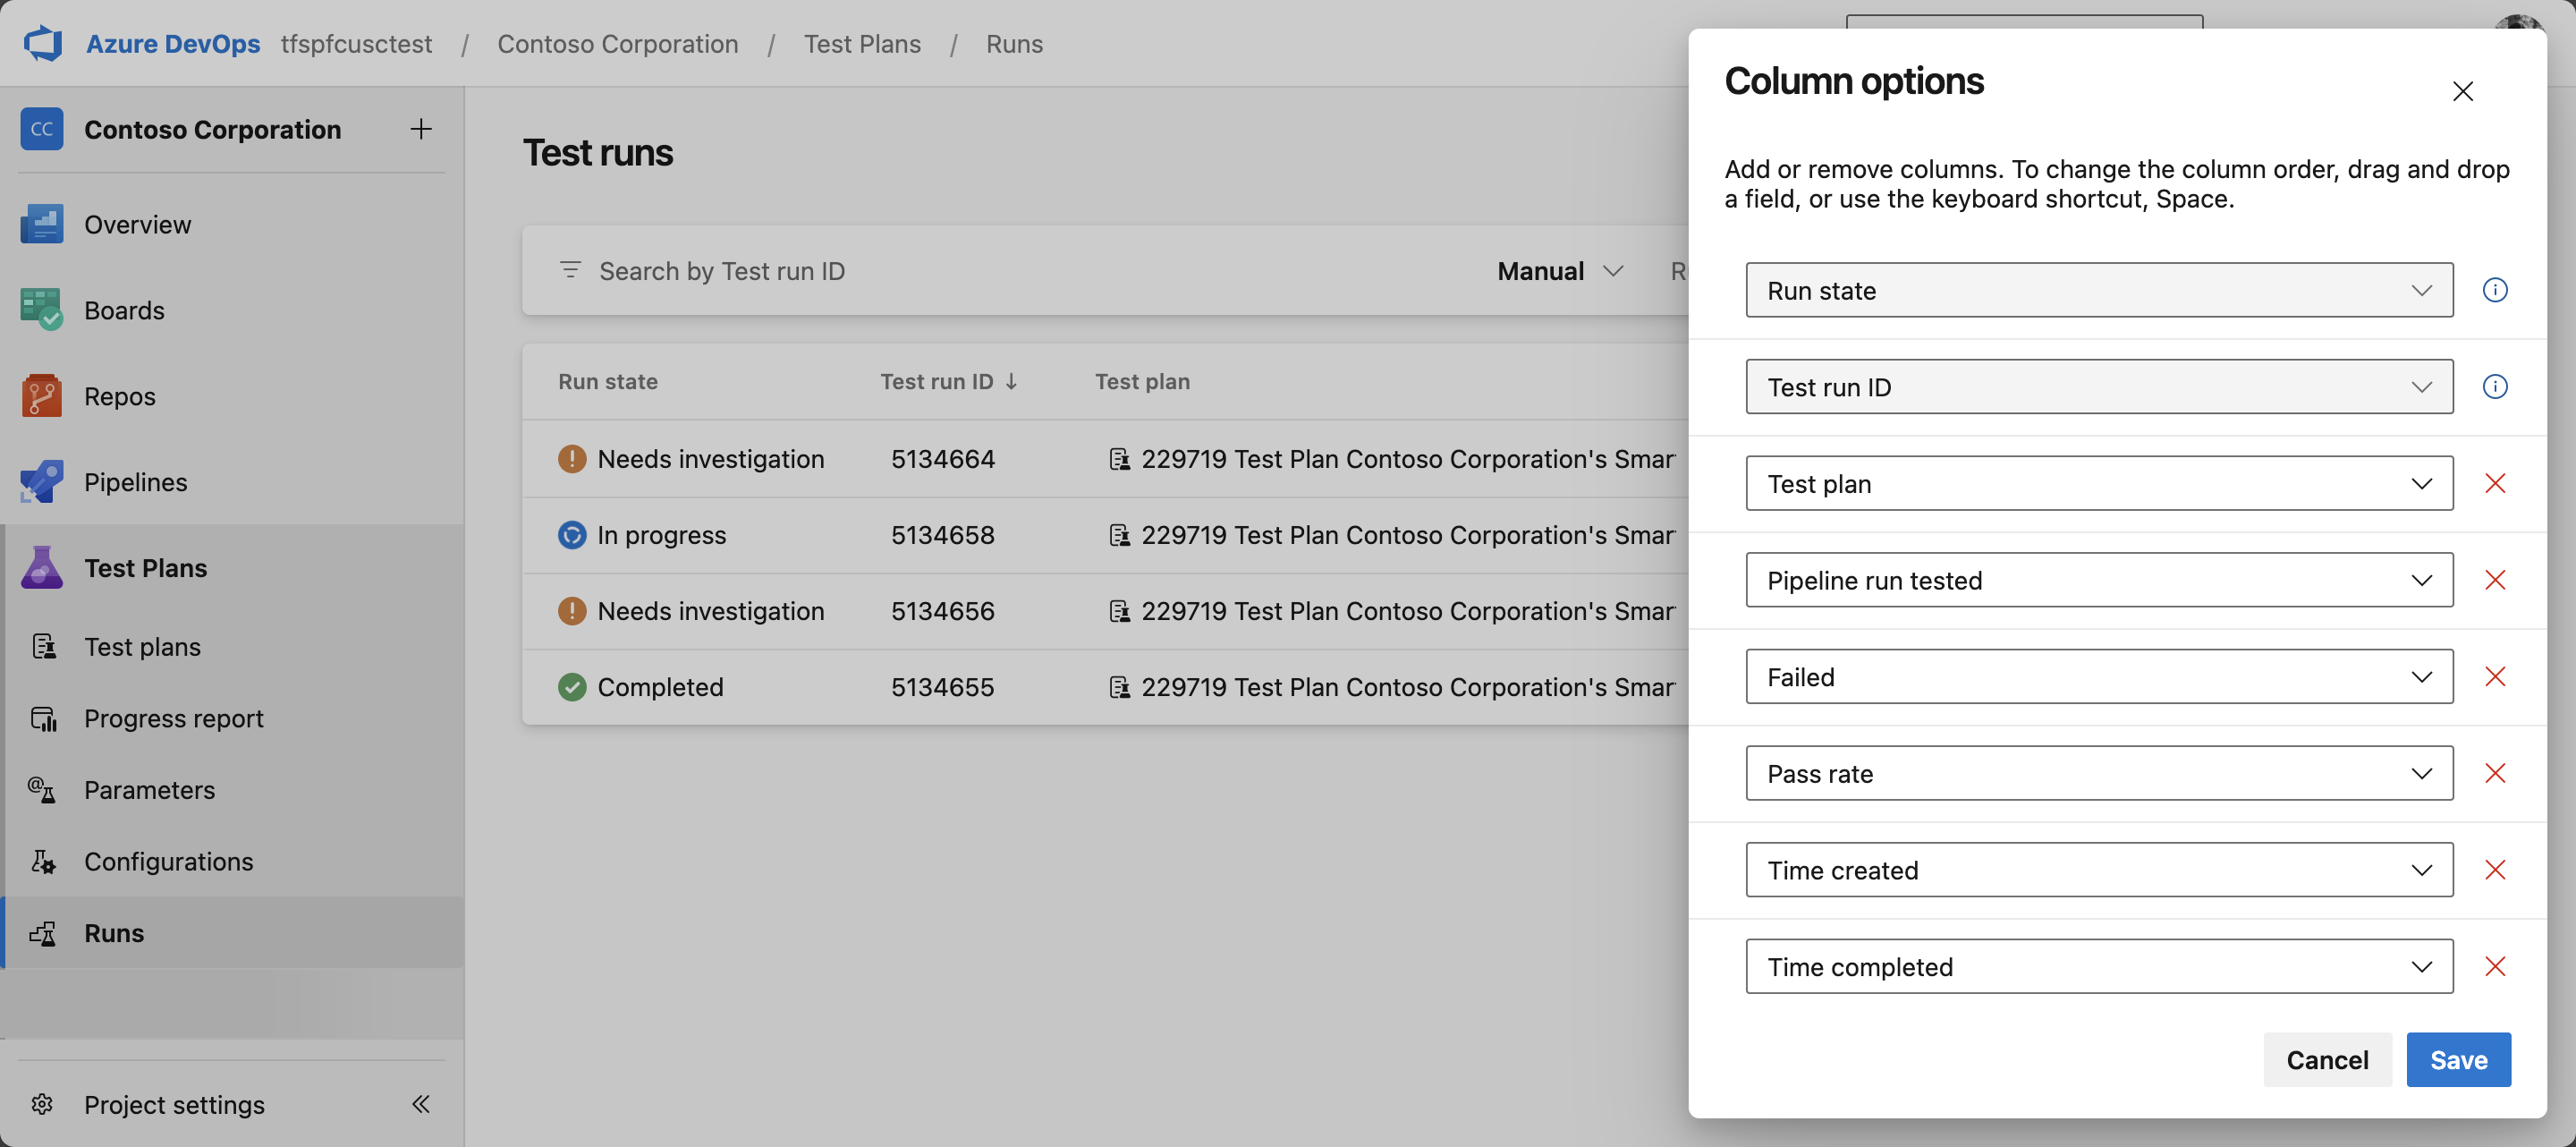
Choose the columns you want, and then select Apply.

Note
The Pipeline Run column applies to automated runs only. It shows the build name for build-triggered runs and the release name for release-triggered runs.
Test run states
The test run state reflects the aggregate outcome of its test cases:
| State | Description |
|---|---|
| Completed | All test cases passed, or all remaining cases passed after Not applicable cases were excluded. |
| Needs investigation | One or more test cases failed or were blocked. |
| In progress | One or more test cases are paused. The run can be resumed. |
View test run details
Select a test run to open its details page. The run details include a summary, an analytics dashboard, and individual test case results.
Run summary
The summary tab shows the overall pass rate, test case outcomes, run metadata, and any attachments or logs captured during execution.
- Pass rate—Percentage of executed cases that passed. Cases marked Not applicable are excluded from the calculation.
- Comments—Run-level comments with Markdown formatting. Tag users with
@, link work items with#, and reference pull requests with!. - Test case results—Outcome of each test case: Passed, Failed, or Not Executed.
- Run metadata—Who ran the test, when it ran, and which environment was used.
- Attachments and logs—Screenshots, logs, and other artifacts captured during execution.

Analytics dashboard
Each test run includes an analytics dashboard that breaks down results by outcome, priority, configuration, failure type, and resolution. Select any subcategory label on a tile to filter the dashboard to that specific breakdown.


Navigate from pipeline logs to test runs
For automated runs triggered by a pipeline, you can go directly from the pipeline run details to the test run summary. Select the test results link in the pipeline logs to open the corresponding run in the Test Run Hub.
Manage attachments
To add attachments to a test run:
In the test run details, select + Add attachments.
Select your files and upload them.

You can then view, download, or delete attachments.

Select a filename to preview images and PDFs inline.
Note
Run-level attachments are separate from test result attachments. To view result-specific files, open the result details and select the Attachments tab.
Work with test case results
Review individual test outcomes and customize column display from the test case results section. For automated runs, the default Outcome filter is set to Failed or Aborted to accelerate triage. For manual runs, all outcomes are shown.

Link results to work items
To associate test results with bugs or other work items:
Select the checkboxes for the test cases you want to link.
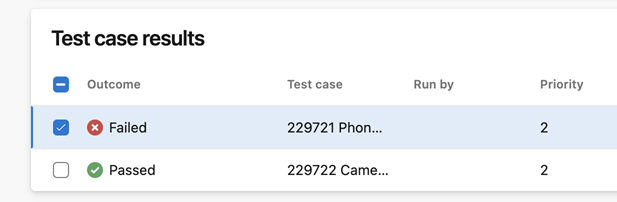
Create a new bug or link to an existing work item.
Link work items across projects
To search for and link bugs or work items that live in a different project than the test result:
- Open a test case result and select + Add in the Linked work items section.
- Enable the Query across projects option.
- Search for the work item by ID or title across all projects in your organization.
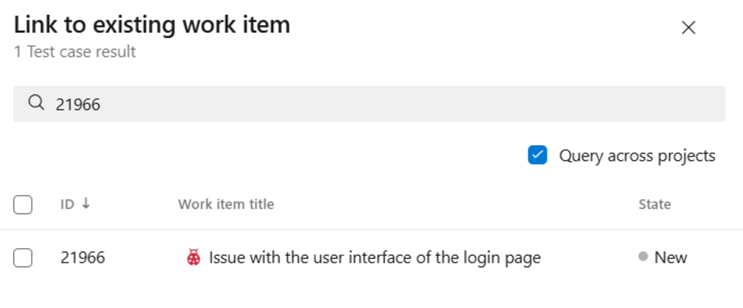
Cross-project linking is useful when shared components or dependencies span multiple projects.
Analyze detailed test results
Select any test case to view its detailed results:
| Section | Description |
|---|---|
| Test result summary | Execution overview for the selected test case. |
| Linked work items | Associated bugs and work items. Select + Add to link more. By default, only work items directly linked to the test result appear, not items linked indirectly through test methods. |
| Test steps | Step-by-step outcomes and comments. Enable Show images to preview captured screenshots inline. |
| Stack trace (automated runs) | Enhanced stack trace view with improved readability for full stack traces. |
| Analysis information | Post-execution analysis and next actions. |
| Attachments | Files attached to this specific test result. For automated runs, all subresult attachments are visible on each test result page. |
The following example shows the detailed results for a selected test case:

For automated runs, the stack trace view provides improved readability for full stack traces:
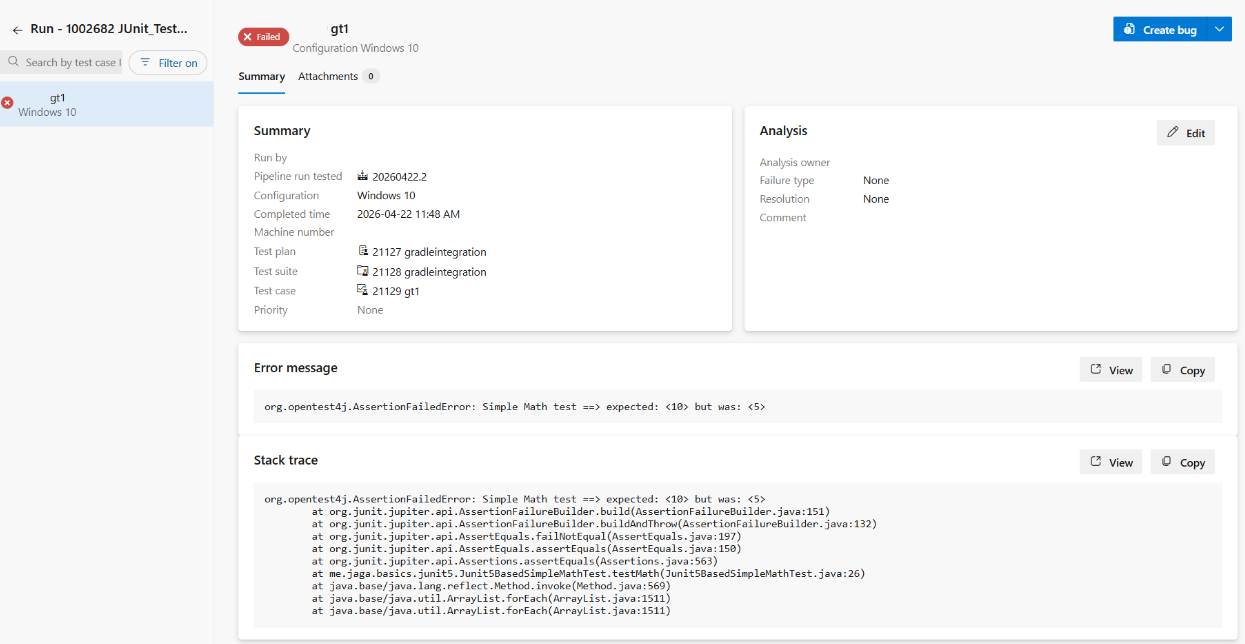
Analysis information
The analysis section helps structure post-execution review. It's available for all test results after execution. Failed, paused, and blocked cases have additional triage fields. Analysis comments are separate from run-level and result-level comments.
To customize dropdown options, such as adding failure types, use the Azure DevOps REST APIs.

Test run retention
Azure DevOps automatically manages the retention of test run data to keep the system performant.
Default retention limits
| Run type | Default retention | Details |
|---|---|---|
| Manual test results | 365 days | Azure DevOps deletes manual test results after one year, unless you configure a different retention period at the project level. |
| Automated test results | Tied to build retention | Automated results are kept as long as the associated build is retained. Deleting a build also deletes its test results. |
Warning
When retention deletes test runs and test results, the related test point outcomes reset to Active. This change can cause progress reports to show decreased run rates.
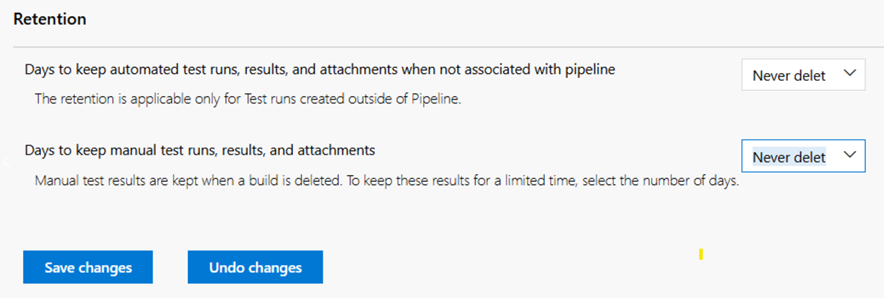
Configure retention settings
These are the default retention settings. To adjust retention limits for your project:
- Go to Project settings > Test > Retention.
- Set the number of days to retain manual test results.
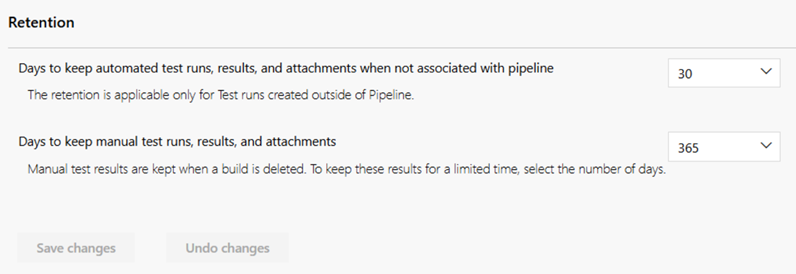
If you want test runs to never be deleted, select the Never delete option.
To keep automated test results after their associated builds are deleted, edit the build retention policy and configure test result retention separately. For Git repositories, you can specify retention based on the branch.
For detailed configuration steps, see Set test retention policies. For build-level retention settings, see Set retention policies for builds, releases, and tests.
Use AI to manage test runs
If you configure the Azure DevOps MCP Server, you can use AI assistants to manage your test runs by using natural language prompts.
Example prompts for test run management
| Task | Example prompt |
|---|---|
| View recent test runs | Show all test runs in project <Contoso> from the last 7 days |
| Check test run results | Show the results of test run <56789> in project <Contoso> |
| Find failing tests | List all failed test cases in the most recent test run for test plan <12345> |
| Analyze test trends | Show test run pass rates for project <Contoso> over the last 30 days |
| Track test progress | Show the count of passed, failed, and not-run test cases in test plan <12345> |
| Find blocked tests | List test cases in test run <56789> that have outcome = <Blocked> |
| Compare two test runs | Compare the results of test run <56789> and test run <56790> in project <Contoso> |
| Find untested areas | List area paths in project <Contoso> with no test runs in the last 14 days |
| Identify longest-running tests | Show the 10 test cases with the longest execution time in test run <56789> |
| Surface regressions | List test cases that passed in test run <56789> but failed in test run <56790> |
Tip
If you're using Visual Studio Code, agent mode is especially helpful for troubleshooting complex test run scenarios.
- To avoid using stale or cached data from previous queries, add to your prompt, "Don't use previously fetched data."