Note
Access to this page requires authorization. You can try signing in or changing directories.
Access to this page requires authorization. You can try changing directories.
DevTest Labs gives you warnings if a machine name is invalid or if you're about to violate a lab policy. Sometimes, you see red X next to your lab VM or environment status that informs you that something went wrong. This article provides a few tricks that you can use to find the underlying issue and, hopefully, avoid the issue in the future.
Portal notifications
If you're using the Azure portal, the first place to look at is the notifications panel. The notifications panel, available on the main command bar by clicking the bell icon, tells you whether the lab VM or environment creation was successful or not. If there was a failure, you see the error message associated with the creation failure. The details often give further information to help you resolve the issue. In the following example, the virtual machine creation failed because you exceeded the limit of virtual machines allowed in the lab.

VM in corrupted state
If you see the status of your VM in the lab as Corrupted, the underlying VM might have been deleted from the Virtual Machine page that user can navigate to from the Virtual Machines page (not from the DevTest Labs page). Clean up your lab in DevTest Labs by deleting the VM from the lab. Then, recreate your VM in the lab.

Activity logs
Look at activity logs if you're investigating a failure sometime after attempting the creation of your VM or environment. There are three types of activity logs available from the Lab page; logs for activities affecting lab configuration and policies, logs for VMs and logs for environments. The error you're troubleshooting might be in any one of these logs, depending on its source. This section shows you how to find these logs.
Activity log for lab configuration and policies
Activity logs for configuration and policies show events generated by the lab configuration settings or any lab policies you set. In this example, you see the error that details the VM creation failure referenced in the portal notification shown earlier. To see the activity logs for lab configuration and policies, follow these steps:
On the home page for your lab, select Configuration and policies on the left menu.
On the Configuration and policies page, select Activity log on the menu.
In the activity log items, expand the failed operation
Create a virtual machine, then select the failed operationAdd or modify virtual machineto see the details.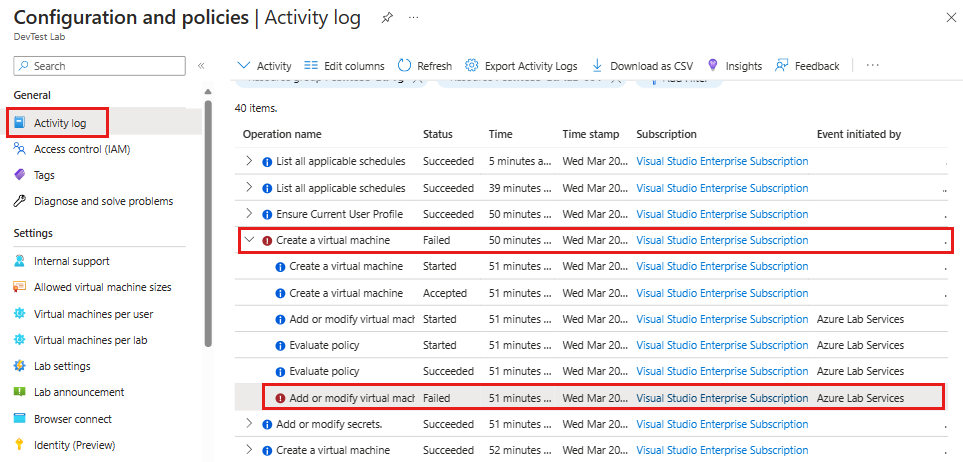
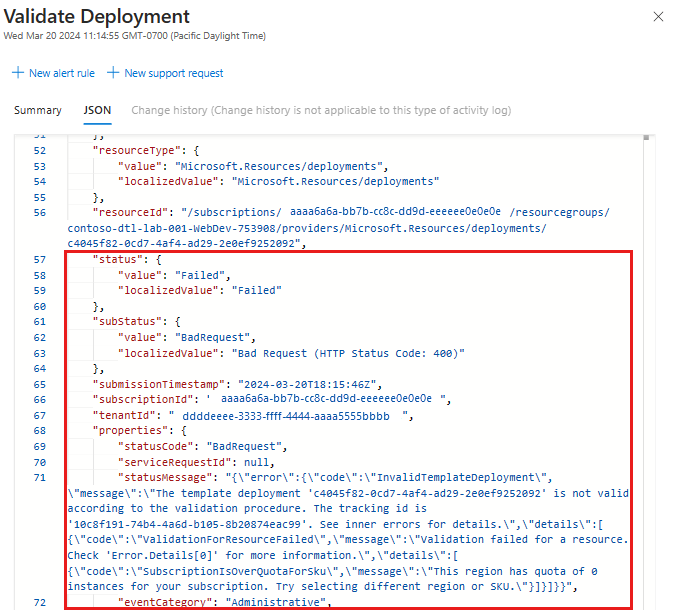
In the right pane, switch to the JSON tab. You see the details in the JSON view of the log.

Look through the JSON log until you find the
statusMessageproperty. It gives you the main error message and further detail information, if applicable. The following JSON is an example for the core quoted exceeded error seen earlier in this article."properties": { "statusCode": "Conflict", "statusMessage": "{\"status\":\"Failed\",\"error\":{\"code\":\"ResourceDeploymentFailure\",\"message\":\"The resource operation completed with terminal provisioning state 'Failed'.\",\"details\":[{\"code\":\"OperationNotAllowed\",\"message\":\"Operation results in exceeding quota limits of Core. Maximum allowed: 100, Current in use: 100, Additional requested: 8. Please read more about quota increase at https://aka.ms/corequotaincrease.\"}]}}", },


Activity log for a virtual machine
Activity logs for virtual machines show events generated by the virtual machine, like starting and stopping. To see the activity logs for a virtual machine, follow these steps:
On the home page for your lab, select the VM to launch the Virtual Machine page.
On the Virtual Machine page, in the General section of the left menu, select Activity log to see all logs associated with the VM.
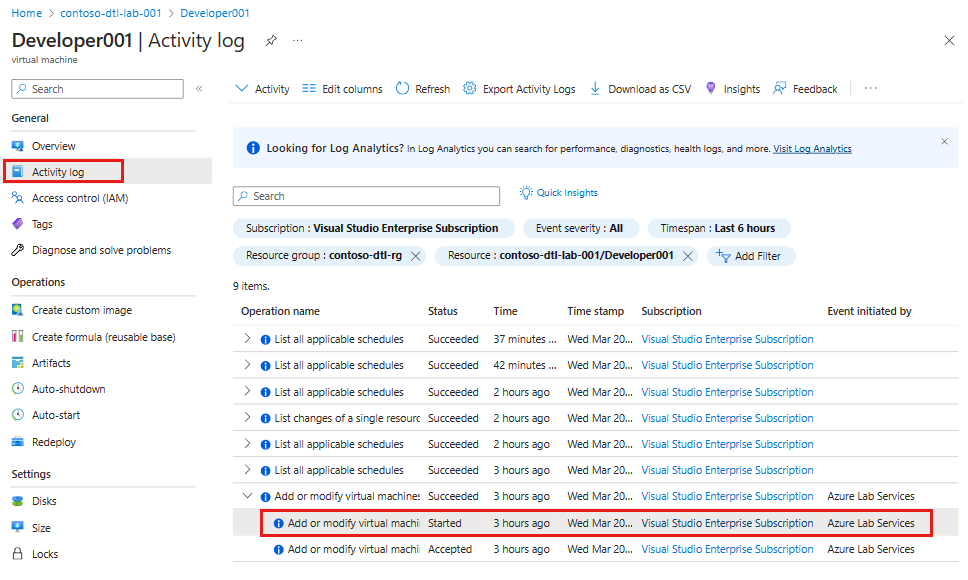
Select the event you're interested in to see the details.
To see the details of the event, switch to the JSON tab.

Activity log for an environment
Activity logs for environments show events generated by the environment, like deployments. In this example, you see an error generated by a failed environment creation attempt. To see the activity log for an environment, follow these steps:
On the home page for your lab, select the environment.
On the environment page, select Activity log on the left menu.
Look for the failure in the activity list in the log and select it.
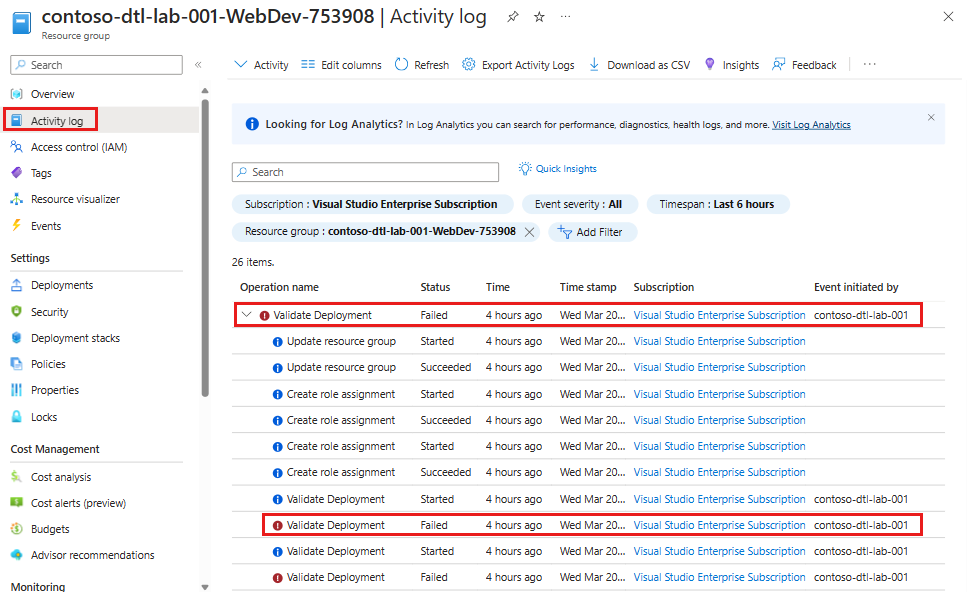
In the right pane, switch to the JSON tab, and look for the statusMessage.


Resource Manager template deployment logs
If your environment or virtual machine was created through automation, there's one last place to look error information; the Azure Resource Manager template deployment log. When a lab resource is often created through an Azure Resource Manager template deployment. See https://github.com/Azure/azure-devtestlab/tree/master/samples/DevTestLabs/QuickStartTemplates for sample Azure Resource Manager templates that create DevTest Labs resources.
To see the lab template deployment logs, follow these steps:
- Launch the page for the resource group in which the lab exists.
- Select Deployments on the left menu under Settings.
- Look for deployments with a failed status and select it.
- On the Deployment page, select Operation details link for the operation that failed.
- You see details about the operation that failed in the Operation details window.