Note
Access to this page requires authorization. You can try signing in or changing directories.
Access to this page requires authorization. You can try changing directories.
This article contains all the monitoring reference information for this service.
See Monitor Azure Firewall for details on the data you can collect for Azure Firewall and how to use it.
Metrics
This section lists all the automatically collected platform metrics for this service. These metrics are also part of the global list of all platform metrics supported in Azure Monitor.
For information on metric retention, see Azure Monitor Metrics overview.
Supported metrics for Microsoft.Network/azureFirewalls
The following table lists the metrics available for the Microsoft.Network/azureFirewalls resource type.
- All columns might not be present in every table.
- Some columns might be beyond the viewing area of the page. Select Expand table to view all available columns.
Table headings
- Category - The metrics group or classification.
- Metric - The metric display name as it appears in the Azure portal.
- Name in REST API - The metric name as referred to in the REST API.
- Unit - Unit of measure.
- Aggregation - The default aggregation type. Valid values: Average (Avg), Minimum (Min), Maximum (Max), Total (Sum), Count.
- Dimensions - Dimensions available for the metric.
- Time Grains - Intervals at which the metric is sampled. For example,
PT1Mindicates that the metric is sampled every minute,PT30Mevery 30 minutes,PT1Hevery hour, and so on. - DS Export- Whether the metric is exportable to Azure Monitor Logs via diagnostic settings. For information on exporting metrics, see Create diagnostic settings in Azure Monitor.
| Metric | Name in REST API | Unit | Aggregation | Dimensions | Time Grains | DS Export |
|---|---|---|---|---|---|---|
| Application rules hit count Number of times Application rules were hit |
ApplicationRuleHit |
Count | Total (Sum) | Status, Reason, Protocol |
PT1M | Yes |
| Data processed Total amount of data processed by this firewall |
DataProcessed |
Bytes | Total (Sum) | <none> | PT1M | Yes |
| Firewall health state Indicates the overall health of this firewall |
FirewallHealth |
Percent | Average | Status, Reason |
PT1M | Yes |
| Latency Probe (Preview) Estimate of the average latency of the Firewall as measured by latency probe |
FirewallLatencyPng |
Milliseconds | Average | <none> | PT1M | Yes |
| Network rules hit count Number of times Network rules were hit |
NetworkRuleHit |
Count | Total (Sum) | Status, Reason |
PT1M | Yes |
| Observed Capacity Units Reported number of capacity units for the Azure Firewall |
ObservedCapacity |
Unspecified | Average, Minimum, Maximum | <none> | PT1M | Yes |
| SNAT port utilization Percentage of outbound SNAT ports currently in use |
SNATPortUtilization |
Percent | Average, Maximum | Protocol |
PT1M | Yes |
| Throughput Throughput processed by this firewall |
Throughput |
BitsPerSecond | Average | <none> | PT1M | No |
Observed capacity
The Observed Capacity metric is the primary tool for understanding how your firewall is scaling in practice.
Best practices for using Observed Capacity
- Validate your prescaling setup: Confirm that your firewall consistently maintains the minCapacity you defined.
- Track real-time scaling behavior: Use the Avg aggregation to see real-time capacity units.
- Forecast future needs: Combine historical Observed Capacity with traffic trends (for example, monthly spikes or seasonal events) to refine your capacity planning.
- Set proactive alerts: Configure Azure Monitor alerts on Observed Capacity thresholds (for example, alert when scaling exceeds 80% of maxCapacity).
- Correlate with performance metrics: Pair Observed Capacity with Throughput, Latency Probe, and SNAT Port Utilization to diagnose whether scaling keeps up with demand.
Firewall health state
In the preceding table, the Firewall health state metric has two dimensions:
- Status: Possible values are Healthy, Degraded, Unhealthy.
- Reason: Indicates the reason for the corresponding status of the firewall.
If SNAT ports are used more than 95%, they're considered exhausted and the health is 50% with status=Degraded and reason=SNAT port. The firewall keeps processing traffic and existing connections aren't affected. However, new connections might not be established intermittently.
If SNAT ports are used less than 95%, then firewall is considered healthy and health is shown as 100%.
If no SNAT ports usage is reported, health is shown as 0%.
SNAT port utilization
For the SNAT port utilization metric, when you add more public IP addresses to your firewall, more SNAT ports are available, reducing the SNAT ports utilization. Additionally, when the firewall scales out for different reasons (for example, CPU or throughput) more SNAT ports also become available.
Effectively, a given percentage of SNAT ports utilization might go down without you adding any public IP addresses, just because the service scaled out. You can directly control the number of public IP addresses available to increase the ports available on your firewall. But, you can't directly control firewall scaling.
If your firewall is running into SNAT port exhaustion, you should add at least five public IP addresses. This increases the number of SNAT ports available. For more information, see Azure Firewall features.
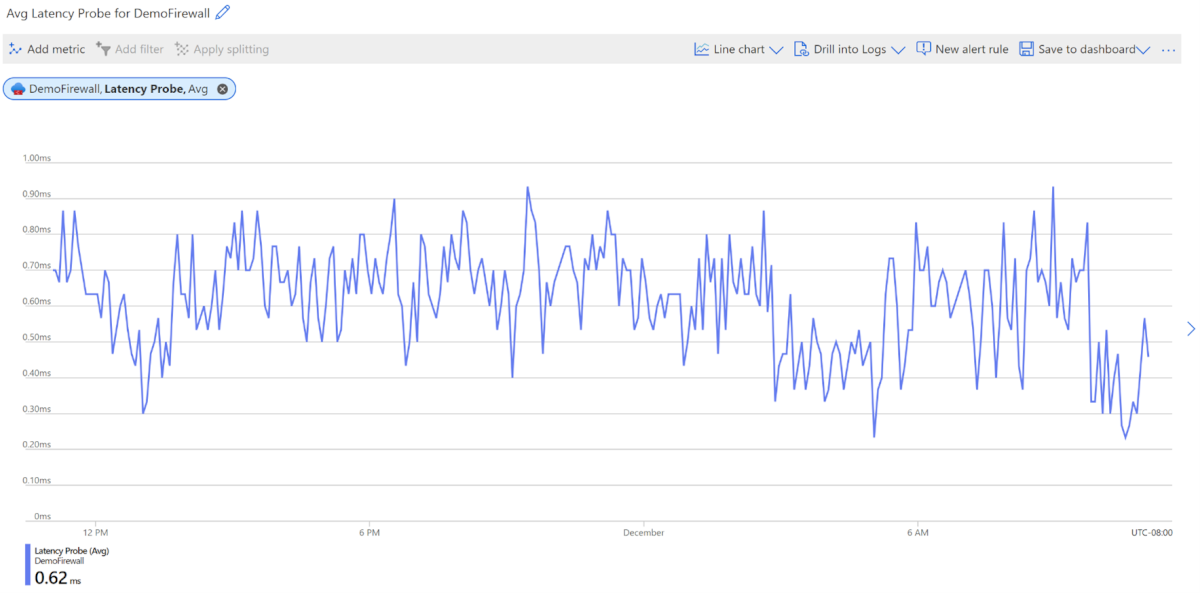
AZFW Latency Probe
The AZFW Latency Probe metric measures the overall or average latency of Azure Firewall in milliseconds. Administrators can use this metric for the following purposes:
- Diagnose whether Azure Firewall causes latency in the network
- Monitor and alert for latency or performance issues, so IT teams can proactively engage
- Identify various factors that can cause high latency in Azure Firewall, such as high CPU utilization, high throughput, or networking issues
What the AZFW Latency Probe metric measures
- Measures: The latency of Azure Firewall within the Azure platform
- Doesn't measure: End-to-end latency for the entire network path. The metric reflects the performance within the firewall rather than the latency Azure Firewall introduces into the network
- Error reporting: If the latency metric isn't functioning correctly, it reports a value of 0 in the metrics dashboard, indicating a probe failure or interruption
Factors that impact latency
Several factors can affect firewall latency:
- High CPU utilization
- High throughput or traffic load
- Networking issues within the Azure platform
Latency probes: From ICMP to TCP
The latency probe currently uses Microsoft's Ping Mesh technology, which is based on ICMP (Internet Control Message Protocol). ICMP is suitable for quick health checks, such as ping requests, but it might not accurately represent real-world application traffic, which typically relies on TCP. However, ICMP probes prioritize differently across the Azure platform, which can result in variation across SKUs. To reduce these discrepancies, Azure Firewall plans to transition to TCP-based probes.
Important considerations:
- Latency spikes: With ICMP probes, intermittent spikes are normal and part of the host network's standard behavior. Don't misinterpret these spikes as firewall issues unless they persist.
- Average latency: On average, Azure Firewall latency ranges from 1 ms to 10 ms, depending on the Firewall SKU and deployment size.
Best practices for monitoring latency
Set a baseline: Establish a latency baseline under light traffic conditions for accurate comparisons during normal or peak usage.
Note
When establishing your baseline, expect occasional metric spikes due to recent infrastructure changes. These temporary spikes are normal and result from metric reporting adjustments, not actual issues. Only submit a support request if spikes persist over time.
Monitor for patterns: Expect occasional latency spikes as part of normal operations. If high latency persists beyond these normal variations, it may indicate a deeper issue requiring investigation.
Recommended latency threshold: A recommended guideline is that latency should not exceed 3x the baseline. If this threshold is crossed, further investigation is recommended.
Check the rule limit: Ensure that the network rules are within the 20K rule limit. Exceeding this limit can affect performance.
New application onboarding: Check for any newly onboarded applications that could be adding significant load or causing latency issues.
Support request: If you observe continuous latency degradation that does not align with expected behavior, consider filing a support ticket for further assistance.
Metric dimensions
For information about what metric dimensions are, see Multi-dimensional metrics.
This service has the following dimensions associated with its metrics.
- Protocol
- Reason
- Status
Resource logs
This section lists the types of resource logs you can collect for this service. The section pulls from the list of all resource logs category types supported in Azure Monitor.
Supported resource logs for Microsoft.Network/azureFirewalls
| Category | Category display name | Log table | Supports basic log plan | Supports ingestion-time transformation | Example queries | Costs to export |
|---|---|---|---|---|---|---|
AZFWApplicationRule |
Azure Firewall Application Rule | AZFWApplicationRule Contains all Application rule log data. Each match between data plane and Application rule creates a log entry with the data plane packet and the matched rule's attributes. |
Yes | Yes | Queries | Yes |
AZFWApplicationRuleAggregation |
Azure Firewall Application Rule Aggregation (Policy Analytics) | AZFWApplicationRuleAggregation Contains aggregated Application rule log data for Policy Analytics. |
Yes | Yes | Yes | |
AZFWDnsAdditional |
Azure Firewall DNS Flow Trace Log | AZFWDnsFlowTrace Contains all the DNS proxy data between the client, firewall, and DNS server. |
Yes | No | Yes | |
AZFWDnsQuery |
Azure Firewall DNS query | AZFWDnsQuery Contains all DNS Proxy events log data. |
Yes | Yes | Queries | Yes |
AZFWFatFlow |
Azure Firewall Fat Flow Log | AZFWFatFlow This query returns the top flows across Azure Firewall instances. Log contains flow information, date transmission rate (in Megabits per second units) and the time period when the flows were recorded. Please follow the documentation to enable Top flow logging and details on how it is recorded. |
Yes | Yes | Queries | Yes |
AZFWFlowTrace |
Azure Firewall Flow Trace Log | AZFWFlowTrace Flow logs across Azure Firewall instances. Log contains flow information, flags and the time period when the flows were recorded. Please follow the documentation to enable flow trace logging and details on how it is recorded. |
Yes | Yes | Queries | Yes |
AZFWFqdnResolveFailure |
Azure Firewall FQDN Resolution Failure | No | No | Yes | ||
AZFWIdpsSignature |
Azure Firewall IDPS Signature | AZFWIdpsSignature Contains all data plane packets that were matched with one or more IDPS signatures. |
Yes | Yes | Queries | Yes |
AZFWNatRule |
Azure Firewall Nat Rule | AZFWNatRule Contains all DNAT (Destination Network Address Translation) events log data. Each match between data plane and DNAT rule creates a log entry with the data plane packet and the matched rule's attributes. |
Yes | Yes | Queries | Yes |
AZFWNatRuleAggregation |
Azure Firewall Nat Rule Aggregation (Policy Analytics) | AZFWNatRuleAggregation Contains aggregated NAT Rule log data for Policy Analytics. |
Yes | Yes | Yes | |
AZFWNetworkRule |
Azure Firewall Network Rule | AZFWNetworkRule Contains all Network Rule log data. Each match between data plane and network rule creates a log entry with the data plane packet and the matched rule's attributes. |
Yes | Yes | Queries | Yes |
AZFWNetworkRuleAggregation |
Azure Firewall Network Rule Aggregation (Policy Analytics) | AZFWNetworkRuleAggregation Contains aggregated Network rule log data for Policy Analytics. |
Yes | Yes | Yes | |
AZFWThreatIntel |
Azure Firewall Threat Intelligence | AZFWThreatIntel Contains all Threat Intelligence events. |
Yes | Yes | Queries | Yes |
AzureFirewallApplicationRule |
Azure Firewall Application Rule (Legacy Azure Diagnostics) | AzureDiagnostics Logs from multiple Azure resources. |
No | No | Queries | No |
AzureFirewallDnsProxy |
Azure Firewall DNS Proxy (Legacy Azure Diagnostics) | AzureDiagnostics Logs from multiple Azure resources. |
No | No | Queries | No |
AzureFirewallNetworkRule |
Azure Firewall Network Rule (Legacy Azure Diagnostics) | AzureDiagnostics Logs from multiple Azure resources. |
No | No | Queries | No |
DNS Flow Trace Logs
The DNS Flow Trace logs provide deeper visibility into DNS activity, helping administrators troubleshoot resolution issues and verify traffic behavior.
Previously, DNS Proxy logging was limited to:
- AZFWDNSQuery - the initial client query
- AZFWInternalFqdnResolutionFailure - FQDN resolution failures
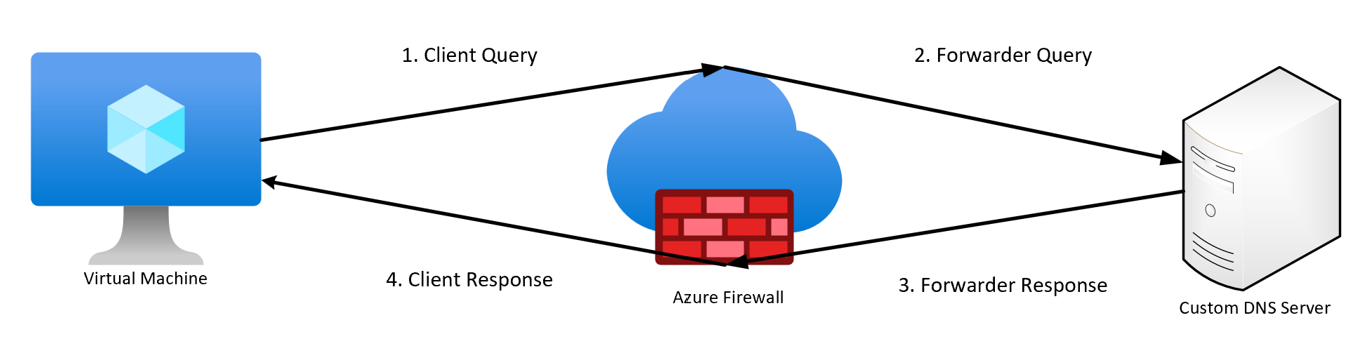
With the DNS flow trace logs, administrators can trace the complete DNS resolution flow from the client query through Azure Firewall as a DNS proxy, to the external DNS server, and back to the client.
DNS resolution stages
The logs capture the following stages:
- Client query: The initial DNS query sent by the client
- Forwarder query: Azure Firewall forwarding the query to an external DNS server (if not cached)
- Forwarder response: The DNS server's response to Azure Firewall
- Client response: The final resolved response from Azure Firewall back to the client
The following diagram shows a high-level visual representation of the DNS query flow:
These logs provide valuable insights, such as:
- The DNS server queried
- Resolved IP addresses
- Whether the Azure Firewall cache was used
Enabling DNS Flow Trace Logs
Before setting up DNS Flow Trace Logs, you must first enable the feature using Azure PowerShell.
Enable logs (prerequisite)
Run the following commands in Azure PowerShell, replacing placeholders with your values:
Set-AzContext -SubscriptionName <SubscriptionName>
$firewall = Get-AzFirewall -ResourceGroupName <ResourceGroupName> -Name <FirewallName>
$firewall.EnableDnstapLogging = $true
Set-AzFirewall -AzureFirewall $firewall
Disable logs (optional)
To disable the logs, use the same previous Azure PowerShell command and set the value to False:
Set-AzContext -SubscriptionName <SubscriptionName>
$firewall = Get-AzFirewall -ResourceGroupName <ResourceGroupName> -Name <FirewallName>
$firewall.EnableDnstapLogging = $false
Set-AzFirewall -AzureFirewall $firewall
Configure DNS proxy and DNS flow trace logs
Use the following steps to configure DNS proxy and enable DNS flow trace logs:
Enable DNS proxy:
- Navigate to Azure Firewall DNS settings and enable DNS Proxy.
- Configure a custom DNS server or use the default Azure DNS.
- Navigate to Virtual Network DNS settings and set the Firewall's private IP as the primary DNS server.
Enable DNS flow trace logs:
- Navigate to Azure Firewall in the Azure portal.
- Select Diagnostic settings under Monitoring.
- Choose an existing diagnostic setting or create a new one.
- Under the Log section, select DNS Flow Trace Logs.
- Choose your desired destination (Log Analytics or Storage Account).
Note
DNS Flow Trace Logs are not supported with Event Hub as a destination.
- Save the settings.
Test the configuration:
- Generate DNS queries from clients and verify the logs in the chosen destination.
Understand the logs
Each log entry corresponds to a specific stage in the DNS resolution process. The following table describes the log types and key fields:
| Type | Description | Key Fields |
|---|---|---|
Client Query |
The initial DNS query sent by the client. | SourceIp: The client's internal IP address making the DNS request, QueryMessage: The full DNS query payload, including the requested domain |
Forwarder Query |
Azure Firewall forwarding the DNS query to an external DNS server (if not cached). | ServerIp: The IP address of the external DNS server that receives the query, QueryMessage: The forwarded DNS query payload, identical or based on the client request |
Forwarder Response |
The DNS server's response to Azure Firewall. | ServerMessage: The DNS response payload from the external server., AnswerSection: Contains resolved IP addresses, CNAMEs, and any DNSSEC validation results (if applicable). |
Client Response |
The final resolved response from Azure Firewall back to the client. | ResolvedIp: The IP address (or addresses) resolved for the queried domain., ResponseTime: The total time taken to resolve the query, measured from the client’s request to the returned answer |
The above fields are only a subset of the available fields in each log entry.
Key notes:
- If the DNS cache is used, only Client Query and Client Response entries are generated.
- Logs include standard metadata such as timestamps, source/destination IPs, protocols, and DNS message content.
- To avoid excessive log volume in environments with many short-lived queries, enable additional DNS Proxy logs only when deeper DNS troubleshooting is required.
Top flows
The top flows log is known in the industry as fat flow log and in the preceding table as Azure Firewall Fat Flow Log. The top flows log shows the top connections that contribute to the highest throughput through the firewall.
Tip
Activate Top flows logs only when troubleshooting a specific issue to avoid excessive CPU usage of Azure Firewall.
The flow rate is defined as the data transmission rate in megabits per second units. It's a measure of the amount of digital data that can be transmitted over a network in a period of time through the firewall. The Top Flows protocol runs periodically every three minutes. The minimum threshold to be considered a Top Flow is 1 Mbps.
Enable Top flows logs
Use the following Azure PowerShell commands to enable Top flows logs:
Set-AzContext -SubscriptionName <SubscriptionName>
$firewall = Get-AzFirewall -ResourceGroupName <ResourceGroupName> -Name <FirewallName>
$firewall.EnableFatFlowLogging = $true
Set-AzFirewall -AzureFirewall $firewall
Disable Top flows logs
To disable the logs, use the same Azure PowerShell command and set the value to False. For example:
Set-AzContext -SubscriptionName <SubscriptionName>
$firewall = Get-AzFirewall -ResourceGroupName <ResourceGroupName> -Name <FirewallName>
$firewall.EnableFatFlowLogging = $false
Set-AzFirewall -AzureFirewall $firewall
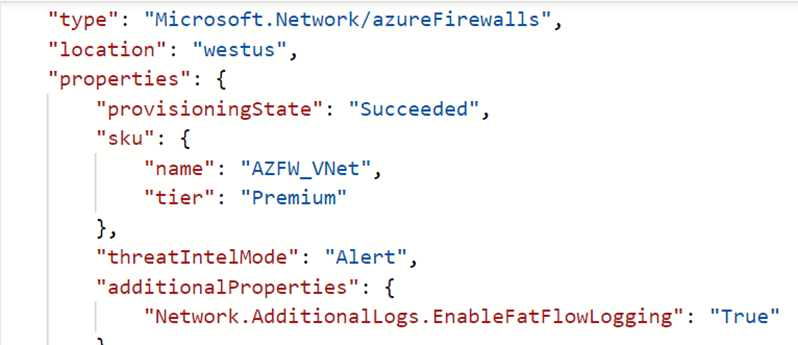
Verify the configuration
There are multiple ways to verify the update was successful. Navigate to the firewall Overview and select JSON view on the top right corner. Here's an example:
To create a diagnostic setting and enable Resource Specific Table, see Create diagnostic settings in Azure Monitor.
Flow trace
The firewall logs show traffic through the firewall in the first attempt of a TCP connection, known as the SYN packet. However, such an entry doesn't show the full journey of the packet in the TCP handshake. As a result, it's difficult to troubleshoot if a packet is dropped or asymmetric routing occurred. The Azure Firewall Flow Trace Log addresses this concern.
Tip
To avoid excessive disk usage caused by Flow trace logs in Azure Firewall with many short-lived connections, activate the logs only when troubleshooting a specific issue for diagnostic purposes.
Flow trace properties
The following properties can be added:
SYN-ACK: ACK flag that indicates acknowledgment of SYN packet.
FIN: Finished flag of the original packet flow. No more data is transmitted in the TCP flow.
FIN-ACK: ACK flag that indicates acknowledgment of FIN packet.
RST: The Reset flag indicates the original sender doesn't receive more data.
INVALID (flows): Indicates packet can't be identified or doesn't have any state.
For example:
- A TCP packet lands on a Virtual Machine Scale Sets instance, which doesn't have any prior history for this packet
- Bad CheckSum packets
- Connection Tracking table entry is full and new connections can't be accepted
- Overly delayed ACK packets
Enable Flow trace logs
Use the following Azure PowerShell commands to enable Flow trace logs. Alternatively, navigate in the portal and search for Enable TCP Connection Logging:
Connect-AzAccount
Select-AzSubscription -Subscription <subscription_id> or <subscription_name>
Register-AzProviderFeature -FeatureName AFWEnableTcpConnectionLogging -ProviderNamespace Microsoft.Network
Register-AzResourceProvider -ProviderNamespace Microsoft.Network
It can take several minutes for this change to take effect. Once the feature is registered, consider performing an update on Azure Firewall for the change to take effect immediately.
Check registration status
To check the status of the AzResourceProvider registration, run the following Azure PowerShell command:
Get-AzProviderFeature -FeatureName "AFWEnableTcpConnectionLogging" -ProviderNamespace "Microsoft.Network"
Disable Flow trace logs
To disable the log, use the following Azure PowerShell commands:
Connect-AzAccount
Select-AzSubscription -Subscription <subscription_id> or <subscription_name>
$firewall = Get-AzFirewall -ResourceGroupName <ResourceGroupName> -Name <FirewallName>
$firewall.EnableTcpConnectionLogging = $false
Set-AzFirewall -AzureFirewall $firewall
To create a diagnostic setting and enable Resource Specific Table, see Create diagnostic settings in Azure Monitor.
Azure Monitor Logs tables
This section lists the Azure Monitor Logs tables relevant to this service, which are available for query by Log Analytics using Kusto queries. The tables contain resource log data and possibly more depending on what is collected and routed to them.
Azure Firewall Microsoft.Network/azureFirewalls
- AZFWNetworkRule
- AZFWFatFlow
- AZFWFlowTrace
- AZFWApplicationRule
- AZFWThreatIntel
- AZFWNatRule
- AZFWIdpsSignature
- AZFWDnsQuery
- AZFWInternalFqdnResolutionFailure
- AZFWNetworkRuleAggregation
- AZFWApplicationRuleAggregation
- AZFWNatRuleAggregation
- AzureActivity
- AzureMetrics
- AzureDiagnostics
Activity log
The linked table lists the operations that can be recorded in the activity log for this service. These operations are a subset of all the possible resource provider operations in the activity log.
For more information on the schema of activity log entries, see Activity Log schema.
Related content
- See Monitor Azure Firewall for a description of monitoring Azure Firewall.
- See Track rule set changes for detailed Azure Resource Graph queries to track firewall rule modifications.
- See Monitor Azure resources with Azure Monitor for details on monitoring Azure resources.