Note
Access to this page requires authorization. You can try signing in or changing directories.
Access to this page requires authorization. You can try changing directories.
Monitoring a managed compute deployment combines a quick operational view in the Microsoft Foundry portal with deeper analysis through Azure Monitor metrics. These metrics are separate from the cost data for the deployment. This article explains what each of these pieces shows you and the specific metrics available for managed compute. Viewing metrics requires the Monitoring Reader role or equivalent on the resource.
Portal view and metrics explorer
Foundry portal Monitor tab
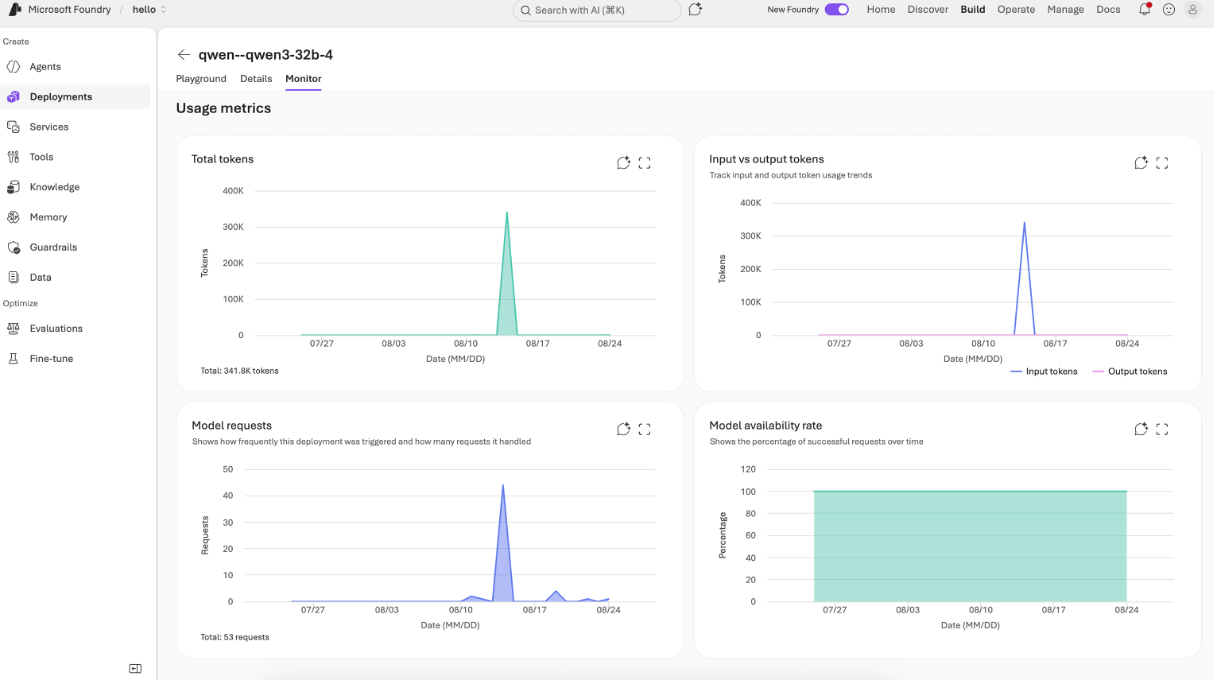
The deployment's details page in the Foundry portal gives you a quick view of request, latency, and usage activity for a managed compute deployment without leaving the portal. This view is useful for a fast operational check. The Monitor tab's usage metrics section shows total tokens, input versus output tokens, model requests, and model availability rate as charts.
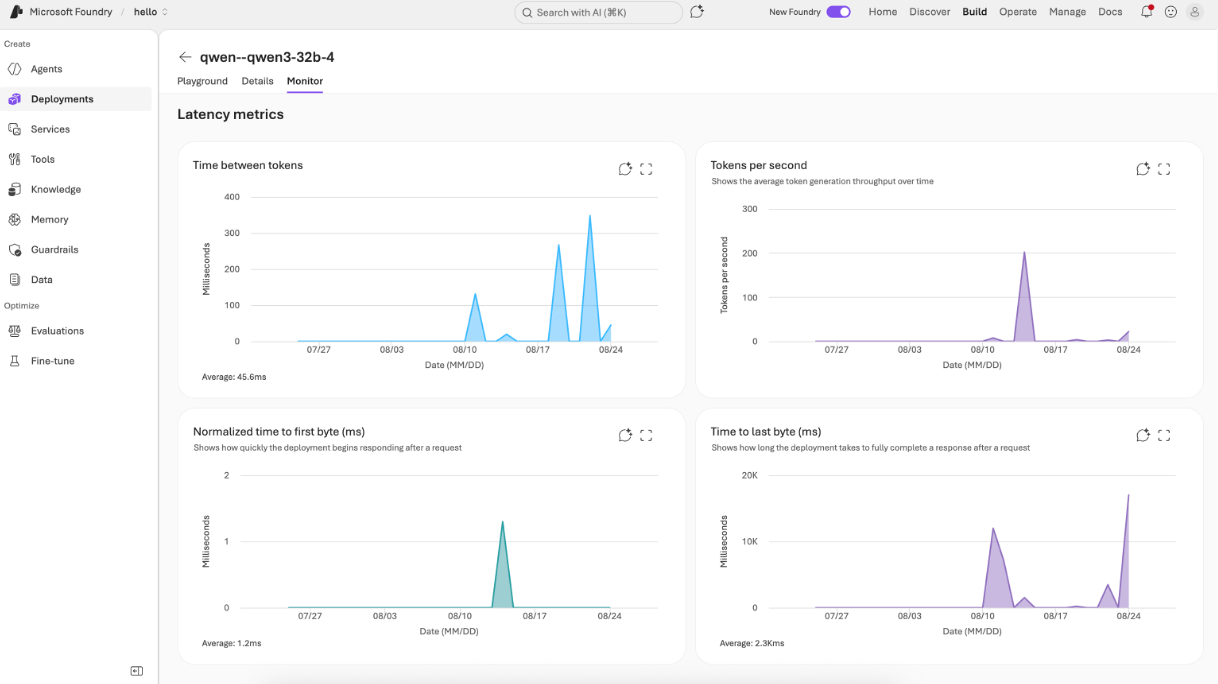
The same Monitor tab's latency metrics section shows charts for time between tokens, tokens per second, normalized time to first byte, and time to last byte.
Azure Monitor metrics explorer
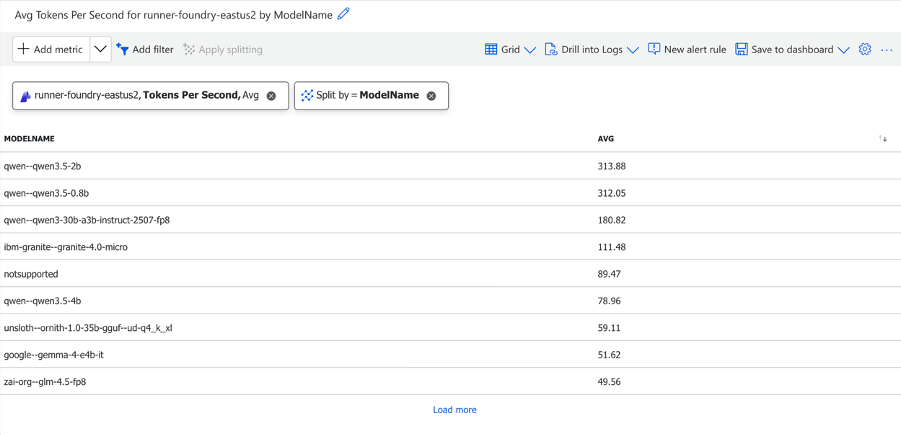
For custom charts, filtering, splitting, and aggregation across models and deployments, the Azure portal's Foundry resource, under Monitoring > Metrics, gives you the full Azure Monitor metrics explorer. Metrics at the resource level are unfiltered by default, so they can include deployments of other deployment types on the same resource. Filtering or splitting on the ModelDeploymentName dimension (and optionally ModelName) scopes the view to your managed compute deployment or deployments. Splitting by the ModelName dimension can show throughput as a per-model grid, as in the following example.
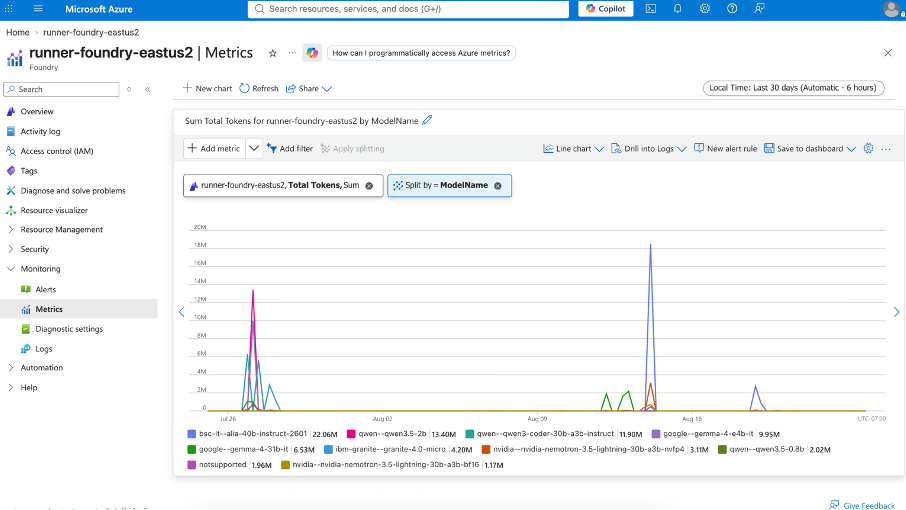
Splitting by ModelName also works for time-series charts, such as total token usage over time for each model.
Metric reference
The following metrics are available for managed compute deployments, grouped by category.
Requests
| Metric | Unit | Recommended aggregation |
|---|---|---|
| Model Requests | Count | Total |
| Model Availability Rate | Percent | Average, Minimum, Maximum |
Usage
Tokens per second measures token-generation throughput.
| Metric | Unit | Recommended aggregation |
|---|---|---|
| Input Tokens | Count | Total |
| Output Tokens | Count | Total |
| Total Tokens | Count | Total |
| Tokens Per Second | Tokens/second | Average, Minimum, Maximum |
Latency
All latency metrics are measured in milliseconds and support only average, minimum, and maximum aggregations. Azure Monitor doesn't offer a percentile (p50/p90/p99) selector for any metric in this article. Time to Response measures the time to the first response. Time to Last Byte measures the time to the last byte of the response. Time Between Tokens measures the time between successive streamed tokens. Normalized Time to First Byte is the normalized first-response latency reported by the service.
| Metric | Unit | Recommended aggregation |
|---|---|---|
| Time to Response | Milliseconds | Average, Minimum, Maximum |
| Normalized Time to First Byte | Milliseconds | Average, Minimum, Maximum |
| Time to Last Byte | Milliseconds | Average, Minimum, Maximum |
| Time Between Tokens | Milliseconds | Average, Minimum, Maximum |
Cost relationship
Cost data for a managed compute deployment lives in Azure Cost Management and Billing, separate from the operational metrics described earlier in this article. Managed compute bills by dedicated accelerator-hour, not by token, so a higher prompt-cache hit rate doesn't change per-token billing. For more information, see Plan and manage costs for Microsoft Foundry.