Use Elasticsearch with Apache Flink on HDInsight on AKS
Note
We will retire Azure HDInsight on AKS on January 31, 2025. Before January 31, 2025, you will need to migrate your workloads to Microsoft Fabric or an equivalent Azure product to avoid abrupt termination of your workloads. The remaining clusters on your subscription will be stopped and removed from the host.
Important
This feature is currently in preview. The Supplemental Terms of Use for Microsoft Azure Previews include more legal terms that apply to Azure features that are in beta, in preview, or otherwise not yet released into general availability. For information about this specific preview, see Azure HDInsight on AKS preview information. For questions or feature suggestions, please submit a request on AskHDInsight with the details and follow us for more updates on Azure HDInsight Community.
Apache Flink for real-time analytics can be used to build a dashboard application that visualizes the streaming data by using Elasticsearch and Kibana.
As an example, you can use Flink to analyze a stream of taxi ride events and compute metrics. Metrics can include number of rides per hour, the average fare per ride, or the most popular pickup locations. You can write these metrics to an Elasticsearch index by using a Flink sink. Then you can use Kibana to connect and create charts or dashboards to display metrics in real time.
In this article, you learn how to use Elastic along with Apache Flink on HDInsight on Azure Kubernetes Service (AKS).
Elasticsearch and Kibana
Elasticsearch is a distributed, free, and open-source search and analytics engine for all types of data, including:
- Textual
- Numerical
- Geospatial
- Structured
- Unstructured
Kibana is a free and open-source front-end application that sits on top of the Elastic Stack. Kibana provides search and data visualization capabilities for data indexed in Elasticsearch.
For more information, see:
Prerequisites
- Create a Flink 1.17.0 cluster.
- Use Elasticsearch-7.13.2.
- Use Kibana-7.13.2.
- Use HDInsight 5.0 - Kafka 3.2.0.
- Use IntelliJ IDEA for development on an Azure virtual machine (VM), which is in the same virtual network.
Install Elasticsearch on Ubuntu 20.04
Use APT to update and install OpenJDK.
Add an Elasticsearch GPG key and repository.
Add the GPG key.
sudo apt-get install apt-transport-https
wget -qO - https://artifacts.elastic.co/GPG-KEY-elasticsearch | sudo gpg --dearmor -o /usr/share/keyrings/elasticsearch-keyring.gpg
Add the repository.
echo "deb [signed-by=/usr/share/keyrings/elasticsearch-keyring.gpg] https://artifacts.elastic.co/packages/7.x/apt stable main" | sudo tee -a /etc/apt/sources.list.d/elastic-7.x.list
Run a system update.
sudo apt updateInstall Elasticsearch on Ubuntu 20.04 Linux.
sudo apt install elasticsearchStart Elasticsearch services.
Reload the daemon:
sudo systemctl daemon-reloadEnable:
sudo systemctl enable elasticsearchStart:
sudo systemctl start elasticsearchCheck the status:
sudo systemctl status elasticsearchStop:
sudo systemctl stop elasticsearch
Install Kibana on Ubuntu 20.04
To install and configure the Kibana dashboard, you don't need to add any other repository. The packages are available through Elasticsearch, which you already added.
Install Kibana.
sudo apt install kibanaReload the daemon.
sudo systemctl daemon-reloadStart and enable.
sudo systemctl enable kibana
sudo systemctl start kibana
Check the status.
sudo systemctl status kibana
Access the Kibana dashboard web interface
To make Kibana accessible from output, you need to set network.host to 0.0.0.0.
Configure /etc/kibana/kibana.yml on an Ubuntu VM.
Note
We've used 10.0.1.4, which is a local, private IP that can be accessed in a Maven project to develop a Windows VM. You're required to make modifications according to your network security requirements. You use the same IP later as a demo for performing analytics on Kibana.
server.host: "0.0.0.0"
server.name: "elasticsearch"
server.port: 5601
elasticsearch.hosts: ["http://10.0.1.4:9200"]

Prepare click events on HDInsight Kafka
You use Python output as input to produce the streaming data.
sshuser@hn0-contsk:~$ python weblog.py | /usr/hdp/current/kafka-broker/bin/kafka-console-producer.sh --bootstrap-server wn0-contsk:9092 --topic click_events
Check the messages in this topic.
sshuser@hn0-contsk:~$ /usr/hdp/current/kafka-broker/bin/kafka-console-consumer.sh --bootstrap-server wn0-contsk:9092 --topic click_events
{"userName": "Tim", "visitURL": "https://www.bing.com/new", "ts": "07/31/2023 05:47:12"}
{"userName": "Luke", "visitURL": "https://github.com", "ts": "07/31/2023 05:47:12"}
{"userName": "Zark", "visitURL": "https://github.com", "ts": "07/31/2023 05:47:12"}
{"userName": "Zark", "visitURL": "https://docs.python.org", "ts": "07/31/2023 05:47:12"}
Create a Kafka sink to Elastic
Now you need to write Maven source code on the Windows VM.
Main: kafkaSinkToElastic.java
import org.apache.flink.api.common.eventtime.WatermarkStrategy;
import org.apache.flink.api.common.serialization.SimpleStringSchema;
import org.apache.flink.streaming.api.datastream.DataStream;
import org.apache.flink.streaming.api.environment.StreamExecutionEnvironment;
import org.apache.flink.connector.elasticsearch.sink.Elasticsearch7SinkBuilder;
import org.apache.flink.connector.kafka.source.KafkaSource;
import org.apache.flink.connector.kafka.source.enumerator.initializer.OffsetsInitializer;
import org.apache.http.HttpHost;
import org.elasticsearch.action.index.IndexRequest;
import org.elasticsearch.client.Requests;

import java.util.HashMap;
import java.util.Map;

public class kafkaSinkToElastic {
    public static void main(String[] args) throws Exception {
        StreamExecutionEnvironment env = StreamExecutionEnvironment.getExecutionEnvironment().setParallelism(1);

        // 1. read kafka message
        String kafka_brokers = "<broker1 IP>:9092,<broker2 IP>:9092,<broker3 IP>:9092";
        KafkaSource<String> source = KafkaSource.<String>builder()
                .setBootstrapServers(kafka_brokers)
                .setTopics("click_events")
                .setGroupId("my-group")
                .setStartingOffsets(OffsetsInitializer.earliest())
                .setValueOnlyDeserializer(new SimpleStringSchema())
                .build();

        DataStream<String> kafka = env.fromSource(source, WatermarkStrategy.noWatermarks(), "Kafka Source");

        // 2. sink to elasticsearch
        kafka.sinkTo(
                new Elasticsearch7SinkBuilder<String>()
                        .setBulkFlushMaxActions(1)
                        .setHosts(new HttpHost("10.0.1.4", 9200, "http"))
                        .setEmitter(
                                (element, context, indexer) -> indexer.add(createIndexRequest(element)))
                        .build());

        // 3. execute stream
        env.execute("Kafka Sink To Elastic");

    }
    private static IndexRequest createIndexRequest(String element) {
        String[] logContent =element.replace("{","").replace("}","").split(",");
        Map<String, String> esJson = new HashMap<>();
        esJson.put("username", logContent[0]);
        esJson.put("visitURL", logContent[1]);
        esJson.put("ts", logContent[2]);
        return Requests.indexRequest()
                .index("kafka_user_clicks")
                .id(element)
                .source(esJson);
    }
}
Create a pom.xml on Maven
<?xml version="1.0" encoding="UTF-8"?>
<project xmlns="http://maven.apache.org/POM/4.0.0"
         xmlns:xsi="http://www.w3.org/2001/XMLSchema-instance"
         xsi:schemaLocation="http://maven.apache.org/POM/4.0.0 http://maven.apache.org/xsd/maven-4.0.0.xsd">
    <modelVersion>4.0.0</modelVersion>
    <groupId>contoso.example</groupId>
    <artifactId>FlinkElasticSearch</artifactId>
    <version>1.0-SNAPSHOT</version>
    <properties>
        <maven.compiler.source>1.8</maven.compiler.source>
        <maven.compiler.target>1.8</maven.compiler.target>
        <flink.version>1.17.0</flink.version>
        <java.version>1.8</java.version>
        <kafka.version>3.2.0</kafka.version>
    </properties>
    <dependencies>
        <!-- https://mvnrepository.com/artifact/org.apache.flink/flink-streaming-java -->
        <dependency>
            <groupId>org.apache.flink</groupId>
            <artifactId>flink-streaming-java</artifactId>
            <version>${flink.version}</version>
        </dependency>
        <!-- https://mvnrepository.com/artifact/org.apache.flink/flink-core -->
        <dependency>
            <groupId>org.apache.flink</groupId>
            <artifactId>flink-core</artifactId>
            <version>${flink.version}</version>
        </dependency>
        <!-- https://mvnrepository.com/artifact/org.apache.flink/flink-clients -->
        <dependency>
            <groupId>org.apache.flink</groupId>
            <artifactId>flink-clients</artifactId>
            <version>${flink.version}</version>
        </dependency>
        <!-- https://mvnrepository.com/artifact/org.apache.flink/flink-connector-kafka -->
        <dependency>
            <groupId>org.apache.flink</groupId>
            <artifactId>flink-connector-kafka</artifactId>
            <version>${flink.version}</version>
        </dependency>
        <!-- https://mvnrepository.com/artifact/org.apache.flink/flink-connector-elasticsearch-base -->
        <dependency>
            <groupId>org.apache.flink</groupId>
            <artifactId>flink-connector-elasticsearch7</artifactId>
            <version>3.0.1-1.17</version>
        </dependency>
    </dependencies>
    <build>
        <plugins>
            <plugin>
                <groupId>org.apache.maven.plugins</groupId>
                <artifactId>maven-assembly-plugin</artifactId>
                <version>3.0.0</version>
                <configuration>
                    <appendAssemblyId>false</appendAssemblyId>
                    <descriptorRefs>
                        <descriptorRef>jar-with-dependencies</descriptorRef>
                    </descriptorRefs>
                </configuration>
                <executions>
                    <execution>
                        <id>make-assembly</id>
                        <phase>package</phase>
                        <goals>
                            <goal>single</goal>
                        </goals>
                    </execution>
                </executions>
            </plugin>
        </plugins>
    </build>
</project>
Package the jar and submit to Flink to run on WebSSH
On Secure Shell for Flink, you can use the following commands:
user@sshnode-0 [ ~ ]$ bin/flink run -c contoso.example.kafkaSinkToElastic -j FlinkElasticSearch-1.0-SNAPSHOT.jar
Job has been submitted with JobID e043a0723960fd23f9420f73d3c4f14f
Start Elasticsearch and Kibana to perform analytics on Kibana
Start up Elasticsearch and Kibana on the Ubuntu VM and use Kibana to visualize the results.
Access Kibana at the IP, which you set earlier.
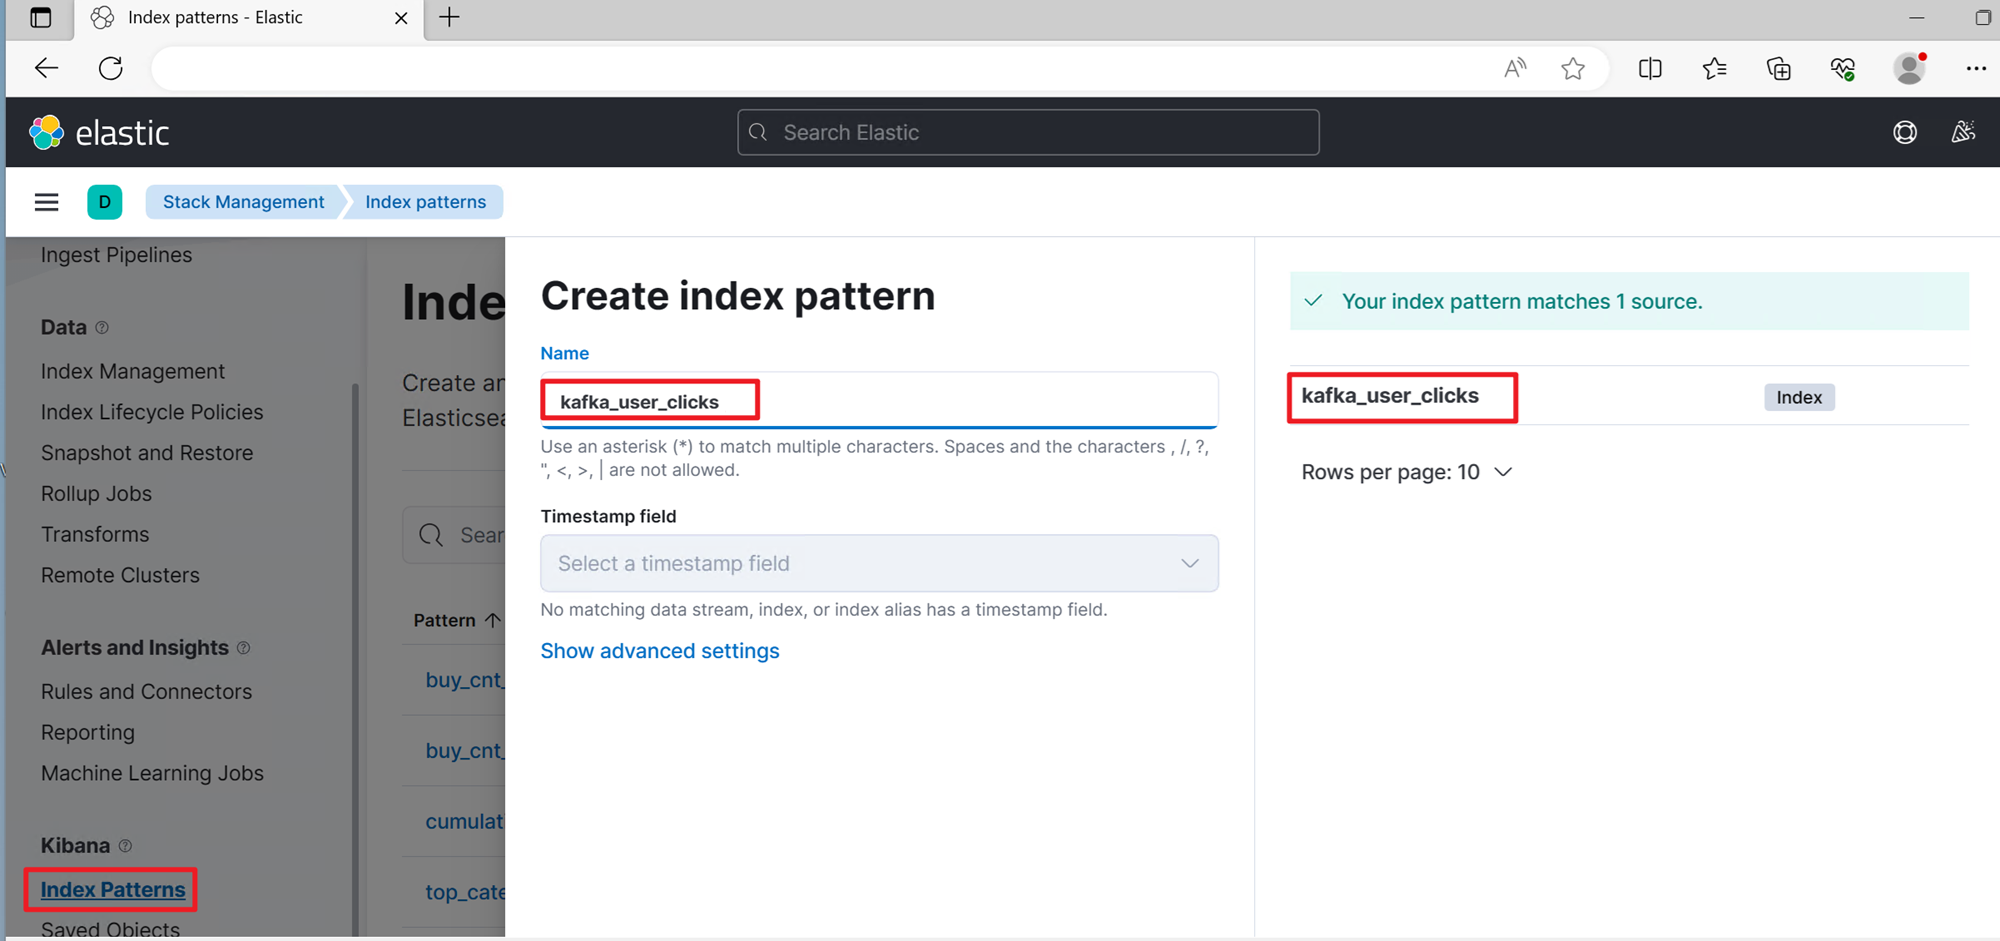
Configure an index pattern by selecting Stack Management in the leftmost pane and finding Index Patterns. Then select Create Index Pattern. Enter the full index name kafka_user_clicks to create the index pattern.
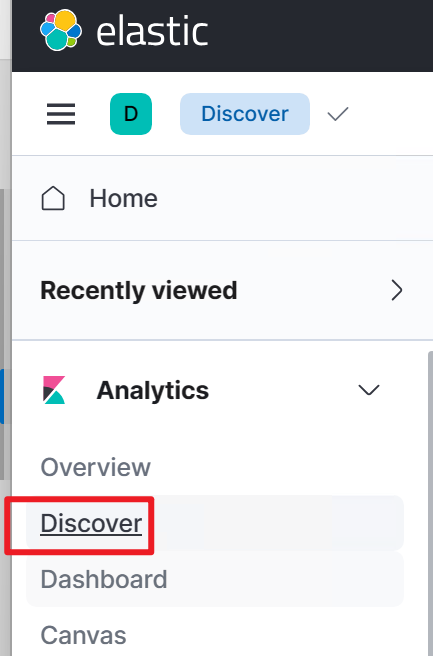
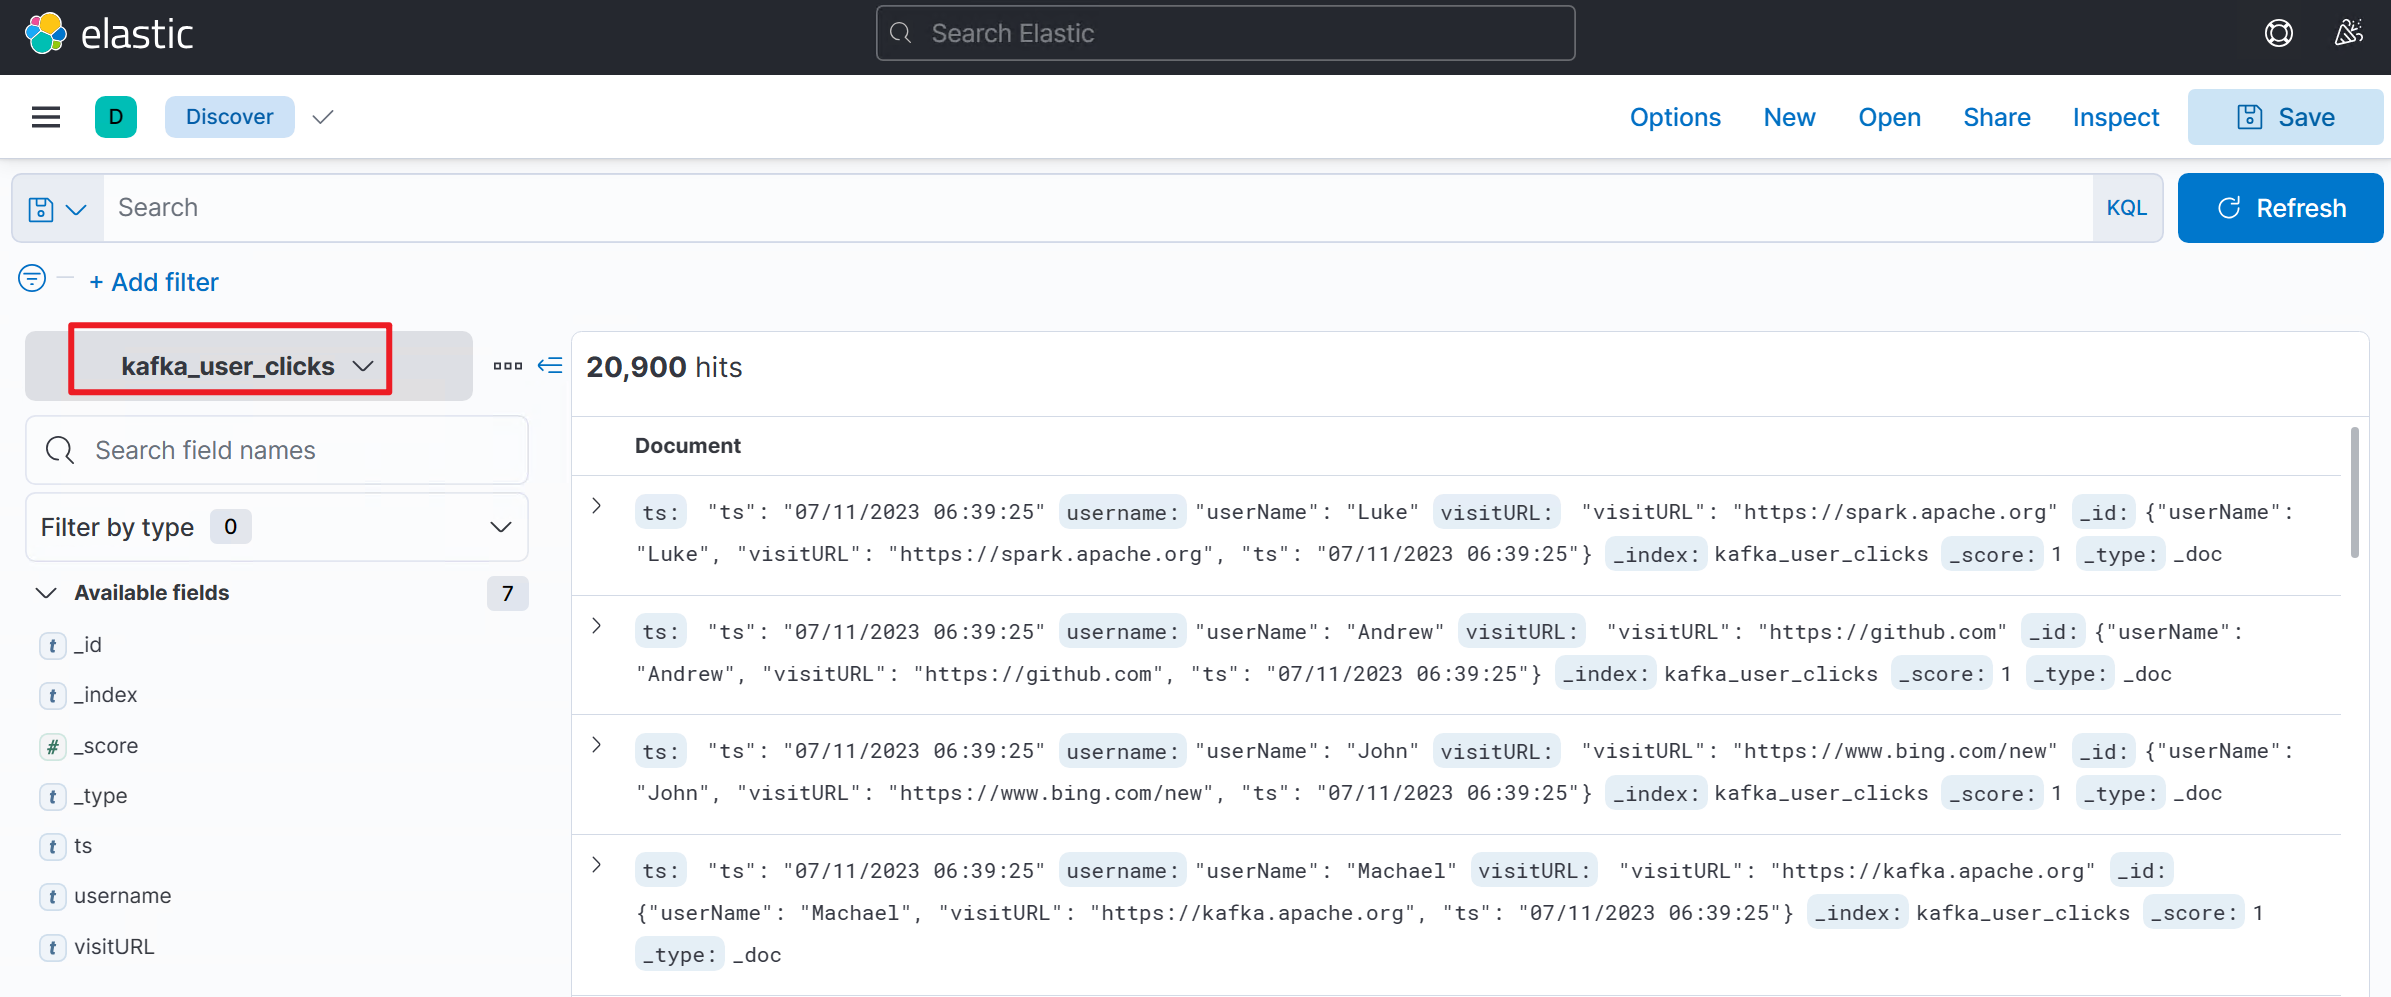
After the index pattern is set up, you can explore the data in Kibana.
Select Discover in the leftmost pane.
Kibana lists the content of the created index with kafka-click-events.
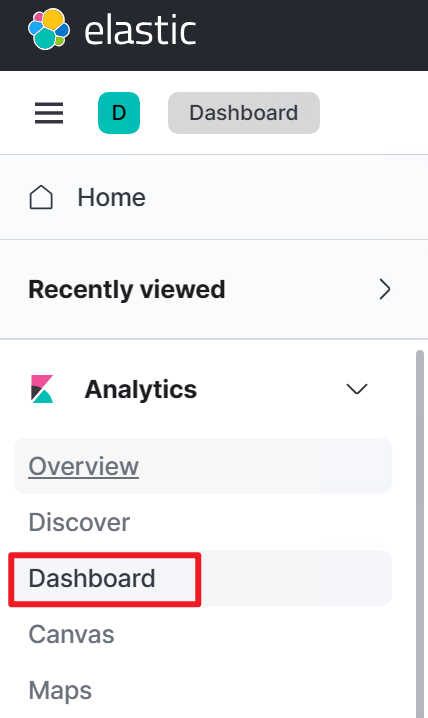
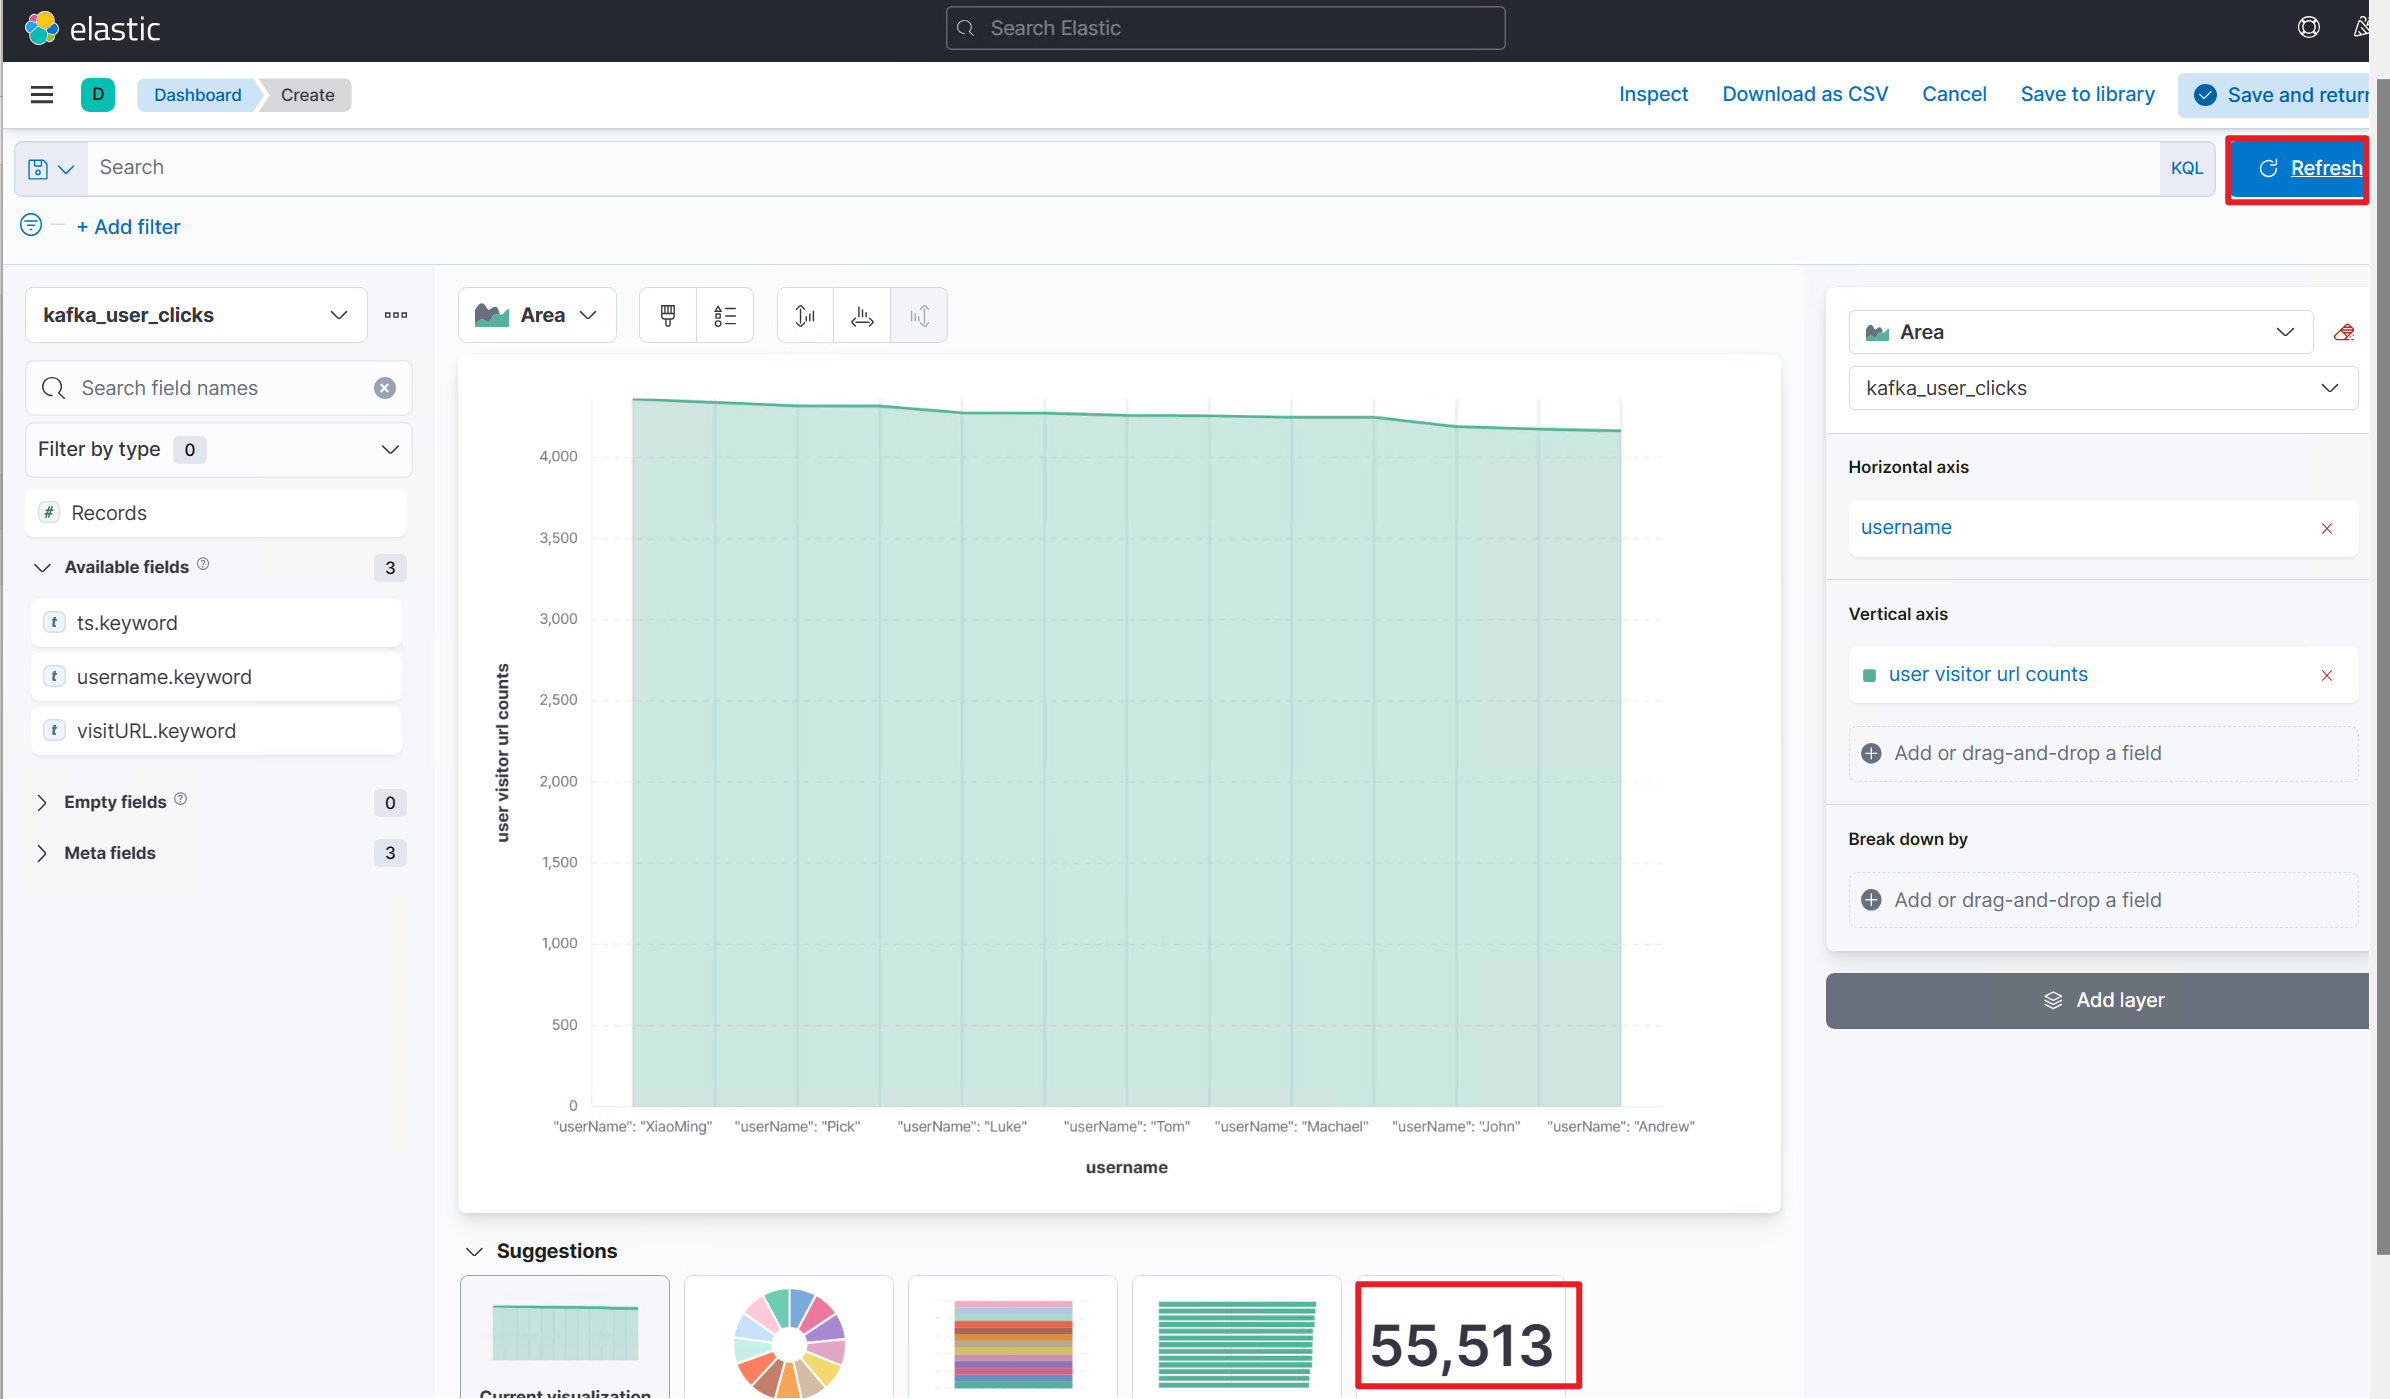
Create a dashboard to display various views.
Select Area to use the area graph. Then select the kafka_click_events index and edit the horizontal axis and vertical axis to illustrate the events.
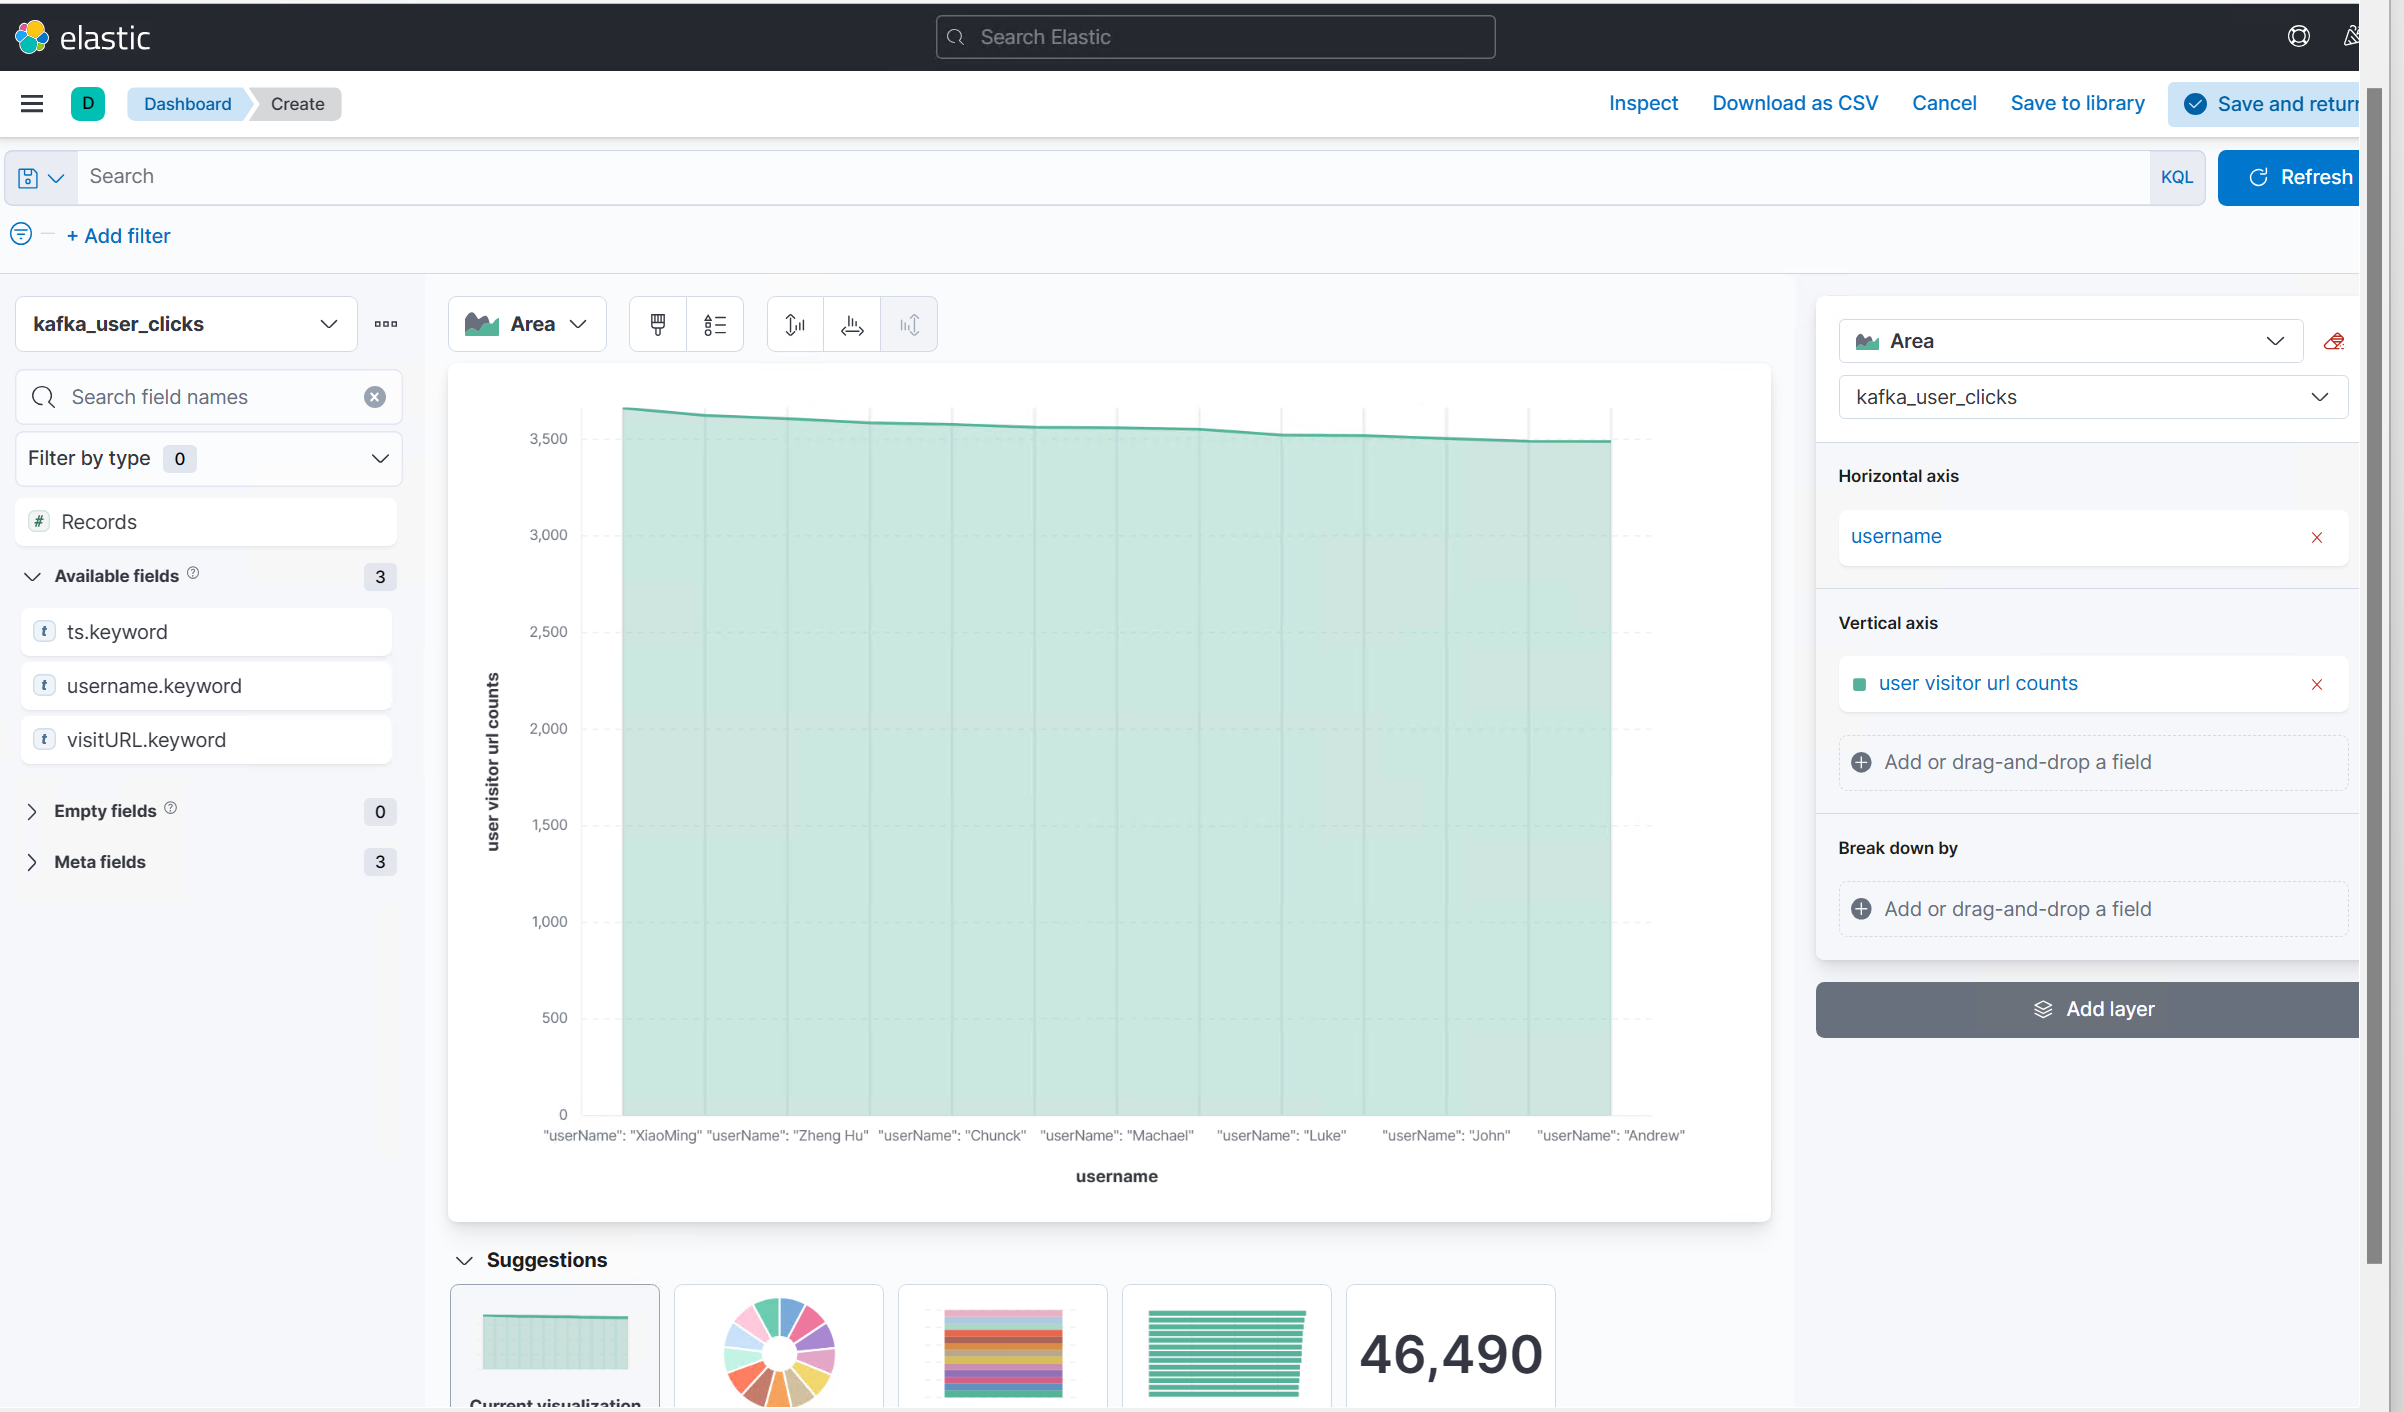
If you set autorefresh or select Refresh, the plot updates in real time as if you created a Flink streaming job.


Validation on the Apache Flink Job UI
You can find the job in a running state on your Flink web UI.

References
- Apache Kafka SQL Connector
- Elasticsearch SQL Connector
- Apache, Apache Flink, Flink, and associated open-source project names are trademarks of the Apache Software Foundation.