Submit and manage jobs on an Apache Spark™ cluster in HDInsight on AKS
Important
This feature is currently in preview. The Supplemental Terms of Use for Microsoft Azure Previews include more legal terms that apply to Azure features that are in beta, in preview, or otherwise not yet released into general availability. For information about this specific preview, see Azure HDInsight on AKS preview information. For questions or feature suggestions, please submit a request on AskHDInsight with the details and follow us for more updates on Azure HDInsight Community.
Once the cluster is created, user can use various interfaces to submit and manage jobs by
- using Jupyter
- using Zeppelin
- using ssh (spark-submit)
Using Jupyter
Prerequisites
An Apache Spark™ cluster on HDInsight on AKS. For more information, see Create an Apache Spark cluster.
Jupyter Notebook is an interactive notebook environment that supports various programming languages.
Create a Jupyter Notebook
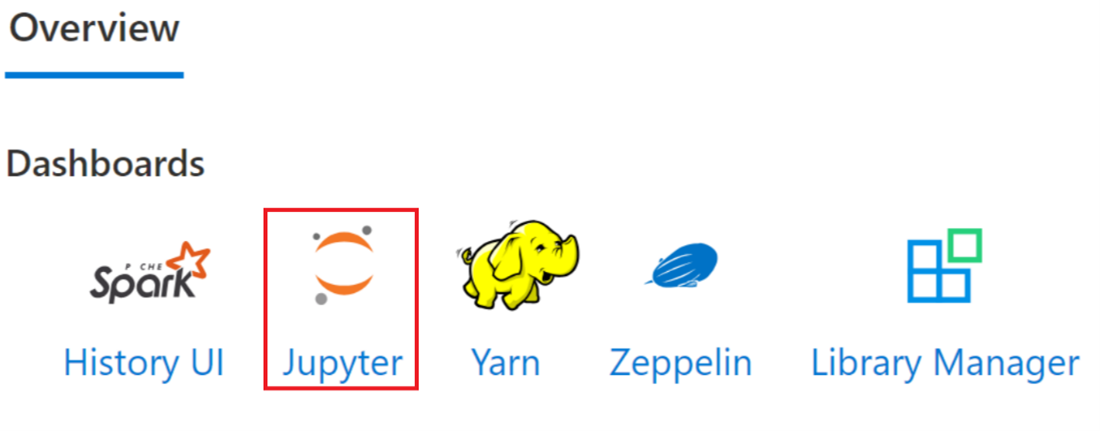
Navigate to the Apache Spark™ cluster page and open the Overview tab. Click on Jupyter, it asks you to authenticate and open the Jupyter web page.
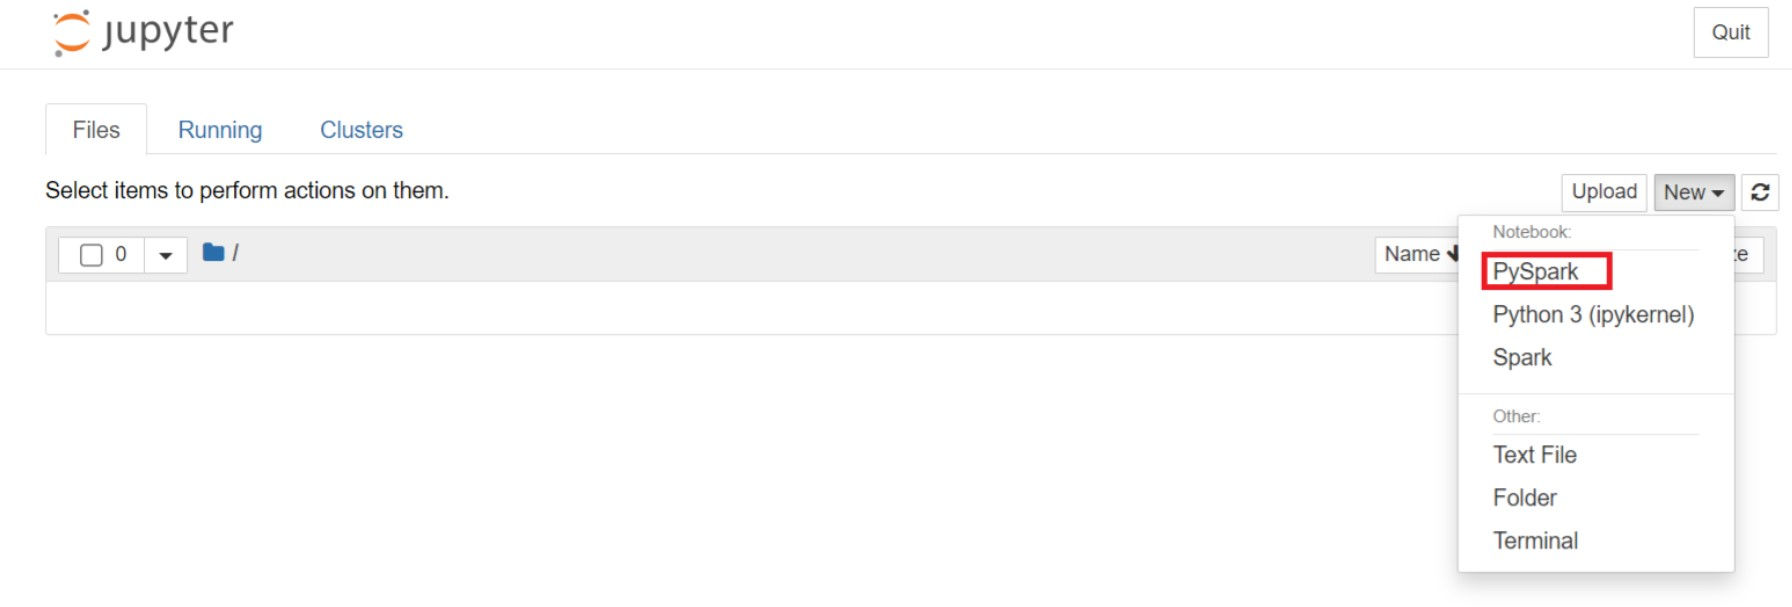
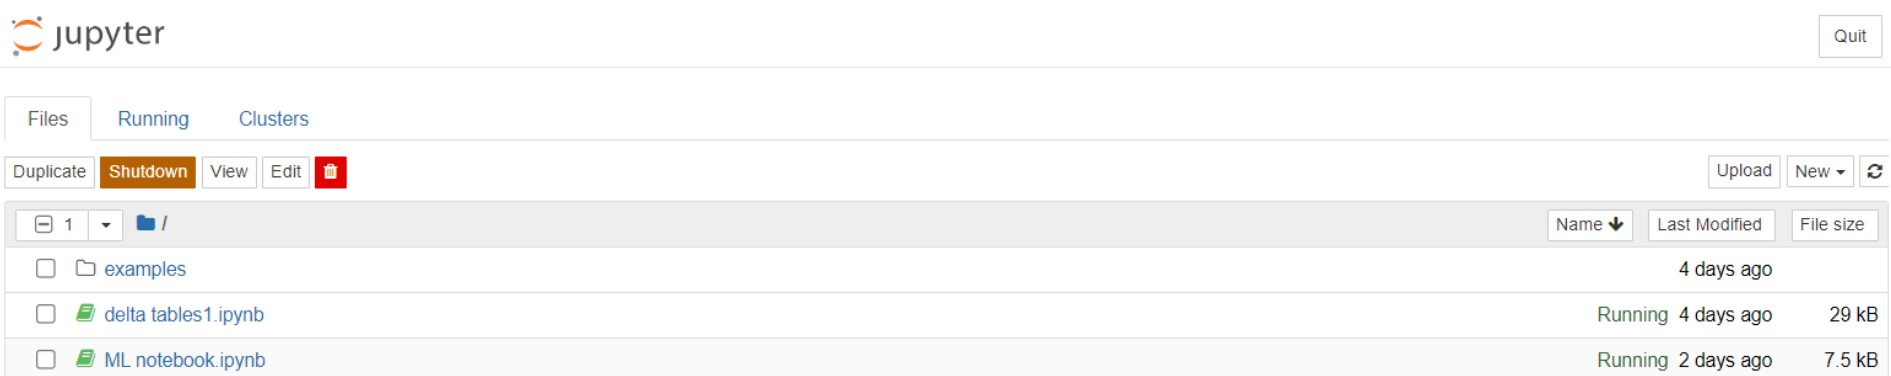
From the Jupyter web page, Select New > PySpark to create a notebook.
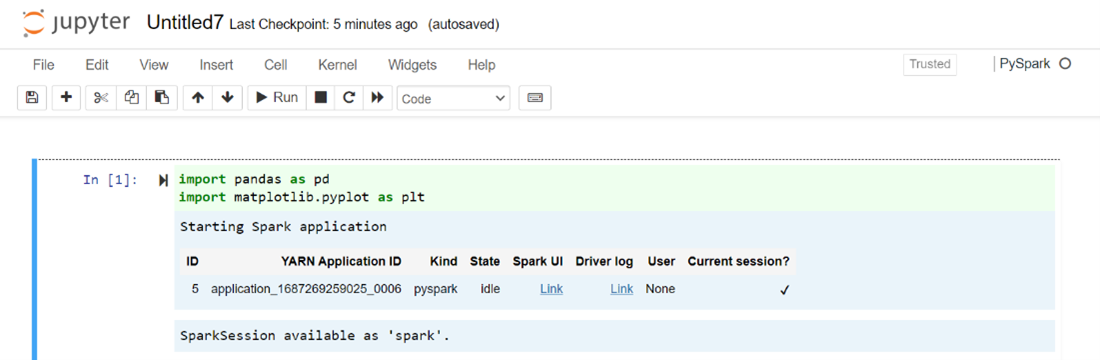
A new notebook created and opened with the name
Untitled(Untitled.ipynb).Note
By using the PySpark or the Python 3 kernel to create a notebook, the spark session is automatically created for you when you run the first code cell. You do not need to explicitly create the session.
Paste the following code in an empty cell of the Jupyter Notebook, and then press SHIFT + ENTER to run the code. See here for more controls on Jupyter.
%matplotlib inline
import pandas as pd
import matplotlib.pyplot as plt
data1 = [22,40,10,50,70]
s1 = pd.Series(data1)   #One-dimensional ndarray with axis labels (including time series).

data2 = data1
index = ['John','sam','anna','smith','ben']
s2 = pd.Series(data2,index=index)

data3 = {'John':22, 'sam':40, 'anna':10,'smith':50,'ben':70}
s3 = pd.Series(data3)

s3['jp'] = 32     #insert a new row
s3['John'] = 88

names = ['John','sam','anna','smith','ben']
ages = [10,40,50,48,70]
name_series = pd.Series(names)
age_series = pd.Series(ages)

data_dict = {'name':name_series, 'age':age_series}
dframe = pd.DataFrame(data_dict)
#create a pandas DataFrame from dictionary

dframe['age_plus_five'] = dframe['age'] + 5
#create a new column
dframe.pop('age_plus_five')
#dframe.pop('age')

salary = [1000,6000,4000,8000,10000]
salary_series = pd.Series(salary)
new_data_dict = {'name':name_series, 'age':age_series,'salary':salary_series}
new_dframe = pd.DataFrame(new_data_dict)
new_dframe['average_salary'] = new_dframe['age']*90

new_dframe.index = new_dframe['name']
print(new_dframe.loc['sam'])
Plot a graph with Salary and age as the X and Y axes
In the same notebook, paste the following code in an empty cell of the Jupyter Notebook, and then press SHIFT + ENTER to run the code.
%matplotlib inline
import pandas as pd
import matplotlib.pyplot as plt

plt.plot(age_series,salary_series)
plt.show()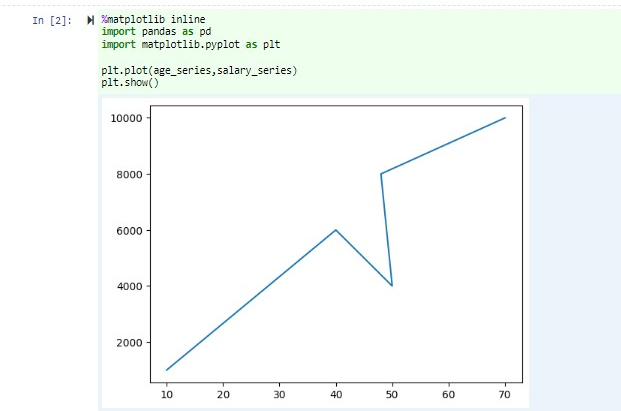


Save the Notebook
From the notebook menu bar, navigate to File > Save and Checkpoint.
Shut down the notebook to release the cluster resources: from the notebook menu bar, navigate to File > Close and Halt. You can also run any of the notebooks under the examples folder.

Using Apache Zeppelin notebooks
Apache Spark clusters in HDInsight on AKS include Apache Zeppelin notebooks. Use the notebooks to run Apache Spark jobs. In this article, you learn how to use the Zeppelin notebook on an HDInsight on AKS cluster.
Prerequisites
An Apache Spark cluster on HDInsight on AKS. For instructions, see Create an Apache Spark cluster.
Launch an Apache Zeppelin notebook
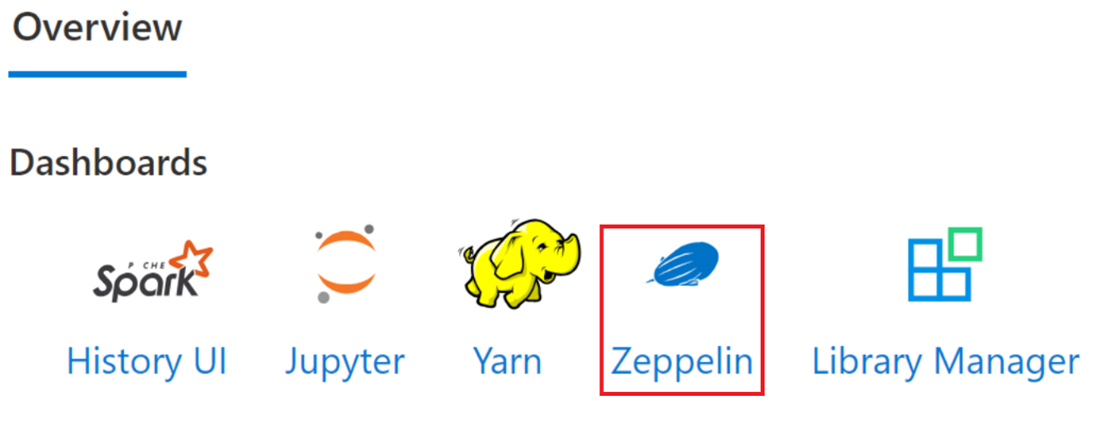
Navigate to the Apache Spark cluster Overview page and select Zeppelin notebook from Cluster dashboards. It prompts to authenticate and open the Zeppelin page.
Create a new notebook. From the header pane, navigate to Notebook > Create new note. Ensure the notebook header shows a connected status. It denotes a green dot in the top-right corner.

Run the following code in Zeppelin Notebook:
%livy.pyspark
import pandas as pd
import matplotlib.pyplot as plt
data1 = [22,40,10,50,70]
s1 = pd.Series(data1)   #One-dimensional ndarray with axis labels (including time series).

data2 = data1
index = ['John','sam','anna','smith','ben']
s2 = pd.Series(data2,index=index)

data3 = {'John':22, 'sam':40, 'anna':10,'smith':50,'ben':70}
s3 = pd.Series(data3)

s3['jp'] = 32     #insert a new row

s3['John'] = 88

names = ['John','sam','anna','smith','ben']
ages = [10,40,50,48,70]
name_series = pd.Series(names)
age_series = pd.Series(ages)

data_dict = {'name':name_series, 'age':age_series}
dframe = pd.DataFrame(data_dict)   #create a pandas DataFrame from dictionary

dframe['age_plus_five'] = dframe['age'] + 5   #create a new column
dframe.pop('age_plus_five')
#dframe.pop('age')

salary = [1000,6000,4000,8000,10000]
salary_series = pd.Series(salary)
new_data_dict = {'name':name_series, 'age':age_series,'salary':salary_series}
new_dframe = pd.DataFrame(new_data_dict)
new_dframe['average_salary'] = new_dframe['age']*90

new_dframe.index = new_dframe['name']
print(new_dframe.loc['sam'])
Select the Play button for the paragraph to run the snippet. The status on the right-corner of the paragraph should progress from READY, PENDING, RUNNING to FINISHED. The output shows up at the bottom of the same paragraph. The screenshot looks like the following image:

Output:


Using Spark submit jobs
Create a file using the following command `#vim samplefile.py'
This command opens the vim file
Paste the following code into the vim file
import pandas as pd
import matplotlib.pyplot as plt

From pyspark.sql import SparkSession
Spark = SparkSession.builder.master('yarn').appName('SparkSampleCode').getOrCreate()
# Initialize spark context
data1 = [22,40,10,50,70]
s1 = pd.Series(data1)   #One-dimensional ndarray with axis labels (including time series).

data2 = data1
index = ['John','sam','anna','smith','ben']
s2 = pd.Series(data2,index=index)

data3 = {'John':22, 'sam':40, 'anna':10,'smith':50,'ben':70}
 s3 = pd.Series(data3)

s3['jp'] = 32     #insert a new row

s3['John'] = 88

names = ['John','sam','anna','smith','ben']
ages = [10,40,50,48,70]
name_series = pd.Series(names)
age_series = pd.Series(ages)

data_dict = {'name':name_series, 'age':age_series}
dframe = pd.DataFrame(data_dict)   #create a pandas DataFrame from dictionary

dframe['age_plus_five'] = dframe['age'] + 5   #create a new column
dframe.pop('age_plus_five')
#dframe.pop('age')

salary = [1000,6000,4000,8000,10000]
salary_series = pd.Series(salary)
new_data_dict = {'name':name_series, 'age':age_series,'salary':salary_series}
new_dframe = pd.DataFrame(new_data_dict)
new_dframe['average_salary'] = new_dframe['age']*90

new_dframe.index = new_dframe['name']
print(new_dframe.loc['sam'])
Save the file with the following method.
- Press Escape button
- Enter the command
:wq
Run the following command to run the job.
/spark-submit --master yarn --deploy-mode cluster <filepath>/samplefile.py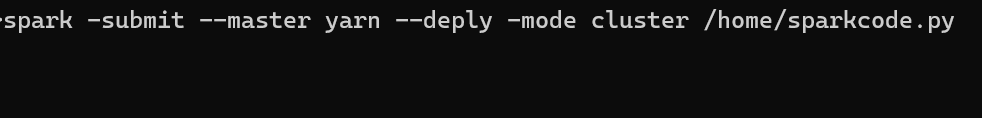

Monitor queries on an Apache Spark cluster in HDInsight on AKS
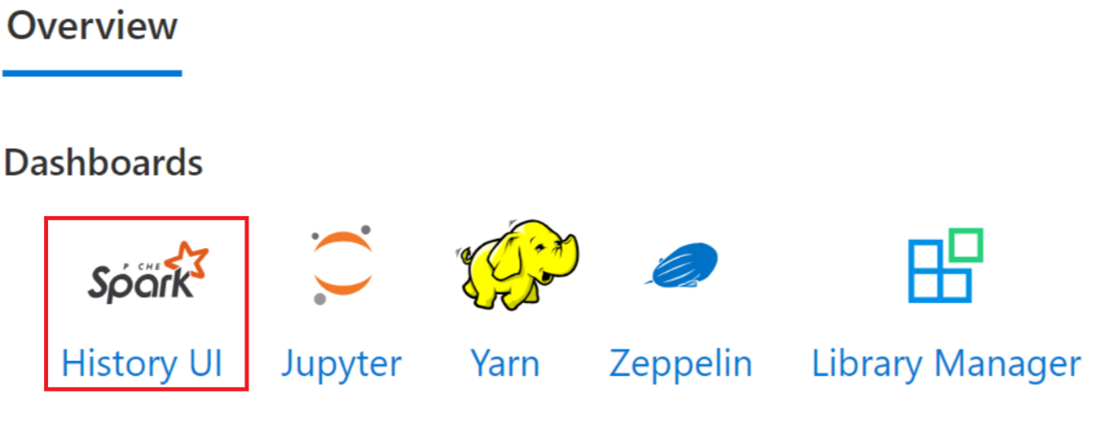
Spark History UI
Click on the Spark History Server UI from the overview Tab.
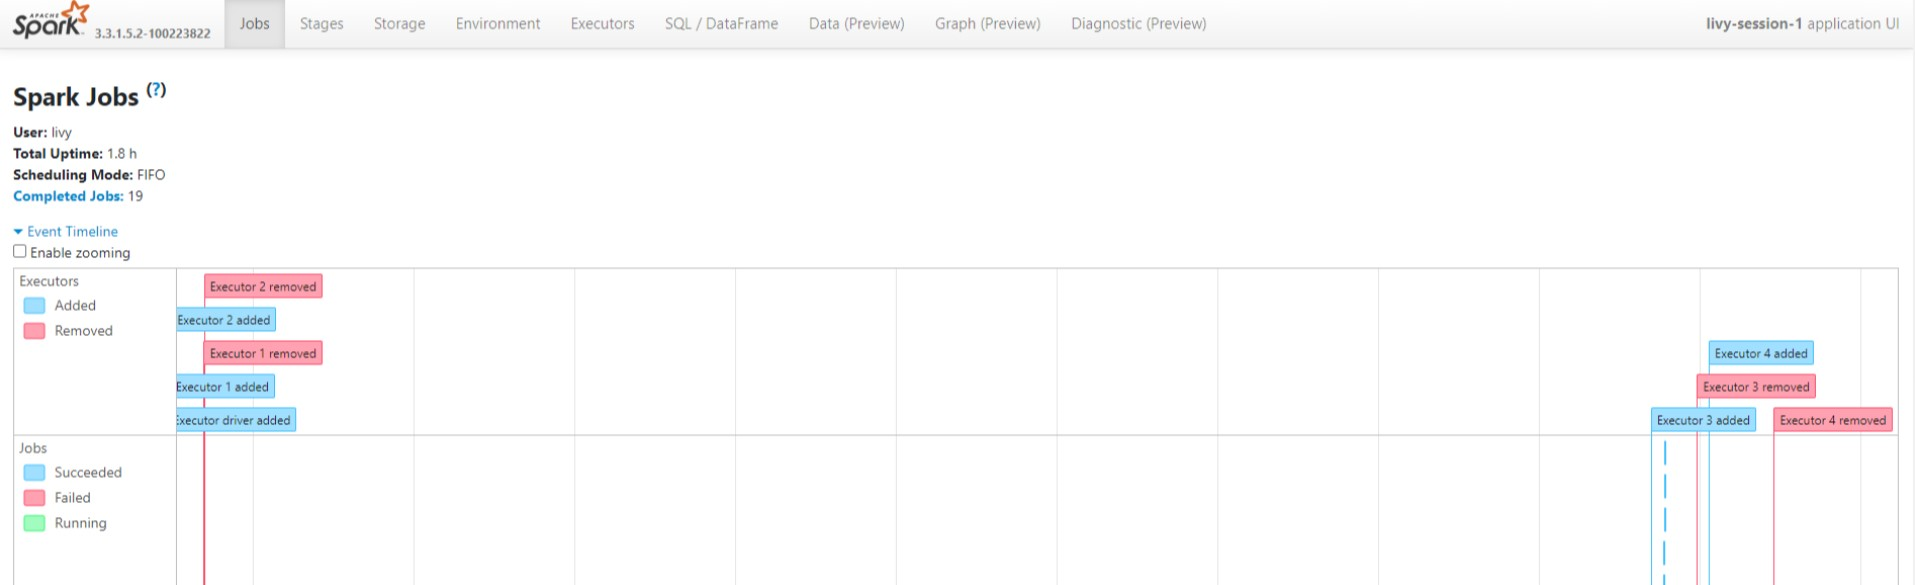
Select the recent run from the UI using the same application ID.
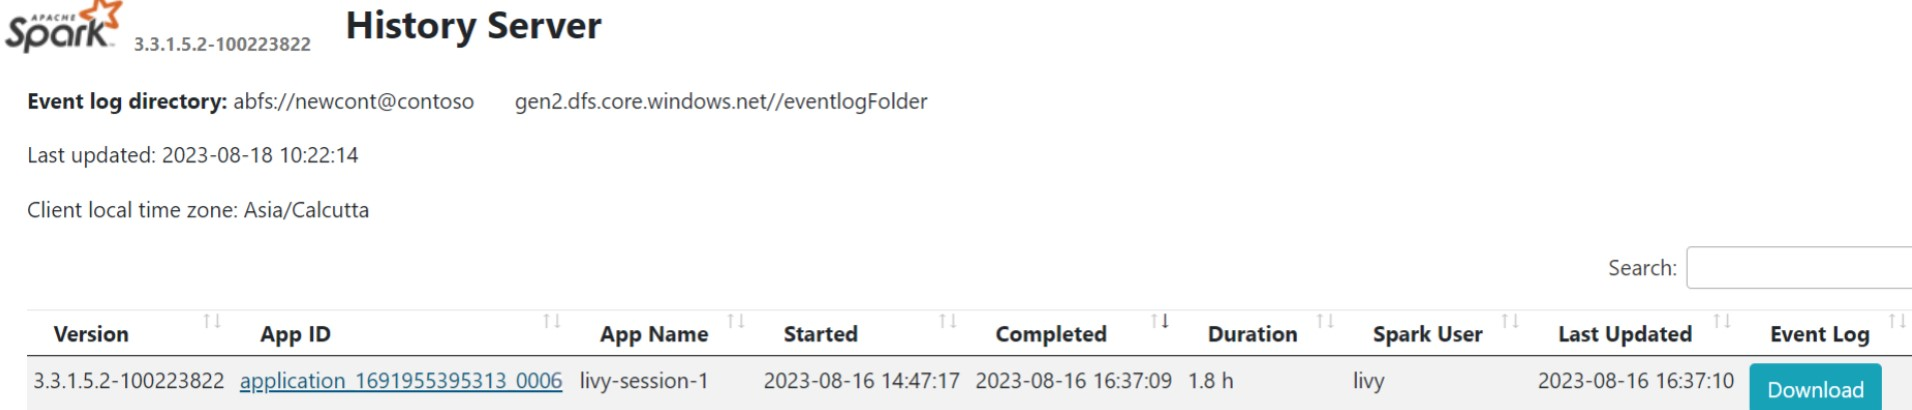
View the Directed Acyclic Graph cycles and the stages of the job in the Spark History server UI.


Livy session UI
To open the Livy session UI, type the following command into your browser
https://<CLUSTERNAME>.<CLUSTERPOOLNAME>.<REGION>.projecthilo.net/p/livy/ui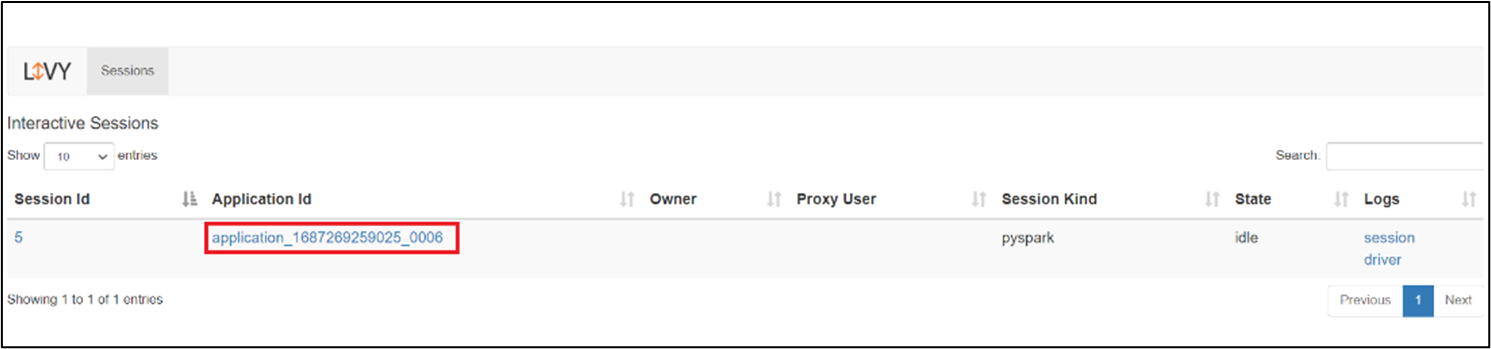
View the driver logs by clicking on the driver option under logs.

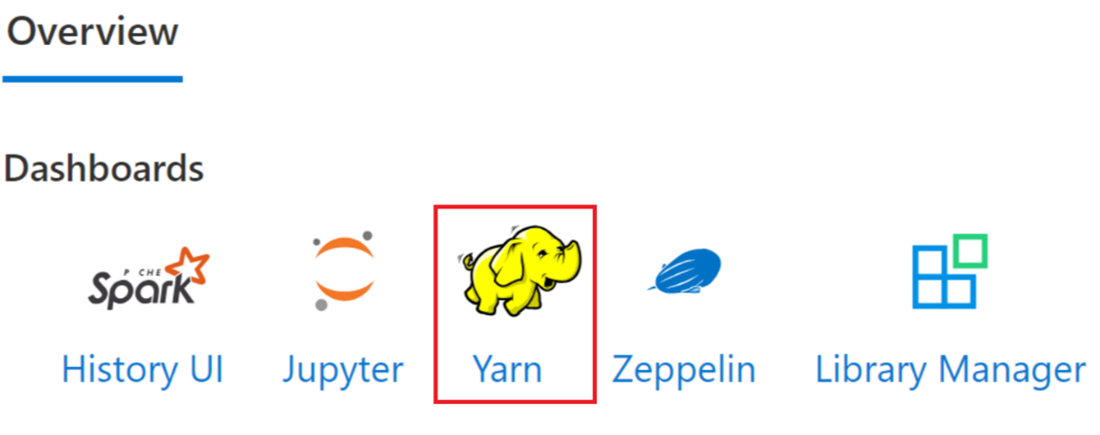
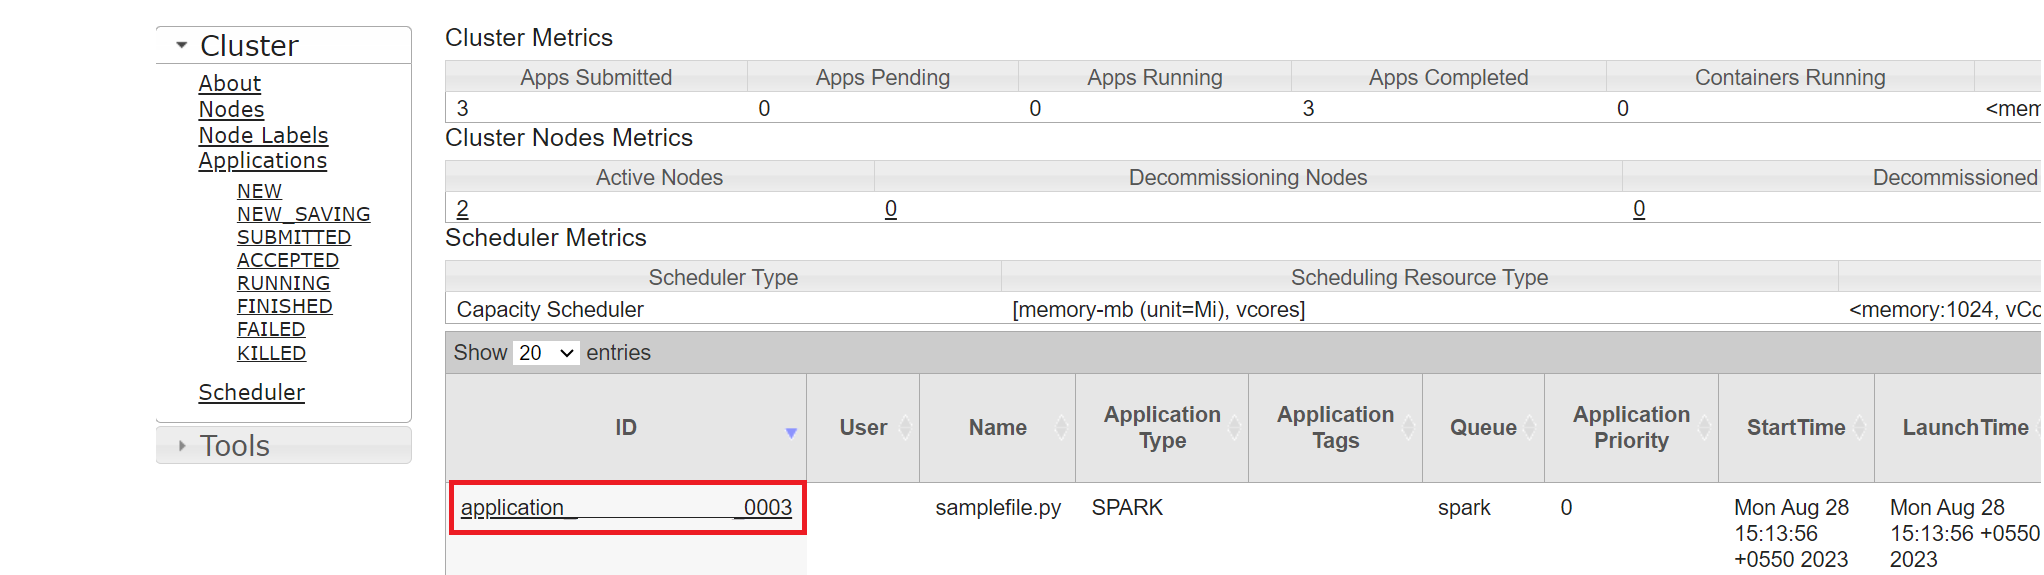
Yarn UI
From the Overview Tab click on Yarn and, open the Yarn UI.
You can track the job you recently ran by the same application ID.
Click on the Application ID in Yarn to view detailed logs of the job.


Reference
- Apache, Apache Spark, Spark, and associated open source project names are trademarks of the Apache Software Foundation (ASF).
Feedback
Coming soon: Throughout 2024 we will be phasing out GitHub Issues as the feedback mechanism for content and replacing it with a new feedback system. For more information see: https://aka.ms/ContentUserFeedback.
Submit and view feedback for