Training
Module
Run Petabyte level OSS NoSQL databases with HDInsight HBase - Training
Run Petabyte level OSS NoSQL databases with HDInsight HBase
This browser is no longer supported.
Upgrade to Microsoft Edge to take advantage of the latest features, security updates, and technical support.
This article describes troubleshooting steps and possible resolutions for issues when interacting with Azure HDInsight clusters.
The Ambari Metrics Collector is a daemon that runs on a specific host in the cluster and receives data from the registered publishers, Monitors, and Sinks.
Connection failed: timed out to <headnode fqdn>:6188The following scenarios are possible causes of these issues:
Check the Apache Ambari Metrics Collector log /var/log/ambari-metrics-collector/ambari-metrics-collector.log*.
19:59:45,457 ERROR [325874797@qtp-2095573052-22] log:87 - handle failed
java.lang.OutOfMemoryError: Java heap space

19:59:45,457 FATAL [MdsLoggerSenderThread] YarnUncaughtExceptionHandler:51 - Thread Thread[MdsLoggerSenderThread,5,main] threw an Error.  Shutting down now...
java.lang.OutOfMemoryError: Java heap space
Apache Ambari Metrics Collector is not listening on 6188 in hbase-ams log /var/log/ambari-metrics-collector/hbase-ams-master-hn*.log
2021-04-13 05:57:37,546 INFO [timeline] timeline.HadoopTimelineMetricsSink: No live collector to send metrics to. Metrics to be sent will be discarded. This message will be skipped for the next 20 times.
Get the Apache Ambari Metrics Collector pid and check GC performance
ps -fu ams | grep 'org.apache.ambari.metrics.AMSApplicationServer'
Check the garbage collection status using jstat -gcutil <pid> 1000 100. If you see the FGCT increase a lot in short seconds, it indicates Apache Ambari Metrics Collector is busy in Full GC and unable to process the other requests.
To avoid these issues, consider using one of the following options:
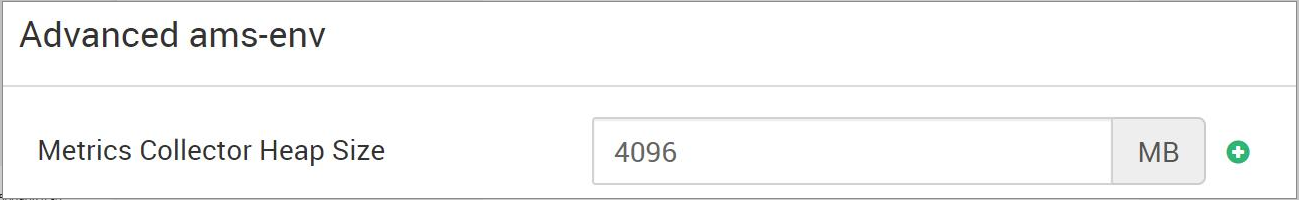
Increase the heap memory of Apache Ambari Metrics Collector from Ambari > Ambari Metrics > CONFIGS > Advanced ams-env > Metrics Collector Heap Size
Follow these steps to clean up Ambari Metrics service (AMS) data.
Note
Cleaning up the AMS data removes all the historical AMS data available. If you need the history, this may not be the best option.
hbase.rootdir (Default value is file:///mnt/data/ambari-metrics-collector/hbase)
2. hbase.tmp.dir(Default value is /var/lib/ambari-metrics-collector/hbase-tmp)'hbase.tmp.dir'/zookeeper<hbase.tmp.dir>/phoenix-spool folderhbase.rootdir identified above. Use regular OS commands to back up and remove the files. Example:
tar czf /mnt/backupof-ambari-metrics-collector-hbase-$(date +%Y%m%d-%H%M%S).tar.gz /mnt/data/ambari-metrics-collector/hbaseFor Kafka cluster, if the above solutions do not help, consider the following solutions.
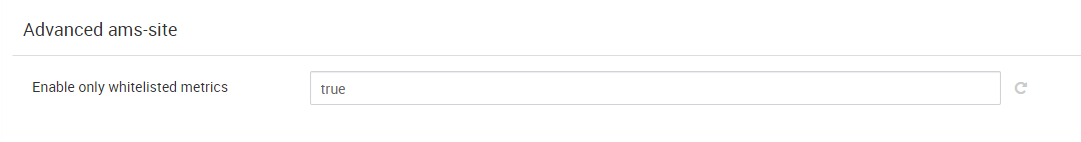
Ambari Metrics Service needs to deal with lots of kafka metrics, so it's a good idea to enable only metrics in the allowlist. Go to Ambari > Ambari Metrics > CONFIGS > Advanced ams-env, set below property to true. After this modification, need to restart the impacted services in Ambari UI as required.
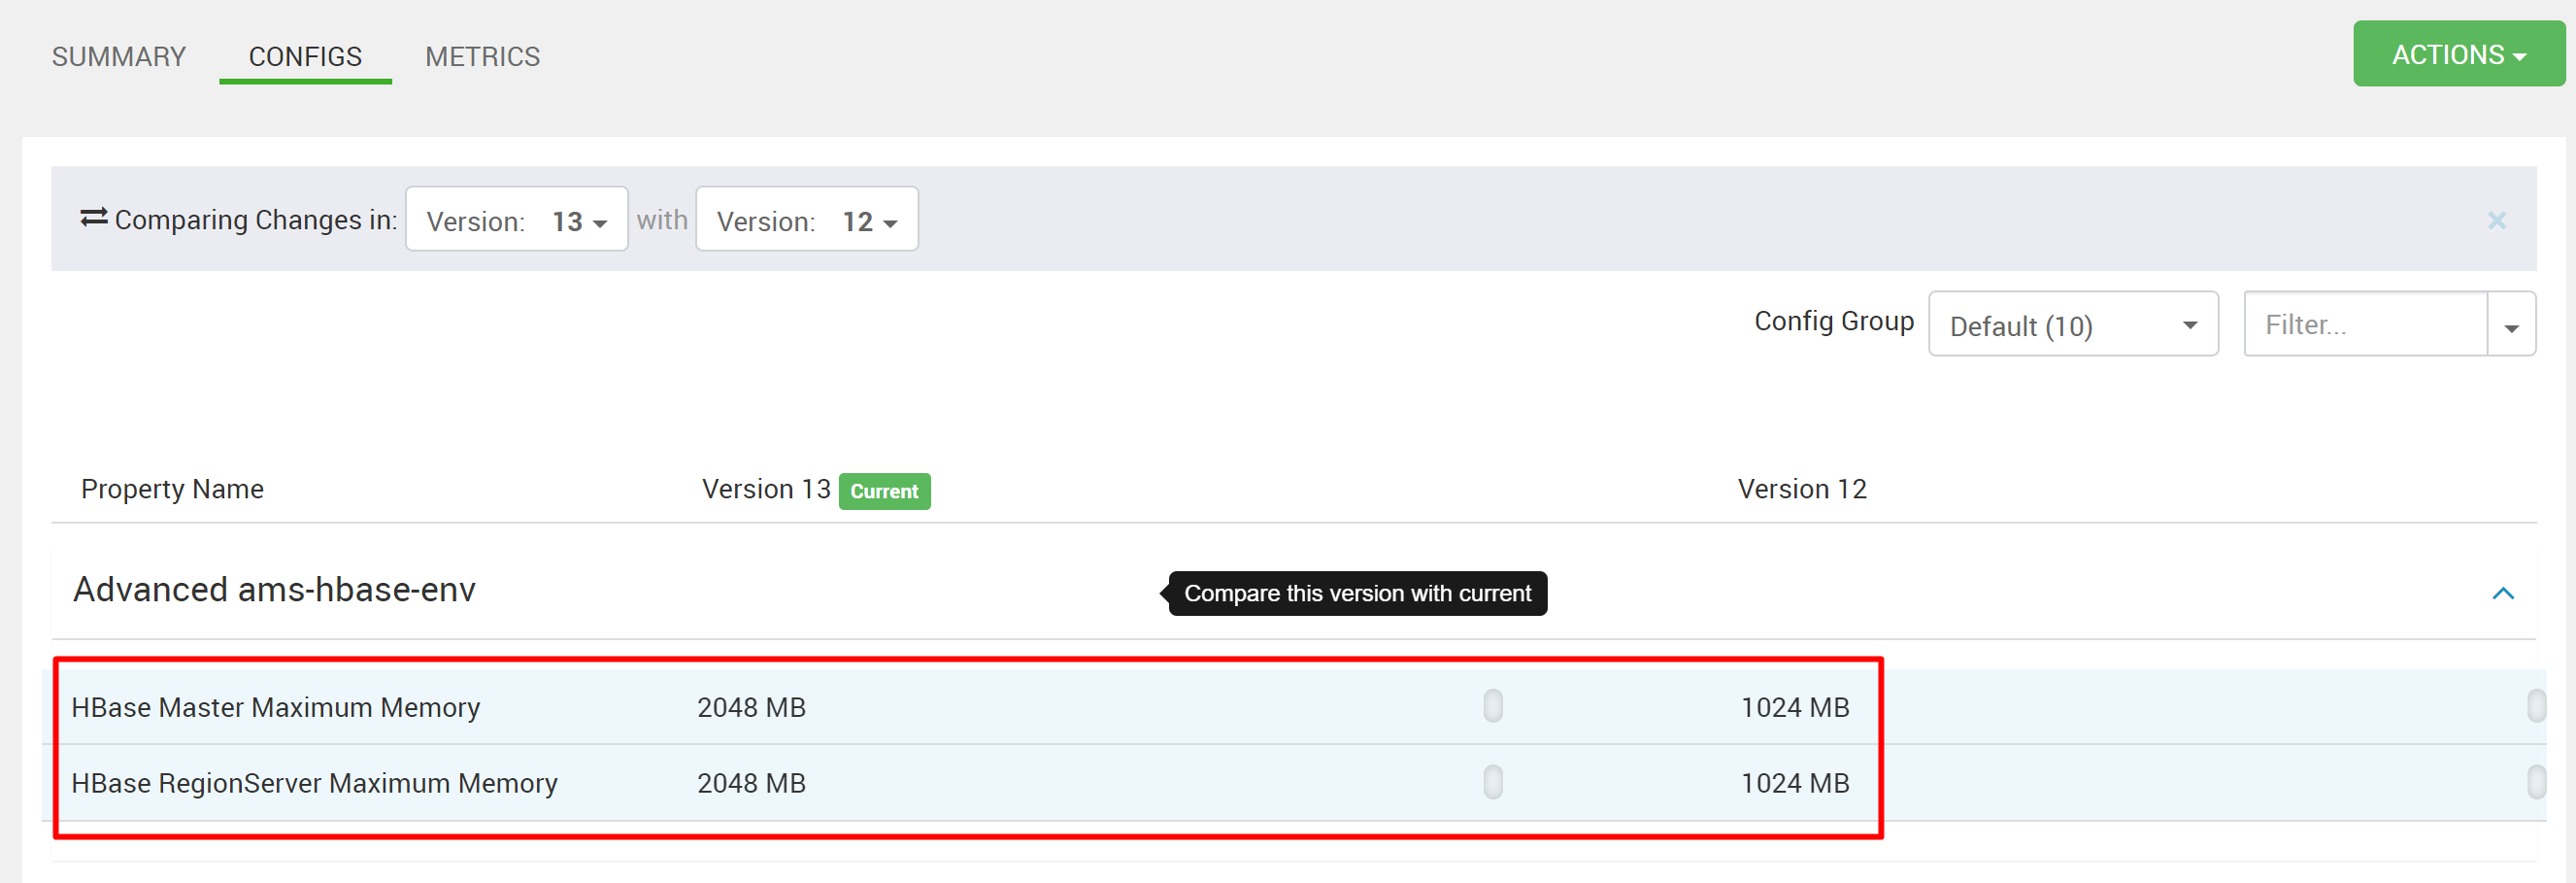
Handling lots of metrics for standalone HBase with limited memory would impact HBase response time. Hence metrics would be unavailable. If Kafka cluster has many topics and still generates a lot of allowed metrics, increase the heap memory for HMaster and RegionServer in Ambari Metrics Service. Go to Ambari > Ambari Metrics > CONFIGS > Advanced hbase-env > HBase Master Maximum Memory and HBase RegionServer Maximum Memory and increase the values. Restart the required services in Ambari UI.
If you didn't see your problem or are unable to solve your issue, visit one of the following channels for more support:
Get answers from Azure experts through Azure Community Support.
Connect with @AzureSupport - the official Microsoft Azure account for improving customer experience. Connecting the Azure community to the right resources: answers, support, and experts.
If you need more help, you can submit a support request from the Azure portal. Select Support from the menu bar or open the Help + support hub. For more detailed information, review How to create an Azure support request. Access to Subscription Management and billing support is included with your Microsoft Azure subscription, and Technical Support is provided through one of the Azure Support Plans.
Training
Module
Run Petabyte level OSS NoSQL databases with HDInsight HBase - Training
Run Petabyte level OSS NoSQL databases with HDInsight HBase