Note
Access to this page requires authorization. You can try signing in or changing directories.
Access to this page requires authorization. You can try changing directories.
Learn how to access the logs for Apache Hadoop YARN (Yet Another Resource Negotiator) applications on an Apache Hadoop cluster in Azure HDInsight.
What is Apache YARN?
YARN supports multiple programming models (Apache Hadoop MapReduce being one of them) by decoupling resource management from application scheduling/monitoring. YARN uses a global ResourceManager (RM), per-worker-node NodeManagers (NMs), and per-application ApplicationMasters (AMs). The per-application AM negotiates resources (CPU, memory, disk, network) for running your application with the RM. The RM works with NMs to grant these resources, which are granted as containers. The AM is responsible for tracking the progress of the containers assigned to it by the RM. An application may require many containers depending on the nature of the application.
Each application may consist of multiple application attempts. If an application fails, it may be retried as a new attempt. Each attempt runs in a container. In a sense, a container provides the context for basic unit of work done by a YARN application. All work that is done within the context of a container is done on the single worker node on which the container was given. See Hadoop: Writing YARN Applications, or Apache Hadoop YARN for further reference.
To scale your cluster to support greater processing throughput, you can use Autoscale or Scale your clusters manually using a few different languages.
YARN Timeline Server
The Apache Hadoop YARN Timeline Server provides generic information on completed applications
YARN Timeline Server includes the following type of data:
- The application ID, a unique identifier of an application
- The user who started the application
- Information on attempts made to complete the application
- The containers used by any given application attempt
YARN applications and logs
Application logs (and the associated container logs) are critical in debugging problematic Hadoop applications. YARN provides a nice framework for collecting, aggregating, and storing application logs with Log Aggregation.
The Log Aggregation feature makes accessing application logs more deterministic. It aggregates logs across all containers on a worker node and stores them as one aggregated log file per worker node. The log is stored on the default file system after an application finishes. Your application may use hundreds or thousands of containers, but logs for all containers run on a single worker node are always aggregated to a single file. So there's only one log per worker node used by your application. Log Aggregation is enabled by default on HDInsight clusters version 3.0 and above. Aggregated logs are located in default storage for the cluster. The following path is the HDFS path to the logs:
/app-logs/<user>/logs/<applicationId>
In the path, user is the name of the user who started the application. The applicationId is the unique identifier assigned to an application by the YARN RM.
The aggregated logs aren't directly readable, as they're written in a TFile, binary format indexed by container. Use the YARN ResourceManager logs or CLI tools to view these logs as plain text for applications or containers of interest.
Yarn logs in an ESP cluster
Two configurations must be added to the custom mapred-site in Ambari.
From a web browser, navigate to
https://CLUSTERNAME.azurehdinsight.net, whereCLUSTERNAMEis the name of your cluster.From the Ambari UI, navigate to MapReduce2 > Configs > Advanced > Custom mapred-site.
Add one of the following sets of properties:
Set 1
mapred.acls.enabled=true
mapreduce.job.acl-view-job=*
Set 2
mapreduce.job.acl-view-job=<user1>,<user2>,<user3>Save changes and restart all affected services.
YARN CLI tools
Use ssh command to connect to your cluster. Edit the following command by replacing CLUSTERNAME with the name of your cluster, and then enter the command:
ssh sshuser@CLUSTERNAME-ssh.azurehdinsight.netList all the application IDs of the currently running Yarn applications with the following command:
yarn topNote the application ID from the
APPLICATIONIDcolumn whose logs are to be downloaded.YARN top - 18:00:07, up 19d, 0:14, 0 active users, queue(s): root NodeManager(s): 4 total, 4 active, 0 unhealthy, 0 decommissioned, 0 lost, 0 rebooted Queue(s) Applications: 2 running, 10 submitted, 0 pending, 8 completed, 0 killed, 0 failed Queue(s) Mem(GB): 97 available, 3 allocated, 0 pending, 0 reserved Queue(s) VCores: 58 available, 2 allocated, 0 pending, 0 reserved Queue(s) Containers: 2 allocated, 0 pending, 0 reserved APPLICATIONID USER TYPE QUEUE #CONT #RCONT VCORES RVCORES MEM RMEM VCORESECS MEMSECS %PROGR TIME NAME application_1490377567345_0007 hive spark thriftsvr 1 0 1 0 1G 0G 1628407 2442611 10.00 18:20:20 Thrift JDBC/ODBC Server application_1490377567345_0006 hive spark thriftsvr 1 0 1 0 1G 0G 1628430 2442645 10.00 18:20:20 Thrift JDBC/ODBC ServerYou can view these logs as plain text by running one of the following commands:
yarn logs -applicationId <applicationId> -appOwner <user-who-started-the-application>
yarn logs -applicationId <applicationId> -appOwner <user-who-started-the-application> -containerId <containerId> -nodeAddress <worker-node-address>
Specify the <applicationId>, <user-who-started-the-application>, <containerId>, and <worker-node-address> information when running these commands.
Other sample commands
Download Yarn containers logs for all application masters with the following command. This step creates the log file named
amlogs.txtin text format.yarn logs -applicationId <application_id> -am ALL > amlogs.txtDownload Yarn container logs for only the latest application master with the following command:
yarn logs -applicationId <application_id> -am -1 > latestamlogs.txtDownload YARN container logs for first two application masters with the following command:
yarn logs -applicationId <application_id> -am 1,2 > first2amlogs.txtDownload all Yarn container logs with the following command:
yarn logs -applicationId <application_id> > logs.txtDownload yarn container log for a particular container with the following command:
yarn logs -applicationId <application_id> -containerId <container_id> > containerlogs.txt
YARN ResourceManager UI
The YARN ResourceManager UI runs on the cluster headnode. It's accessed through the Ambari web UI. Use the following steps to view the YARN logs:
In your web browser, navigate to
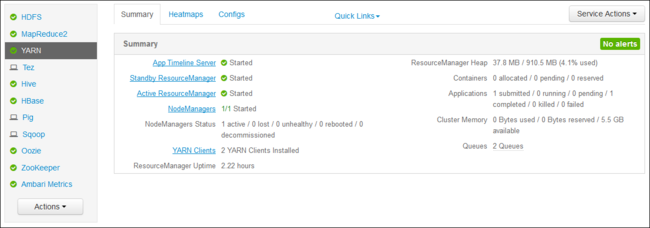
https://CLUSTERNAME.azurehdinsight.net. Replace CLUSTERNAME with the name of your HDInsight cluster.From the list of services on the left, select YARN.

From the Quick Links dropdown, select one of the cluster head nodes and then select
ResourceManager Log.
You're presented with a list of links to YARN logs.