Use selective logging with a script action in Azure HDInsight

Azure Monitor Logs is an Azure Monitor service that monitors your cloud and on-premises environments. The monitoring helps maintain their availability and performance.

Azure Monitor Logs collects data generated by resources in your cloud, resources in on-premises environments, and other monitoring tools. It uses the data to provide analysis across multiple sources. To get the analysis, you enable the selective logging feature by using a script action for HDInsight in the Azure portal.

About selective logging

Selective logging is a part of the overall monitoring system in Azure. After you connect your cluster to a Log Analytics workspace and enable selective logging, you can see logs and metrics like HDInsight security logs, Yarn Resource Manager, and system metrics. You can monitor workloads and see how they're affecting cluster stability.

Selective logging allows you to enable or disable all the tables, or enable selected tables, in the Log Analytics workspace. You can adjust the source type for each table.

Note

If Log Analytics is reinstalled in a cluster, you'll have to disable all the tables and log types again. Reinstallation resets all the configuration files to their original state.

Considerations for script actions

  • The monitoring system uses the Metadata Server Daemon (a monitoring agent) and Fluentd for collecting logs by using a unified logging layer.
  • Selective logging uses a script action to disable or enable tables and their log types. Because selective logging doesn't open any new ports or change any existing security settings, there are no security changes.
  • The script action runs in parallel on all specified nodes and changes the configuration files for disabling or enabling tables and their log types.

Prerequisites

  • A Log Analytics workspace. You can think of this workspace as a unique Azure Monitor Logs environment with its own data repository, data sources, and solutions. For instructions, see Create a Log Analytics workspace.
  • An Azure HDInsight cluster. Currently, you can use the selective logging feature with the following HDInsight cluster types:
    • Hadoop
    • HBase
    • Interactive Query
    • Spark

For instructions on how to create an HDInsight cluster, see Get started with Azure HDInsight.

Enable or disable logs by using a script action for multiple tables and log types

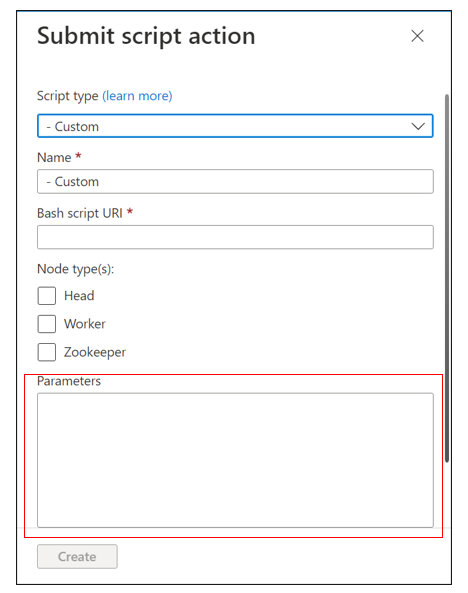
  1. Go to Script actions in your cluster and select Submit new to start the process of creating a script action.

    Screenshot that shows the button for starting the process of creating a script action.

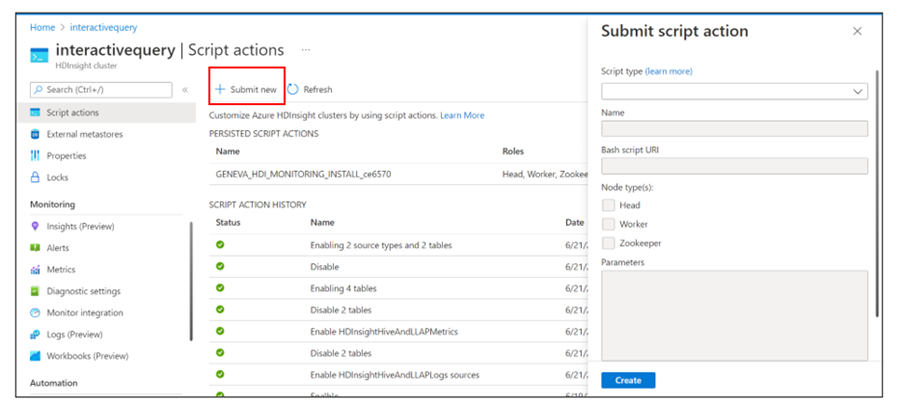
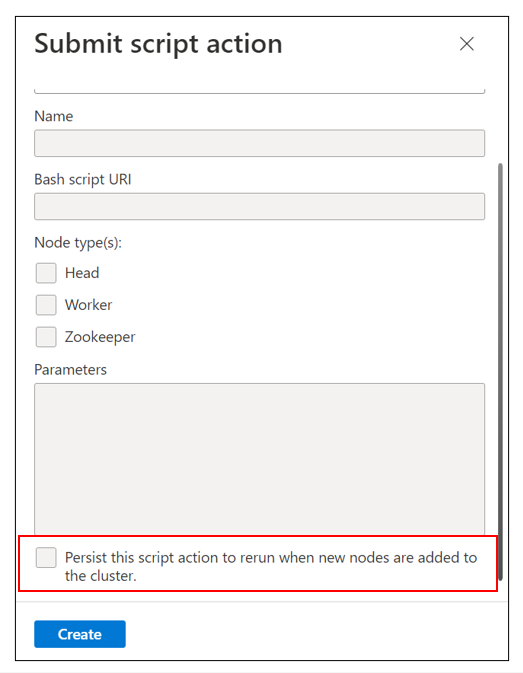
    The Submit script action pane appears.

    Screenshot that shows the pane for submitting a script action.

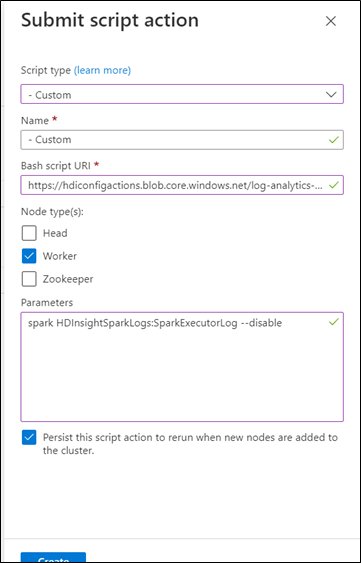
  2. For the script type, select Custom.

  3. Name the script. For example: Disable two tables and two sources.

  4. The Bash script URI must be a link to selectiveLoggingScript.sh.

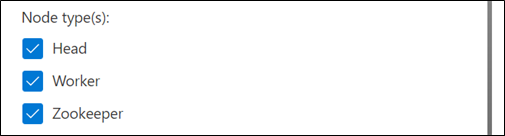
  5. Select all the node types that apply for the cluster. The options are head node, worker node, and ZooKeeper node.

  6. Define the parameters. For example:

    • Spark: spark HDInsightSparkLogs:SparkExecutorLog --disable
    • Interactive Query: interactivehive HDInsightSparkLogs:SparkExecutorLog --enable
    • Hadoop: hadoop HDInsightSparkLogs:SparkExecutorLog --disable
    • HBase: hbase HDInsightSparkLogs: HDInsightHBaseLogs --enable

    For more information, see the Parameter syntax section.

  7. Select Create.

  8. After a few minutes, a green check mark appears next to your script action history. It means the script has successfully run.

    Screenshot that shows a successful run of a script to enable tables and log types.

You'll see your changes in the Log Analytics workspace.

Troubleshooting

No changes appear in the Log Analytics workspace

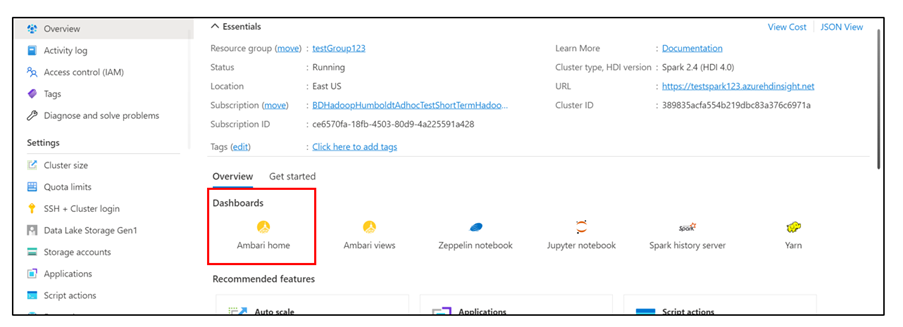
If you submit your script action but there are no changes in the Log Analytics workspace:

  1. Under Dashboards, select Ambari home to check the debug information.

    Screenshot that shows the location of the Ambari home dashboard.

  2. Select the Settings button.

    Screenshot that shows the Settings button.

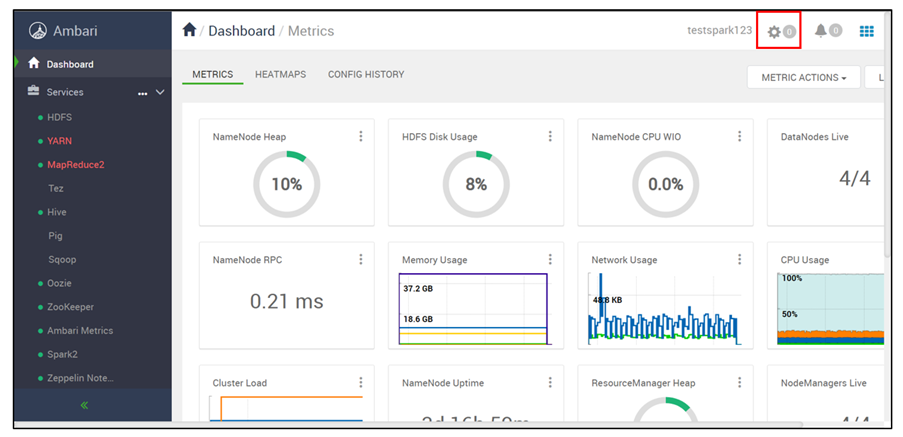
  3. Select your latest script run at the top of the list of background operations.

    Screenshot that shows background operations.

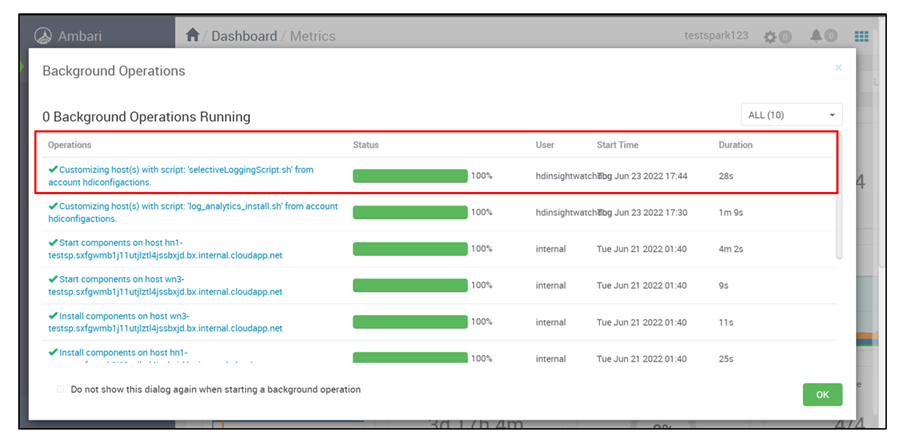
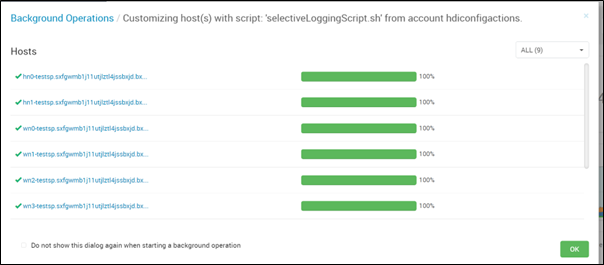
  4. Verify the script run status in all the nodes individually.

    Screenshot that shows the script run status for hosts.

  5. Check that the parameter syntax from the parameter syntax section is correct.

  6. Check that the Log Analytics workspace is connected to the cluster and that Log Analytics monitoring is turned on.

  7. Check that you selected the Persist this script action to rerun when new nodes are added to the cluster checkbox for the script action that you ran.

    Screenshot that shows the checkbox for persisting a script action.

  8. See if a new node has been added to the cluster recently.

    Note

    For the script to run in the latest cluster, the script must persist.

  9. Make sure that you selected all the node types that you wanted for the script action.

    Screenshot that shows selected node types.

The script action failed

If the script action shows a failure status in the script action history:

  1. Check that the parameter syntax from the parameter syntax section is correct.
  2. Check that the script link is correct. It should be: https://hdiconfigactions.blob.core.windows.net/log-analytics-patch/selectiveLoggingScripts/selectiveLoggingScript.sh.

Table names

Spark cluster

The following table names are for different log types (sources) inside Spark tables.

Source number Table name Log types Description
1. HDInsightAmbariCluster Alerts No log types This table contains Ambari cluster alerts from each node in the cluster (except for edge nodes). Each alert is a record in this table.
2. HDInsightAmbariSystem Metrics No log types This table contains system metrics collected from Ambari. The metrics now come from each node in the cluster (except for edge nodes) instead of just the two head nodes. Each metric is now a column, and each metric is reported once per record.
3. HDInsightHadoopAnd YarnLogs Head node: MRJobSummary, Resource Manager, TimelineServer Worker node: NodeManager This table contains all logs generated from the Hadoop and YARN frameworks.
4. HDInsightSecurityLogs AmbariAuditLog, AuthLog This table contains records from the Ambari audit and authentication logs.
5. HDInsightSparkLogs Head node: JupyterLog, LivyLog, SparkThriftDriverLog Worker node: SparkExecutorLog, SparkDriverLog This table contains all logs related to Spark and its related components: Livy and Jupyter.
6. HDInsightHadoopAnd YarnMetrics No log types This table contains JMX metrics from the Hadoop and YARN frameworks. It contains all the same JMX metrics as the old Custom Logs tables, plus more metrics that we considered important. We added Timeline Server, Node Manager, and Job History Server metrics. It contains one metric per record.
7. HDInsightOozieLogs Oozie This table contains all logs generated from the Oozie framework.

Interactive Query cluster

The following table names are for different log types (sources) inside Interactive Query tables.

Source number Table name Log types Description
1. HDInsightAmbariClusterAlerts No log types This table contains Ambari cluster alerts from each node in the cluster (except for edge nodes). Each alert is a record in this table.
2. HDInsightAmbariSystem Metrics No log types This table contains system metrics collected from Ambari. The metrics now come from each node in the cluster (except for edge nodes) instead of just the two head nodes. Each metric is now a column, and each metric is reported once per record.
3. HDInsightHadoopAndYarnLogs Head node: MRJobSummary, Resource Manager, TimelineServer Worker node: NodeManager This table contains all logs generated from the Hadoop and YARN frameworks.
4. HDInsightHadoopAndYarnMetrics No log types This table contains JMX metrics from the Hadoop and YARN frameworks. It contains all the same JMX metrics as the old Custom Logs tables, plus more metrics that we considered important. We added Timeline Server, Node Manager, and Job History Server metrics. It contains one metric per record.
5. HDInsightHiveAndLLAPLogs Head node: InteractiveHiveHSILog, InteractiveHiveMetastoreLog, ZeppelinLog This table contains logs generated from Hive, LLAP, and their related components: WebHCat and Zeppelin.
6. HDInsightHiveAndLLAPmetrics No log types This table contains JMX metrics from the Hive and LLAP frameworks. It contains all the same JMX metrics as the old Custom Logs tables. It contains one metric per record.
7. HDInsightHiveTezAppStats No log types
8. HDInsightSecurityLogs Head node: AmbariAuditLog, AuthLog ZooKeeper node, worker node: AuthLog This table contains records from the Ambari audit and authentication logs.

HBase cluster

The following table names are for different log types (sources) inside HBase tables.

Source number Table name Log types Description
1. HDInsightAmbariClusterAlerts No other log types This table contains Ambari cluster alerts from each node in the cluster (except for edge nodes). Each alert is a record in this table.
2. HDInsightAmbariSystem Metrics No other log types This table contains system metrics collected from Ambari. The metrics now come from each node in the cluster (except for edge nodes) instead of just the two head nodes. Each metric is now a column, and each metric is reported once per record.
3. HDInsightHadoopAndYarnLogs Head node: MRJobSummary, Resource Manager, TimelineServer Worker node: NodeManager This table contains all logs generated from the Hadoop and YARN frameworks.
4. HDInsightSecurityLogs Head node: AmbariAuditLog, AuthLog Worker node: AuthLog ZooKeeper node: AuthLog This table contains records from the Ambari audit and authentication logs.
5. HDInsightHBaseLogs Head node: HDFSGarbageCollectorLog, HDFSNameNodeLog Worker node: PhoenixServerLog, HBaseRegionServerLog, HBaseRestServerLog ZooKeeper node: HBaseMasterLog This table contains logs from HBase and its related components: Phoenix and HDFS.
6. HDInsightHBaseMetrics No log types This table contains JMX metrics from HBase. It contains all the same JMX metrics from the tables listed in the Old Schema column. In contrast from the old tables, each row contains one metric.
7. HDInsightHadoopAndYarn Metrics No log types This table contains JMX metrics from the Hadoop and YARN frameworks. It contains all the same JMX metrics as the old Custom Logs tables, plus more metrics that we considered important. We added Timeline Server, Node Manager, and Job History Server metrics. It contains one metric per record.

Hadoop cluster

The following table names are for different log types (sources) inside Hadoop tables.

Source number Table name Log types Description
1. HDInsightAmbariClusterAlerts No log types This table contains Ambari cluster alerts from each node in the cluster (except for edge nodes). Each alert is a record in this table.
2. HDInsightAmbariSystem Metrics No log types This table contains system metrics collected from Ambari. The metrics now come from each node in the cluster (except for edge nodes) instead of just the two head nodes. Each metric is now a column, and each metric is reported once per record.
3. HDInsightHadoopAndYarnLogs Head node: MRJobSummary, Resource Manager, TimelineServer Worker node: NodeManager This table contains all logs generated from the Hadoop and YARN frameworks.
4. HDInsightHadoopAndYarnMetrics No log types This table contains JMX metrics from the Hadoop and YARN frameworks. It contains all the same JMX metrics as the old Custom Logs tables, plus more metrics that we considered important. We added Timeline Server, Node Manager, and Job History Server metrics. It contains one metric per record.
5. HDInsightHiveAndLLAPLogs Head node: HiveMetastoreLog, HiveServer2Log, WebHcatLog This table contains logs generated from Hive, LLAP, and their related components: WebHCat and Zeppelin.
6. HDInsight Hive And LLAP Metrics No log types This table contains JMX metrics from the Hive and LLAP frameworks. It contains all the same JMX metrics as the old Custom Logs tables. It contains one metric per record.
7. HDInsight Security Logs Head node: AmbariAuditLog, AuthLog ZooKeeper node: AuthLog This table contains records from the Ambari audit and authentication logs.

Parameter syntax

Parameters define the cluster type, table names, source names, and action.

Screenshot that shows the parameter syntax box.

A parameter contains three parts:

  • Cluster type
  • Tables and log types
  • Action (either --disable or --enable)

Syntax for multiple tables

When you have multiple tables, they're separated with a comma. For example:

spark HDInsightSecurityLogs, HDInsightAmbariSystemMetrics --disable

hbase HDInsightSecurityLogs, HDInsightAmbariSystemMetrics --enable

Syntax for multiple source types or log types

When you have multiple source types or log types, they're separated with a space.

To disable a source, write the table name that contains the log types, followed by a colon and then the real log type name:

TableName : LogTypeName

For example, assume that spark HDInsightSecurityLogs is a table that has two log types: AmbariAuditLog and AuthLog. To disable both the log types, the correct syntax would be:

spark HDInsightSecurityLogs: AmbariAuditLog AuthLog --disable

Syntax for multiple tables and source types

If you need to disable two tables and two source types, use the following syntax:

  • Spark: InteractiveHiveMetastoreLog log type in the HDInsightHiveAndLLAPLogs table
  • Hbase: InteractiveHiveHSILog log type in the HDInsightHiveAndLLAPLogs table
  • Hadoop: HDInsightHiveAndLLAPMetrics table
  • Hadoop: HDInsightHiveTezAppStats table

Separate the tables with a comma. Denote sources by using a colon after the table name in which they reside.

The correct parameter syntax for these cases would be:

interactivehive HDInsightHiveAndLLAPLogs: InteractiveHiveMetastoreLog, HDInsightHiveAndLLAPMetrics, HDInsightHiveTezAppStats, HDInsightHiveAndLLAPLogs: InteractiveHiveHSILog --enable 

Next steps