Note
Access to this page requires authorization. You can try signing in or changing directories.
Access to this page requires authorization. You can try changing directories.
This article provides step-by-step guidance on how to use HDInsight Tools in Azure Toolkit for IntelliJ to debug applications remotely on an HDInsight cluster.
Prerequisites
An Apache Spark cluster on HDInsight. See Create an Apache Spark cluster.
For Windows users: While you're running the local Spark Scala application on a Windows computer, you might get an exception, as explained in SPARK-2356. The exception occurs because WinUtils.exe is missing on Windows.
To resolve this error, download Winutils.exe to a location such as C:\WinUtils\bin. Then, add the environment variable HADOOP_HOME, and set the value of the variable to C:\WinUtils.
IntelliJ IDEA (The Community edition is free.).
An SSH client. For more information, see Connect to HDInsight (Apache Hadoop) using SSH.
Create a Spark Scala application
Start IntelliJ IDEA, and select Create New Project to open the New Project window.
Select Apache Spark/HDInsight from the left pane.
Select Spark Project with Samples (Scala) from the main window.
From the Build tool drop-down list, select one of the following:
- Maven for Scala project-creation wizard support.
- SBT for managing the dependencies and building for the Scala project.
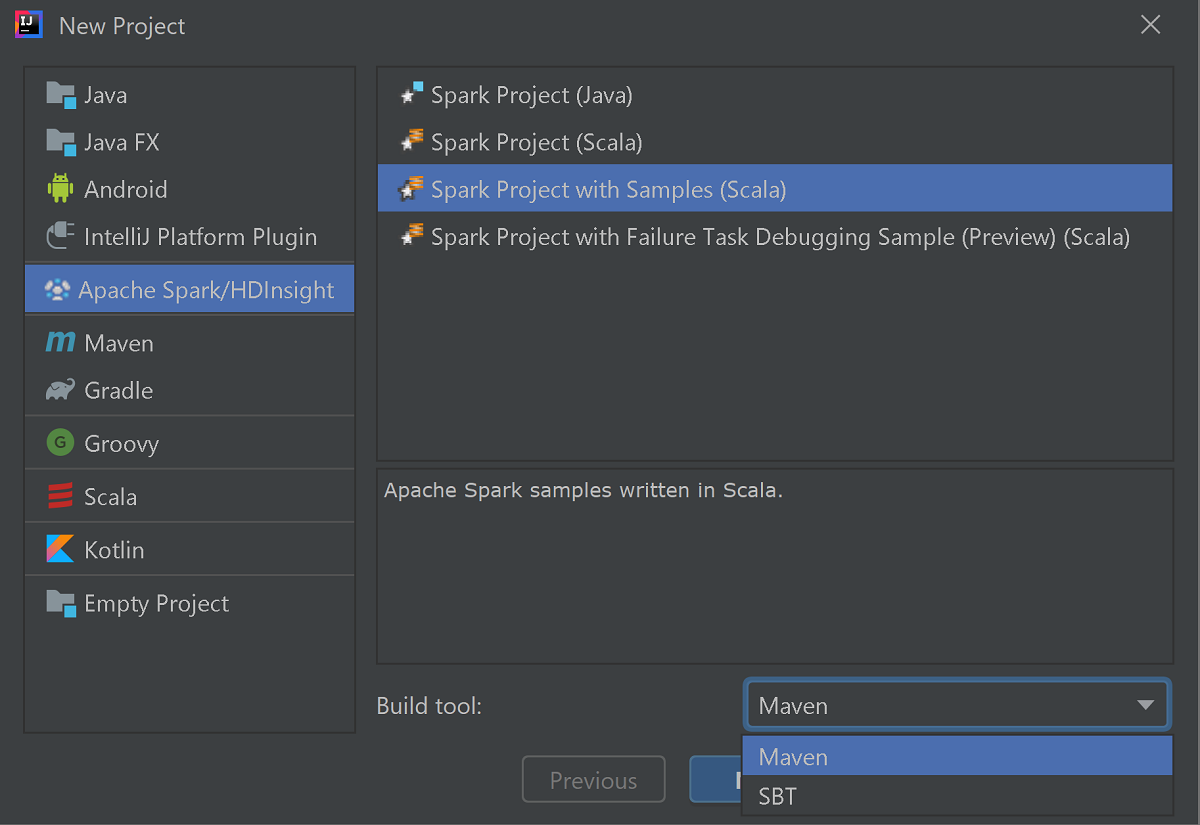
Select Next.
In the next New Project window, provide the following information:
Property Description Project name Enter a name. This walk through uses myApp.Project location Enter the desired location to save your project. Project SDK If blank, select New... and navigate to your JDK. Spark Version The creation wizard integrates the proper version for Spark SDK and Scala SDK. If the Spark cluster version is earlier than 2.0, select Spark 1.x. Otherwise, select Spark 2.x.. This example uses Spark 2.3.0 (Scala 2.11.8). 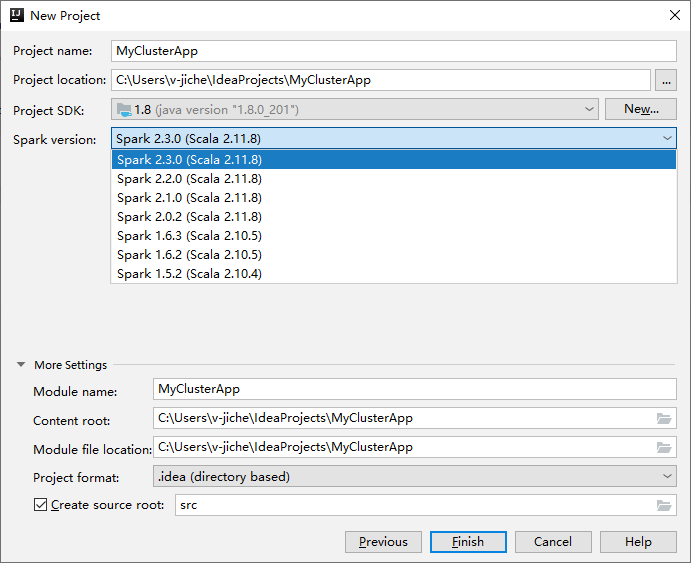
Select Finish. It may take a few minutes before the project becomes available. Watch the bottom right-hand corner for progress.
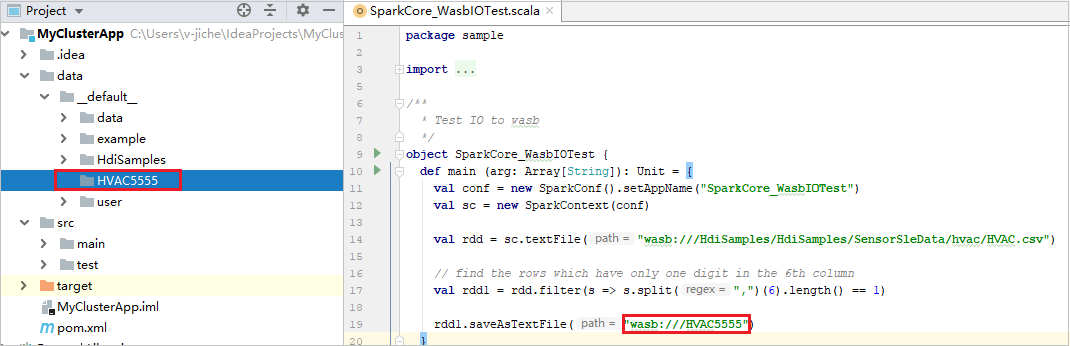
Expand your project, and navigate to src > main > scala > sample. Double-click SparkCore_WasbIOTest.
Perform local run
From the SparkCore_WasbIOTest script, right-click the script editor, and then select the option Run 'SparkCore_WasbIOTest' to perform local run.
Once local run completed, you can see the output file save to your current project explorer data > default.
Our tools have set the default local run configuration automatically when you perform the local run and local debug. Open the configuration [Spark on HDInsight] XXX on the upper right corner, you can see the [Spark on HDInsight]XXX already created under Apache Spark on HDInsight. Switch to Locally Run tab.
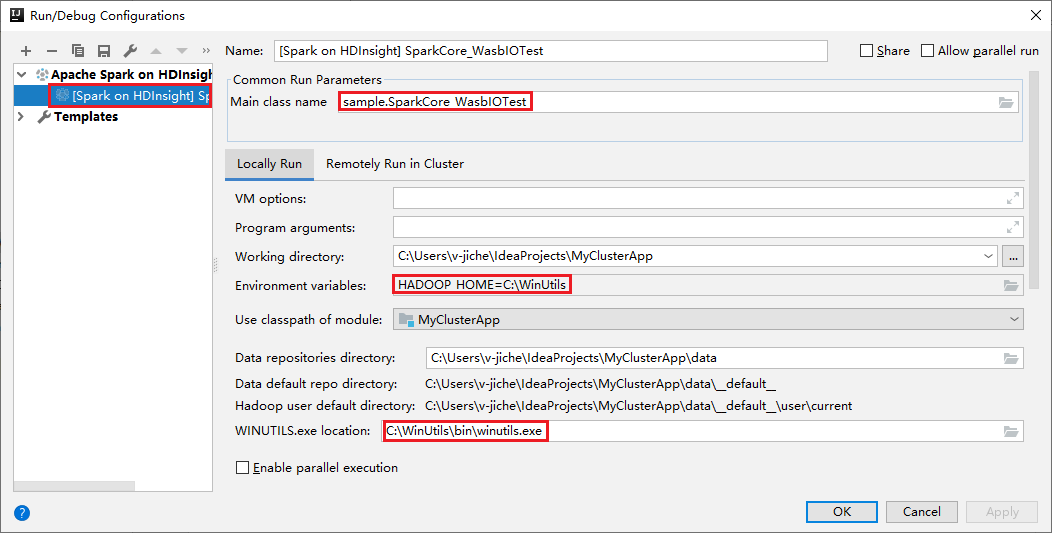
- Environment variables: If you already set the system environment variable HADOOP_HOME to C:\WinUtils, it can auto detect that no need to manually add.
- WinUtils.exe Location: If you have not set the system environment variable, you can find the location by clicking its button.
- Just choose either of two options and, they are not needed on macOS and Linux.
You can also set the configuration manually before performing local run and local debug. In the preceding screenshot, select the plus sign (+). Then select the Apache Spark on HDInsight option. Enter information for Name, Main class name to save, then click the local run button.
Perform local debugging
Open the SparkCore_wasbloTest script, set breakpoints.
Right-click the script editor, and then select the option Debug '[Spark on HDInsight]XXX' to perform local debugging.
Perform remote run
Navigate to Run > Edit Configurations.... From this menu, you can create or edit the configurations for remote debugging.
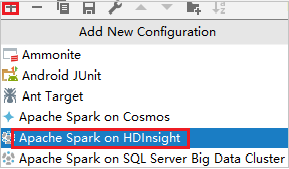
In the Run/Debug Configurations dialog box, select the plus sign (+). Then select the Apache Spark on HDInsight option.
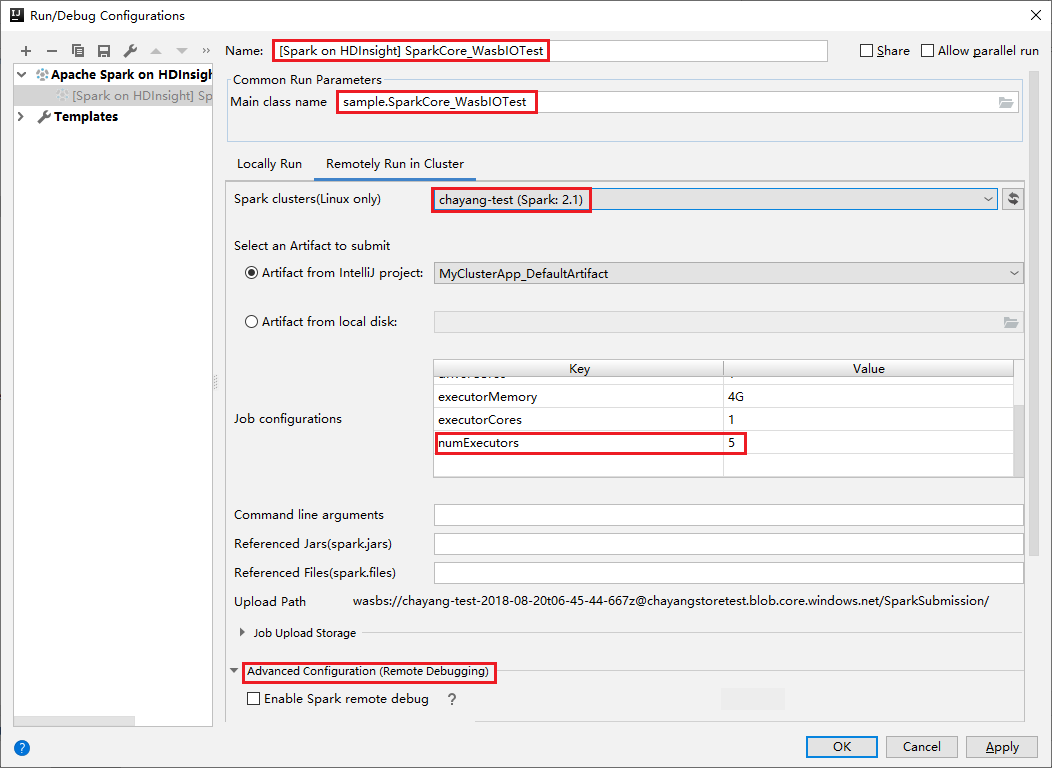
Switch to Remotely Run in Cluster tab. Enter information for Name, Spark cluster, and Main class name. Then Click Advanced configuration (Remote Debugging). Our tools support debug with Executors. The numExecutors, the default value is 5. You'd better not set higher than 3.
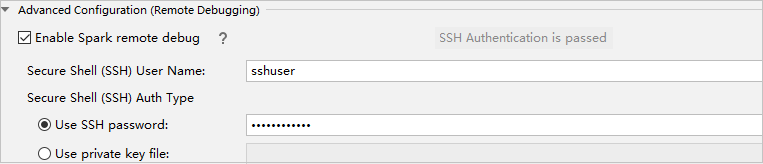
In the Advanced Configuration (Remote Debugging) part, select Enable Spark remote debug. Enter the SSH username, and then enter a password or use a private key file. If you want to perform remote debug, you need to set it. There is no need to set it if you just want to use remote run.
The configuration is now saved with the name you provided. To view the configuration details, select the configuration name. To make changes, select Edit Configurations.
After you complete the configurations settings, you can run the project against the remote cluster or perform remote debugging.

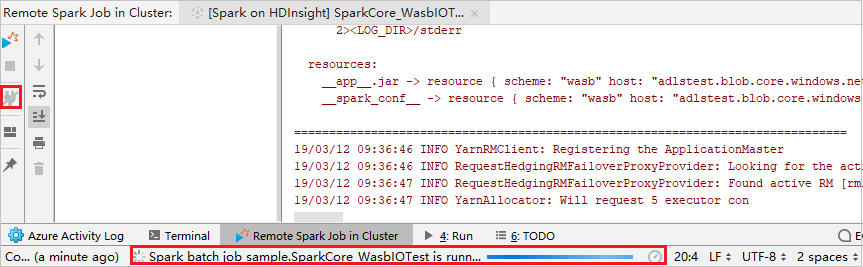
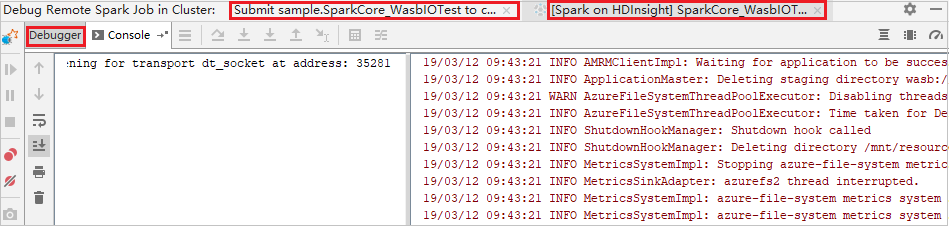
Click the Disconnect button that the submission logs not appear in the left panel. However, it is still running on the backend.
Perform remote debugging
Set up breaking points, and then Click the Remote debug icon. The difference with remote submission is that SSH username/password need to be configured.

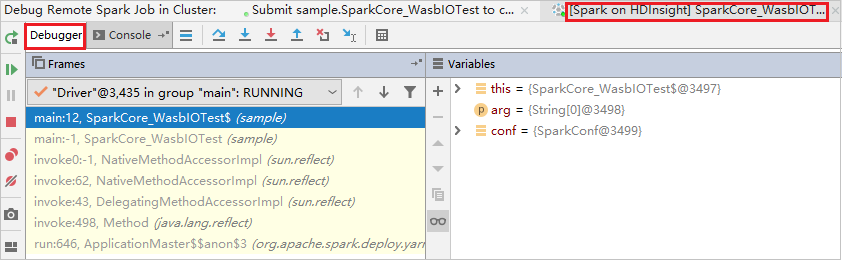
When the program execution reaches the breaking point, you see a Driver tab and two Executor tabs in the Debugger pane. Select the Resume Program icon to continue running the code, which then reaches the next breakpoint. You need to switch to the correct Executor tab to find the target executor to debug. You can view the execution logs on the corresponding Console tab.
Perform remote debugging and bug fixing
Set up two breaking points, and then select the Debug icon to start the remote debugging process.
The code stops at the first breaking point, and the parameter and variable information are shown in the Variables pane.
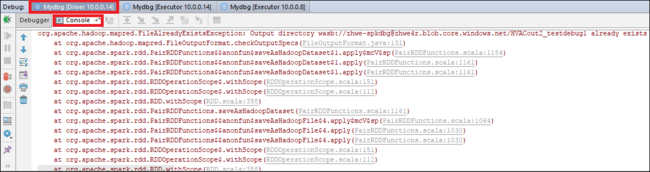
Select the Resume Program icon to continue. The code stops at the second point. The exception is caught as expected.
Select the Resume Program icon again. The HDInsight Spark Submission window displays a "job run failed" error.
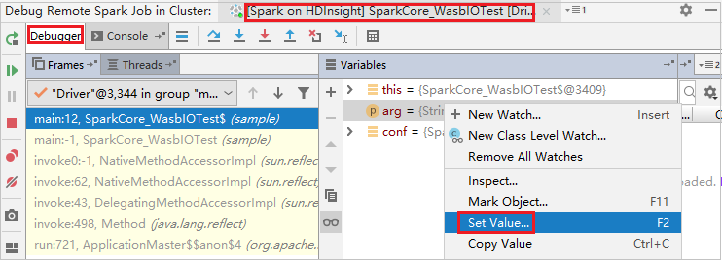
To dynamically update the variable value by using the IntelliJ debugging capability, select Debug again. The Variables pane appears again.
Right-click the target on the Debug tab, and then select Set Value. Next, enter a new value for the variable. Then select Enter to save the value.
Select the Resume Program icon to continue to run the program. This time, no exception is caught. You can see that the project runs successfully without any exceptions.

Next steps
Scenarios
- Apache Spark with BI: Perform interactive data analysis by using Spark in HDInsight with BI tools
- Apache Spark with Machine Learning: Use Spark in HDInsight to analyze building temperature using HVAC data
- Apache Spark with Machine Learning: Use Spark in HDInsight to predict food inspection results
- Website log analysis using Apache Spark in HDInsight
Create and run applications
- Create a standalone application using Scala
- Run jobs remotely on an Apache Spark cluster using Apache Livy
Tools and extensions
- Use Azure Toolkit for IntelliJ to create Apache Spark applications for an HDInsight cluster
- Use Azure Toolkit for IntelliJ to debug Apache Spark applications remotely through VPN
- Use HDInsight Tools in Azure Toolkit for Eclipse to create Apache Spark applications
- Use Apache Zeppelin notebooks with an Apache Spark cluster on HDInsight
- Kernels available for Jupyter Notebook in the Apache Spark cluster for HDInsight
- Use external packages with Jupyter Notebooks
- Install Jupyter on your computer and connect to an HDInsight Spark cluster