Note
Access to this page requires authorization. You can try signing in or changing directories.
Access to this page requires authorization. You can try changing directories.
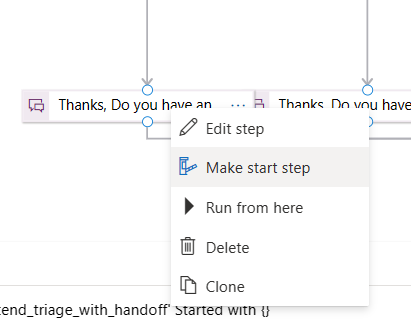
The Web Chat pane in the lower right of the Scenario editor allows you to run and test scenarios as you go. You can start debugging a scenario by pressing on the start button or select a scenario element, right-click, and select Make Start Step or Run from here
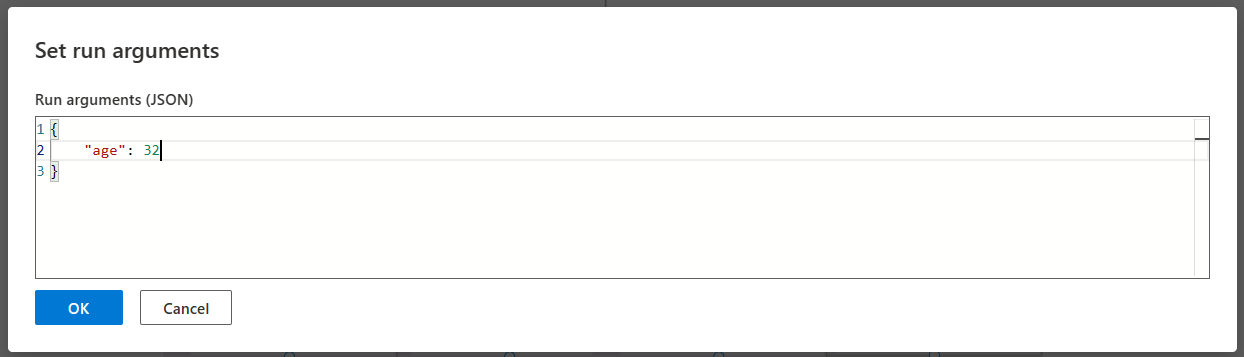
Run Scenario with arguments
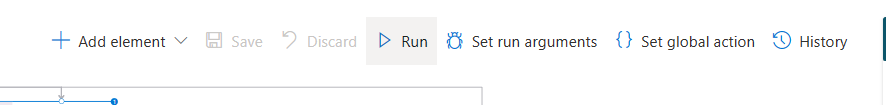
You can run the currently edited scenario by clicking the Run button and passing arguments to the scenario. To pass arguments to the scenario, select the Set run arguments button next to the Run button.
Arguments are accessible during runtime via the scenario variable.
Arguments must be constants and can be one of the following types:
- Number
- Boolean
- String (enclosed in double quotation marks)
- JSON Object in valid JSON format.
- Array of all the above types
Arguments syntax is validated while you type. In any case, error is shown when badly formatted arguments are used to run a scenario.
Run From Here
You can start execution of a scenario from a specific step. This is useful when you want to focus on a certain path of the scenario without going through all the steps preceding it.
Right select any step you want to begin running from and select the "Run from here" option.
Debug Context
Use the Debug Context to evaluate the internal state of your scenario. You can inspect the state of your variables, scenario arguments, and the state of the healthcare agent service session.
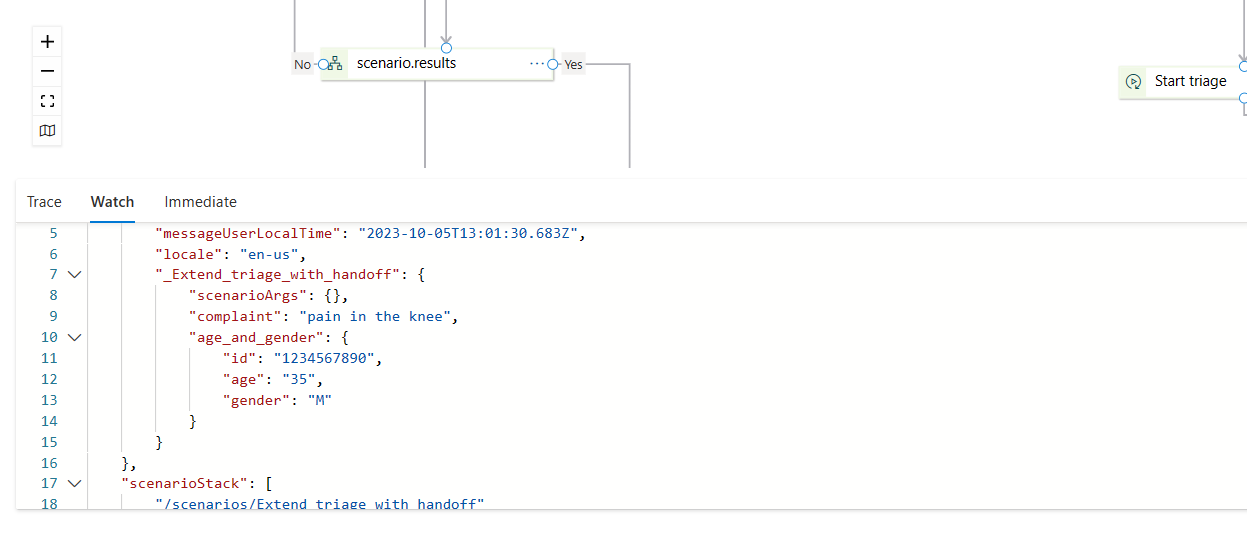
The User section provides user-specific data. The scenario author can choose to store any data about the user that will be useful for future interaction with that person, such as their age and gender. Users can delete this data by entering the "forget me" phrase during the chat. Users also have complete transparency regarding the data we store about them. They can get all this data by typing "what do you know about me."
Important
End user authentication is required to store information in the user session object. When end user authenticated is not enabled, user information such as age, gender, or custom values are stored in the conversation storage and deleted when the conversation is finished.
For more information about variable types, see also healthcare agent service Instance variables.
The Conversation section is where to look to get information about the state of your scenario. Here you see the state of the currently executing scenario, and any other scenarios that it involves. Included in the data are scenario arguments, scenario variables, and global variables.
Console Window
Trace Tab
The Trace tab can provide detailed information about the execution steps in the scenario. This information can be augmented by calling an action function with the session.trace() method, where the first parameter is what to display, described as a string or number, and the second argument is the severity level. Zero is the lowest and the default severity level and will display the trace information with a green background. Three is the highest severity level and will display the trace with a red
background. The trace window returns the trace of your code or executed steps.
In the Example scenario, we can trace the code with the following action function:
session.trace("notice", 0);

session.trace("warning", 1);

session.trace("error", 2);

session.trace("critical error", 3);
Running the code then returns the following results in the Trace window:
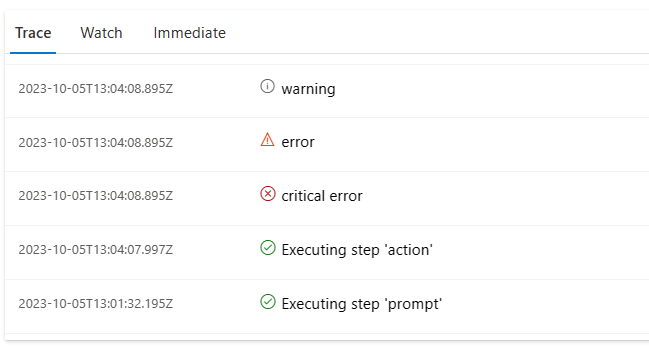
Note: The messages are delivered to the Trace window asynchronously, therefore they may appear out of order.
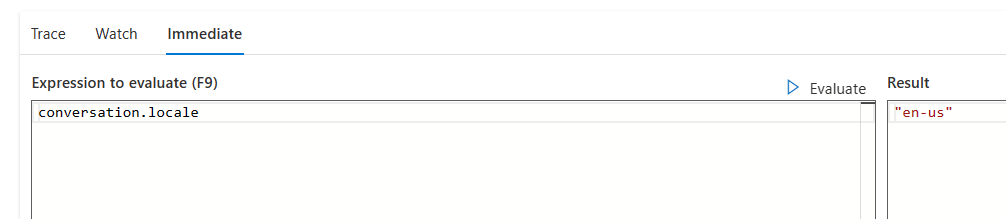
Immediate Expression Evaluation Tab
The Immediate tab allows you to run expression evaluation code while debugging the context of currently running scenario. This means that all the local and global variables are available to be inspected and modified. You can run any in-line JavaScript expression that you would run anywhere. After typing the expression, press "Enter" key or F9 to evaluate the expression you typed. The code runs in the context of the conversation, and the result will be displayed in the lower pane. Any changed value is immediately reflected in the debug context window.