Note
Access to this page requires authorization. You can try signing in or changing directories.
Access to this page requires authorization. You can try changing directories.
Applies to: ![]() IoT Edge 1.5
IoT Edge 1.5
Important
IoT Edge 1.5 LTS is the supported release. IoT Edge 1.4 LTS is end of life as of November 12, 2024. If you are on an earlier release, see Update IoT Edge.
In this article, you learn the concepts and techniques for implementing both observability dimensions: measuring and monitoring and troubleshooting. You learn about the following topics:
- Define which service performance indicators to monitor
- Measure service performance indicators by using metrics
- Monitor metrics and detect issues by using Azure Monitor workbooks
- Troubleshoot basic issues by using curated workbooks
- Troubleshoot advanced issues by using distributed tracing and correlated logs
- Optionally, deploy a sample scenario to Azure to practice what you learn
Scenario
To go beyond abstract considerations, let's use a real-life scenario that collects ocean surface temperatures from sensors into Azure IoT.
La Niña
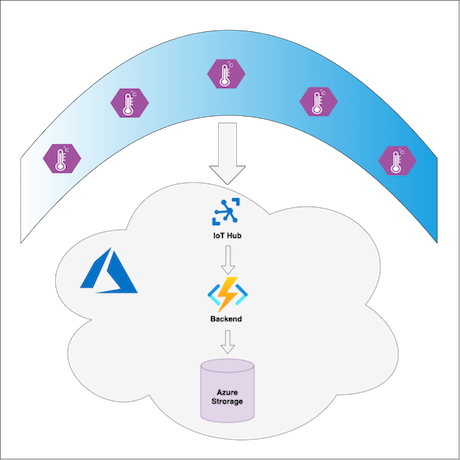
The La Niña service measures surface temperature in the Pacific Ocean to predict La Niña winters. Buoys in the ocean have IoT Edge devices that send surface temperature data to Azure Cloud. A custom module on each IoT Edge device preprocesses the telemetry data before sending it to the cloud. In the cloud, backend Azure Functions process the data and save it to Azure Blob Storage. Clients of the service, like ML inference workflows, decision-making systems, and different UIs, can get messages with temperature data from Azure Blob Storage.
Measuring and monitoring
Let's build a measuring and monitoring solution for the La Niña service focusing on its business value.
What do we measure and monitor
To understand what we're going to monitor, we must understand what the service actually does and what the service clients expect from the system. In this scenario, the expectations of a common La Niña service consumer might be categorized by the following factors:
- Coverage. The data is coming from most installed buoys
- Freshness. The data coming from the buoys is fresh and relevant
- Throughput. The temperature data is delivered from the buoys without significant delays
- Correctness. The ratio of lost messages (errors) is small
The satisfaction regarding these factors means that the service works according to the client's expectations.
The next step is to define instruments to measure values of these factors. This job is done by the following Service Level Indicators (SLI):
| Service Level Indicator | Factors |
|---|---|
| Ratio of on-line devices to the total number of devices | Coverage |
| Ratio of devices reporting frequently to the number of reporting devices | Freshness, Throughput |
| Ratio of devices successfully delivering messages to the total number of devices | Correctness |
| Ratio of devices delivering messages fast to the total number of devices | Throughput |
With that done, we can apply a sliding scale on each indicator and define exact threshold values that represent what it means for the client to be "satisfied". For this scenario, we select sample threshold values as laid out in the following table with formal Service Level Objectives (SLOs):
| Service Level Objective | Factor |
|---|---|
| 90% of devices reported metrics no longer than 10 mins ago (were online) for the observation interval | Coverage |
| 95% of online devices send temperature 10 times per minute for the observation interval | Freshness, Throughput |
| 99% of online devices deliver messages successfully with less than 5% of errors for the observation interval | Correctness |
| 95% of online devices deliver 90th percentile of messages within 50 ms for the observation interval | Throughput |
SLOs definition must also describe the approach of how the indicator values are measured:
- Observation interval: 24 hours. SLO statements are true for the last 24 hours. Which means that if an SLI goes down and breaks a corresponding SLO, it takes 24 hours after the SLI is fixed to consider the SLO good again.
- Measurements frequency: 5 minutes. We do the measurements to evaluate SLI values every 5 minutes.
- What is measured: interaction between IoT Device and the cloud, further consumption of the temperature data is out of scope.
How do we measure
At this point, it's clear what we're going to measure and what threshold values we're going to use to determine if the service performs according to the expectations.
It's a common practice to measure service level indicators, like the ones we've defined, by the means of metrics. This type of observability data is considered to be relatively small in values. It's produced by various system components and collected in a central observability backend to be monitored with dashboards, workbooks, and alerts.
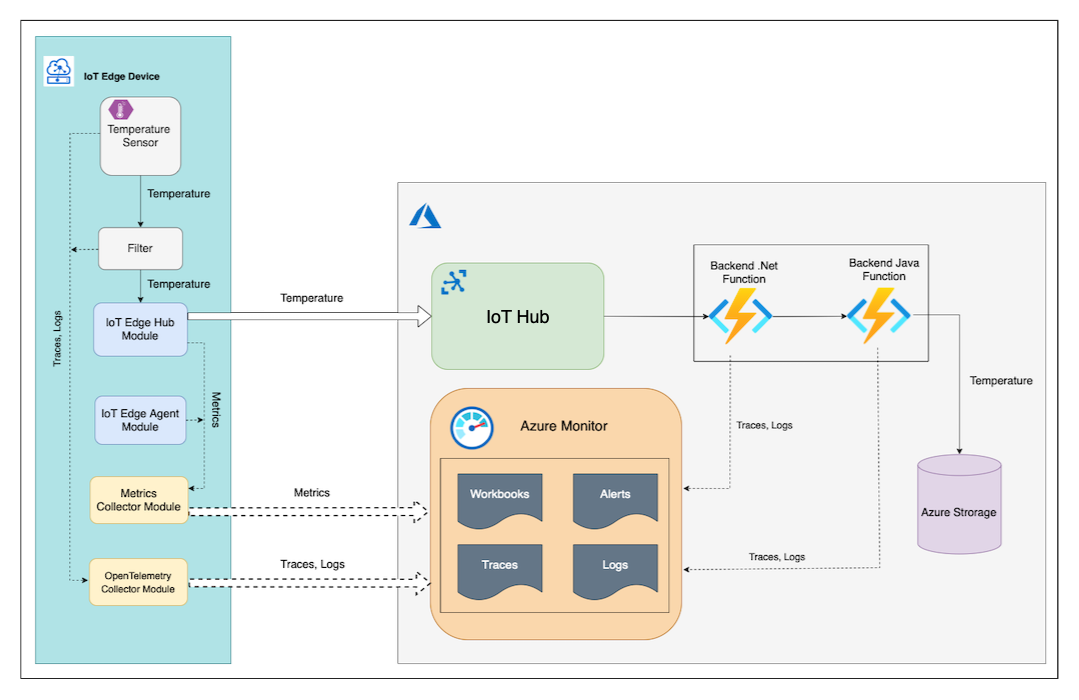
Let's clarify what components the La Niña service consists of:
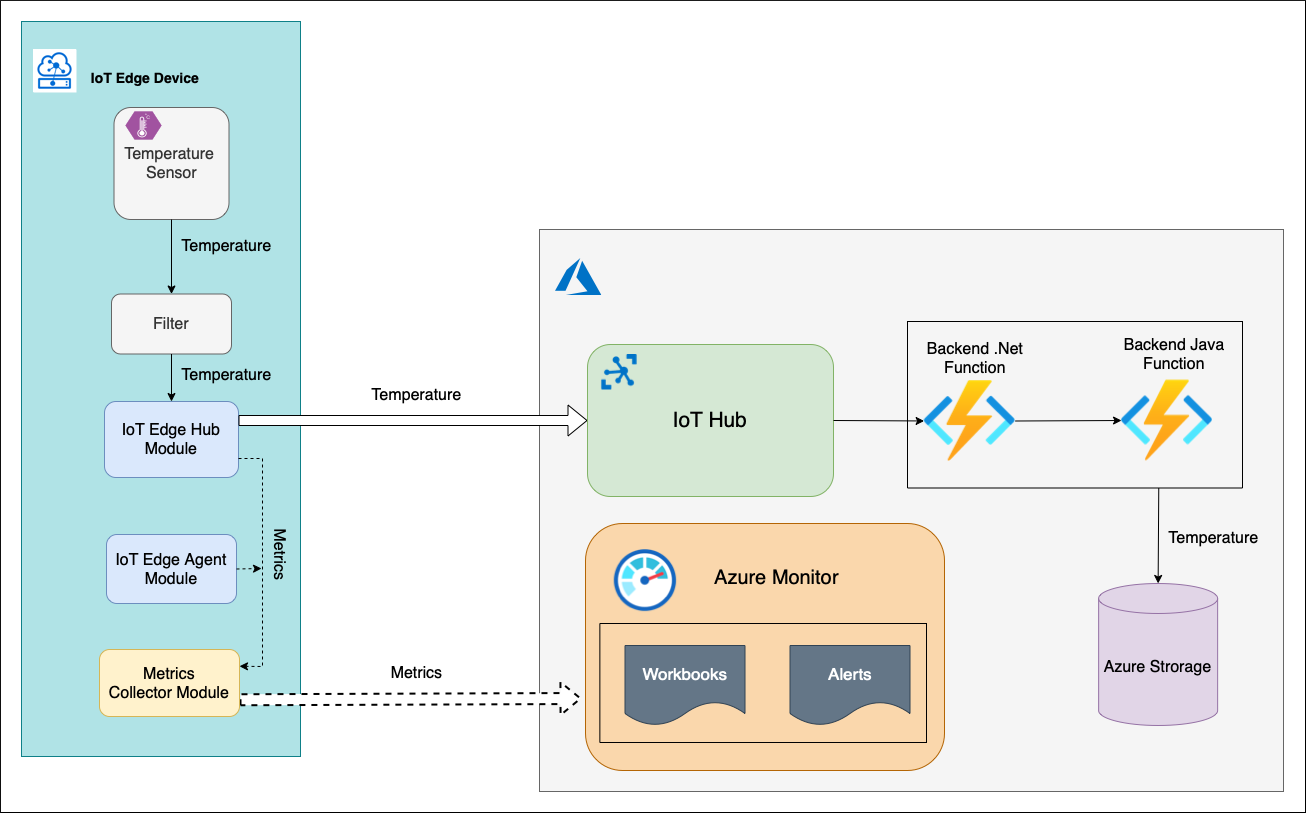
There's an IoT Edge device with Temperature Sensor custom module (C#) that generates some temperature value and sends it upstream with a telemetry message. This message is routed to another custom module Filter (C#). This module checks the received temperature against a threshold window (0-100 degrees Celsius). If the temperature is within the window, the FilterModule sends the telemetry message to the cloud.
In the cloud, the message is processed by the backend. The backend consists of a chain of two Azure Functions and storage account. Azure .NET Function picks up the telemetry message from the IoT Hub events endpoint, processes it and sends it to Azure Java Function. The Java function saves the message to the storage account blob container.
An IoT Hub device comes with system modules edgeHub and edgeAgent. These modules expose through a Prometheus endpoint a list of built-in metrics. These metrics are collected and pushed to Azure Monitor Log Analytics service by the metrics collector module running on the IoT Edge device. In addition to the system modules, the Temperature Sensor and Filter modules can be instrumented with some business specific metrics too. However, the service level indicators that we've defined can be measured with the built-in metrics only. So, we don't really need to implement anything else at this point.
In this scenario, we have a fleet of 10 buoys. One of the buoys is intentionally set up to malfunction so that we can demonstrate the issue detection and the follow-up troubleshooting.
How do we monitor
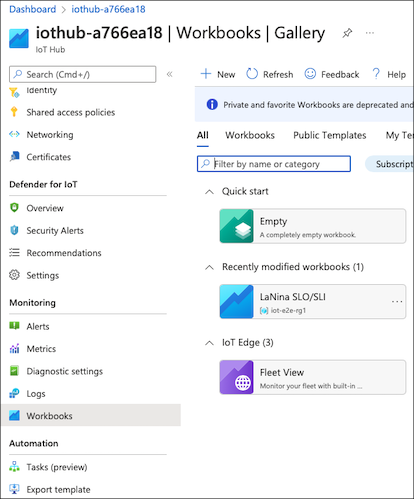
We're going to monitor Service Level Objectives (SLO) and corresponding Service Level Indicators (SLI) with Azure Monitor Workbooks. This scenario deployment includes the La Nina SLO/SLI workbook assigned to the IoT Hub.
To achieve the best user experience the workbooks are designed to follow the glance -> scan -> commit concept:
Glance
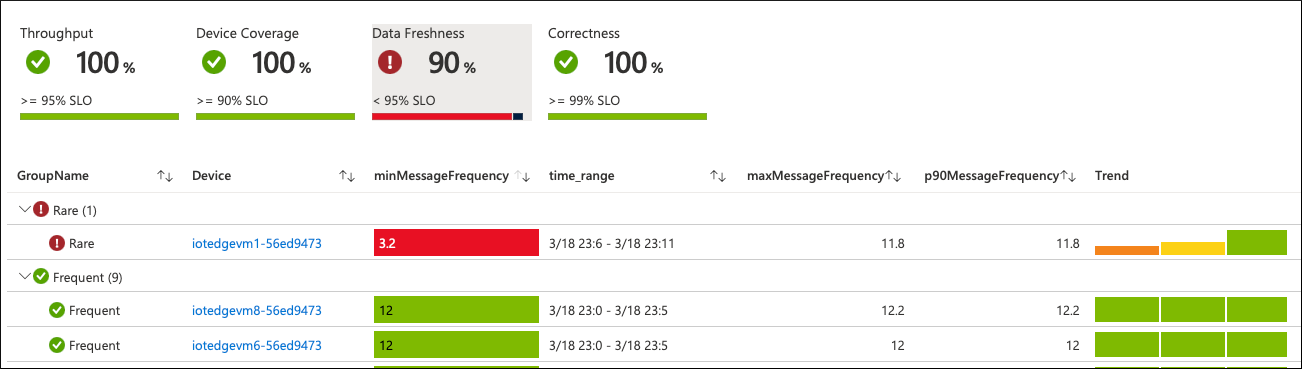
At this level, we can see the whole picture at a single glance. The data is aggregated and represented at the fleet level:
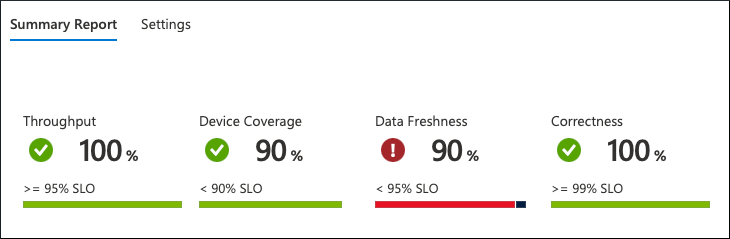
From what we can see, the service isn't functioning according to the expectations. There's a violation of the Data Freshness SLO. Only 90% of the devices send the data frequently, and the service clients expect 95%.
All SLO and threshold values are configurable on the workbook settings tab:
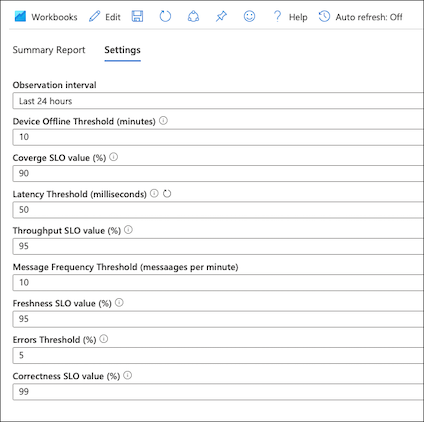
Scan
By clicking on the violated SLO, we can drill down to the scan level and see how the devices contribute to the aggregated SLI value.
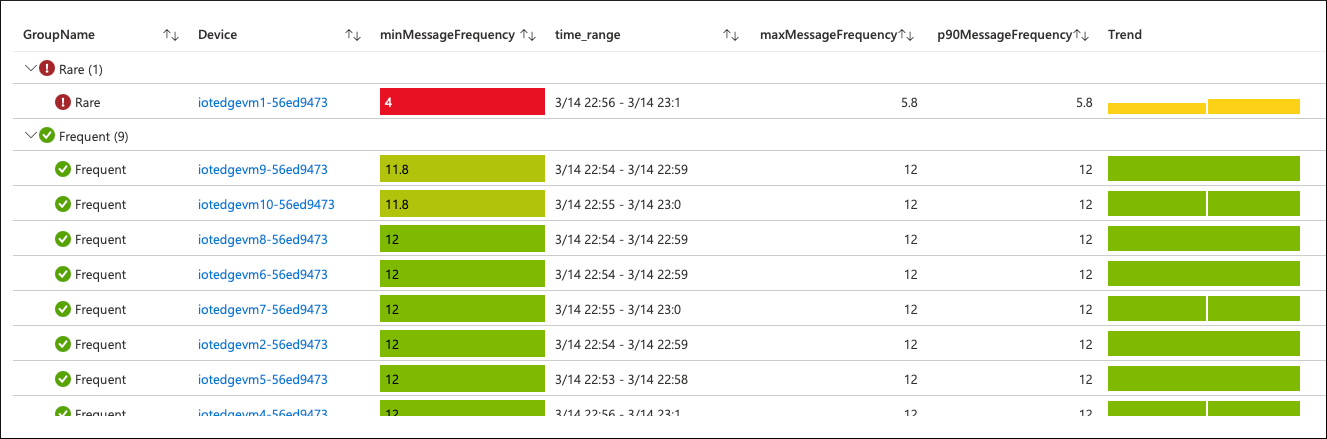
There's a single device (out of 10) that sends the telemetry data to the cloud "rarely". In our SLO definition, we've stated that "frequently" means at least 10 times per minute. The frequency of this device is way below that threshold.
Commit
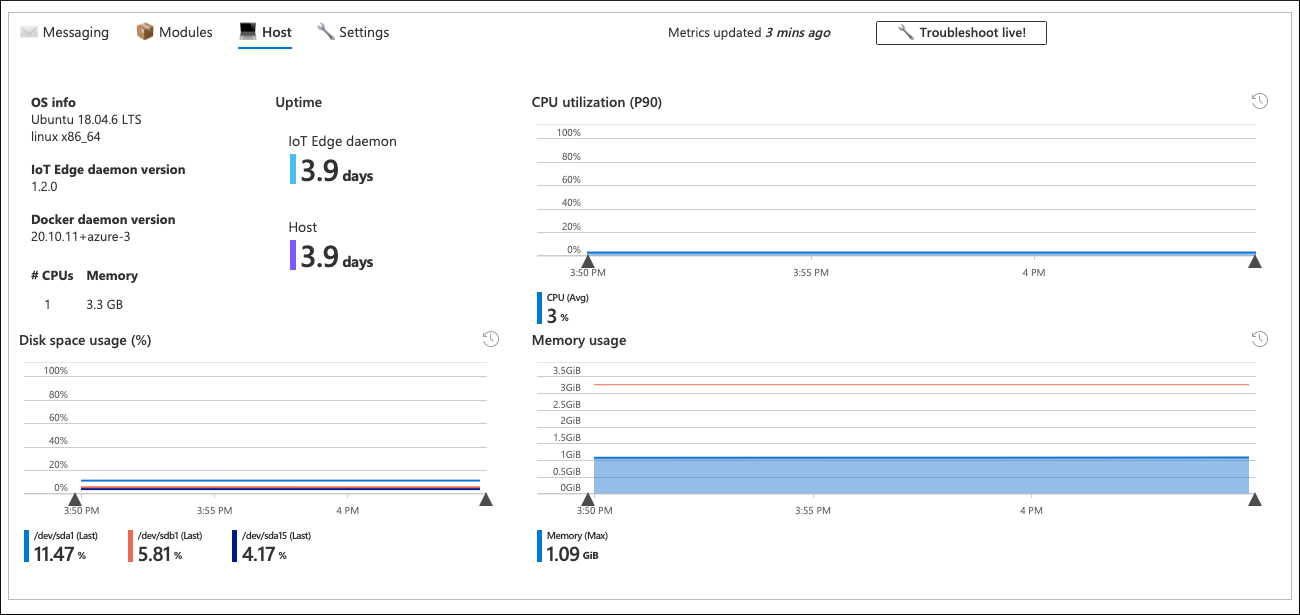
By clicking on the problematic device, we're drilling down to the commit level. This is a curated workbook Device Details that comes out of the box with IoT Hub monitoring offering. The La Nina SLO/SLI workbook reuses it to bring the details of the specific device performance.
Troubleshooting
Measuring and monitoring lets us observe and predict the system behavior, compare it to the defined expectations and ultimately detect existing or potential issues. The troubleshooting, on the other hand, lets identify and locate the cause of the issue.
Basic troubleshooting
The commit level workbook gives detailed information about device health. That includes resource consumption at the module and device level, message latency, frequency, QLen, and more. In many cases, this information can help locate the root of the issue.
In this scenario, all parameters of the trouble device look normal, and it's not clear why the device sends messages less frequently than expected. The messaging tab of the device-level workbook also confirms this:
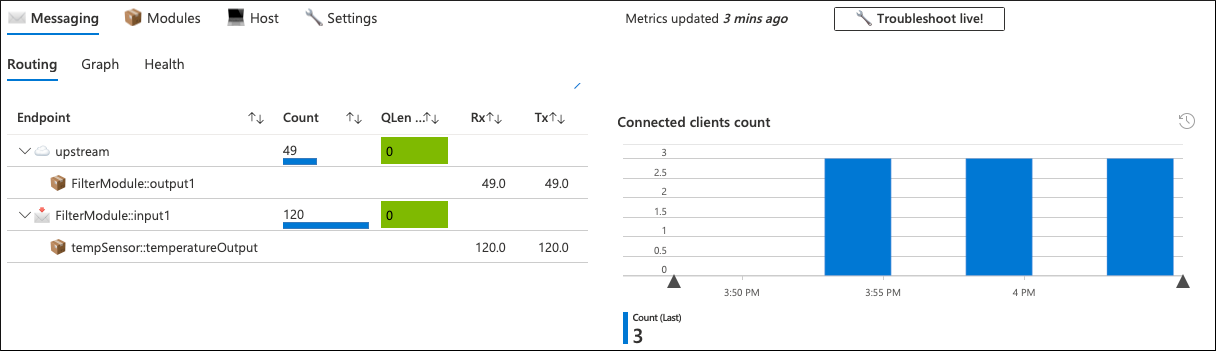
The Temperature Sensor (tempSensor) module produced 120 telemetry messages, but only 49 of them went upstream to the cloud.
First, check the logs produced by the Filter module. Select Troubleshoot live!, then select the Filter module.
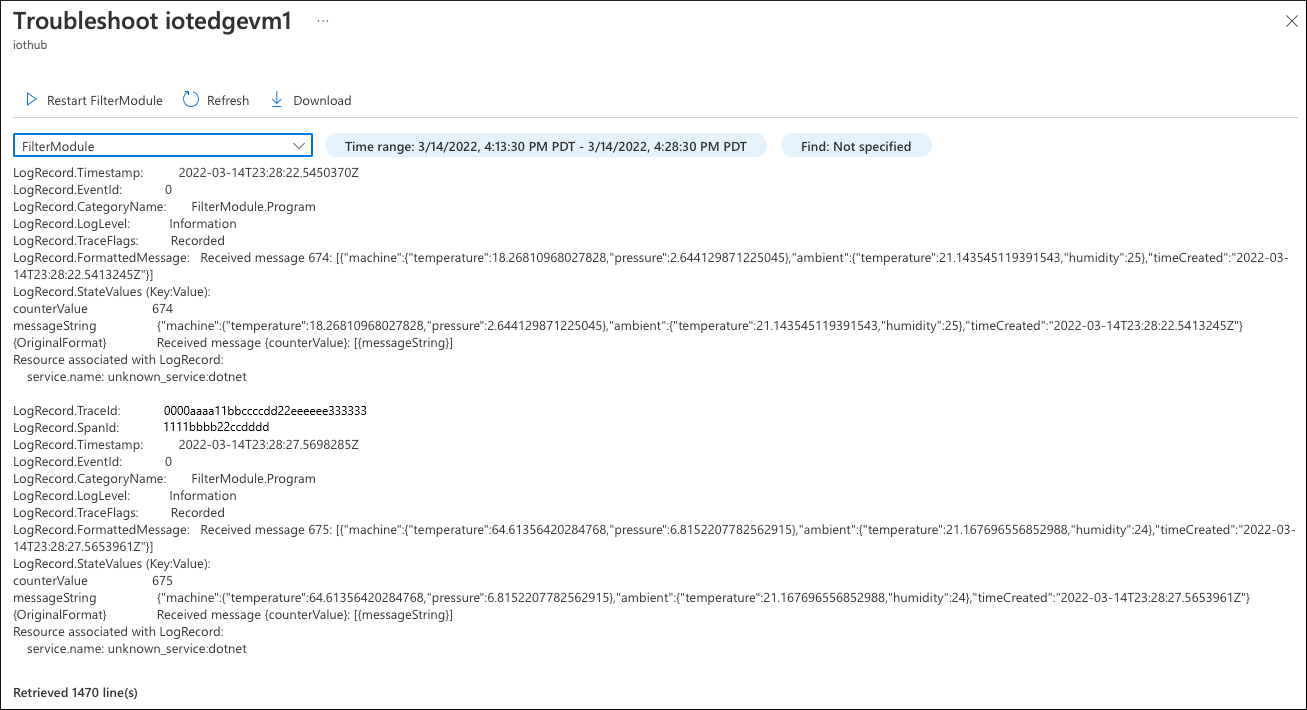
Analysis of the module logs doesn't reveal the issue. The module receives messages, and there are no errors. Everything looks good here.
Deep troubleshooting
Two observability instruments serve deep troubleshooting purposes: traces and logs. In this scenario, traces show how a telemetry message with the ocean surface temperature travels from the sensor to storage in the cloud, what is invoking what, and with what parameters. Logs show what happens inside each system component during this process. The real power of traces and logs comes when they're correlated. With this setup, you can read the logs of a specific system component, such as a module on an IoT device or a backend function, while it processes a specific telemetry message.
The La Niña service uses OpenTelemetry to produce and collect traces and logs in Azure Monitor.
IoT Edge modules Temperature Sensor and Filter export logs and tracing data by using OTLP (OpenTelemetry Protocol) to the OpenTelemetryCollector module running on the same edge device. The OpenTelemetryCollector module then exports logs and traces to Azure Monitor Application Insights.
The Azure .NET Function sends tracing data to Application Insights with Azure Monitor Open Telemetry direct exporter. It also sends correlated logs directly to Application Insights by using a configured ILogger instance.
The Java backend function uses OpenTelemetry auto-instrumentation Java agent to produce and export tracing data and correlated logs to the Application Insights instance.
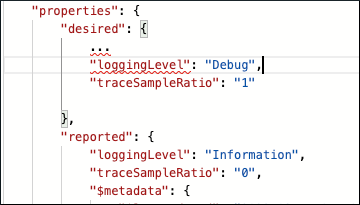
By default, IoT Edge modules on the devices of the La Niña service aren't set to produce any tracing data, and the logging level is set to Information. The amount of tracing data is controlled by a ratio based sampler. The sampler is set with a probability for a given activity to be included in a trace. By default, the probability is 0. With this setup, the devices don't flood Azure Monitor with detailed observability data if it's not needed.
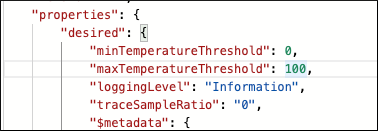
After analyzing the Information level logs of the Filter module, you need to dive deeper to find the cause of the issue. Update properties in the Temperature Sensor and Filter module twins, increase the loggingLevel to Debug, and change the traceSampleRatio from 0 to 1:
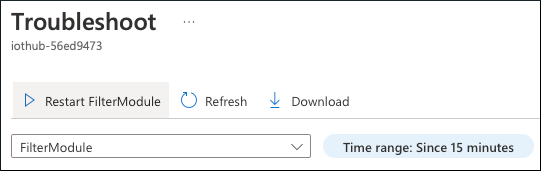
After making these changes, restart the Temperature Sensor and Filter modules:
In a few minutes, traces and detailed logs arrive in Azure Monitor from the trouble device. The entire end-to-end message flow from the sensor on the device to storage in the cloud is available for monitoring with application map in Application Insights:
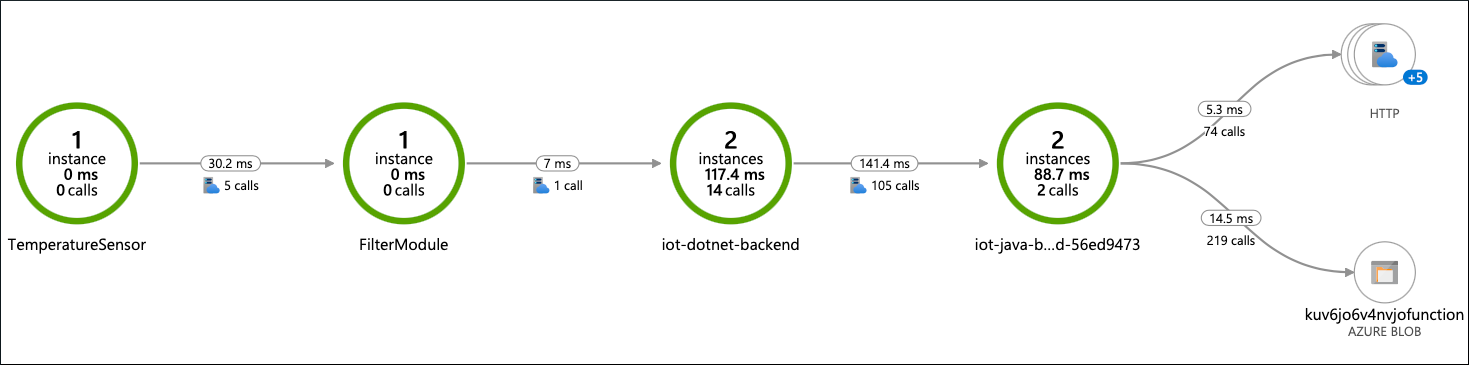
From this map, you can drill down to the traces. Some traces look normal and contain all the steps of the flow, but some are short, so nothing happens after the Filter module.
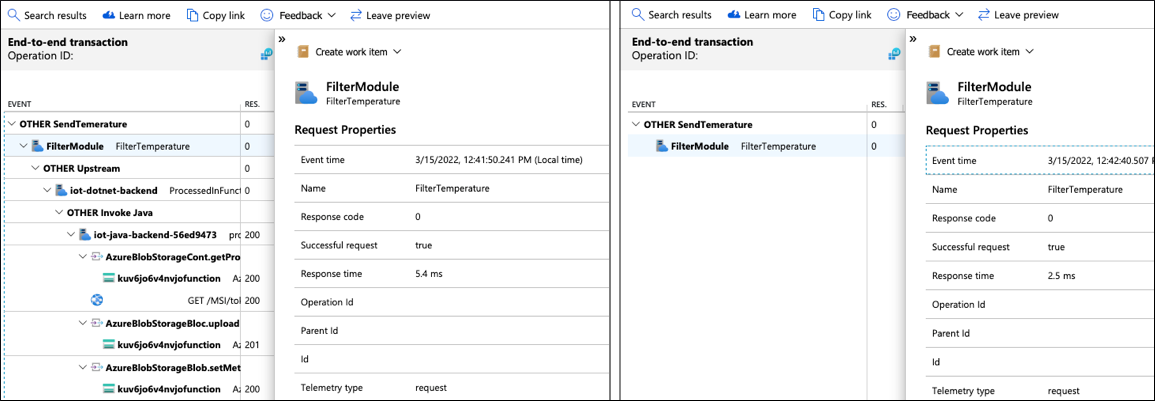
Analyze one of those short traces to find out what happened in the Filter module and why it didn't send the message upstream to the cloud.
Because logs are correlated with traces, you can query logs by specifying the TraceId and SpanId to retrieve logs for this execution instance of the Filter module:
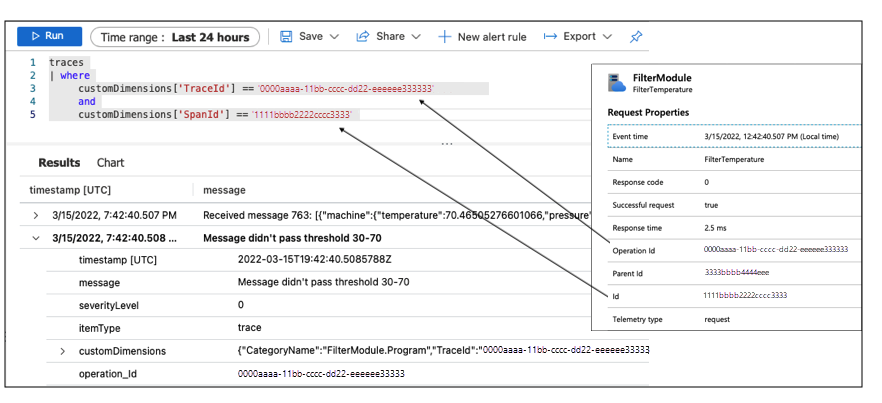
The logs show that the module received a message with a temperature of 70.465 degrees. But the filtering threshold set on this device is 30 to 70. So the message didn't pass the threshold. This device is set up incorrectly. This configuration is the cause of the issue detected while monitoring the La Niña service performance with the workbook.
Fix the Filter module configuration on this device by updating properties in the module twin. Also, reduce the loggingLevel to Information and set traceSampleRatio to 0:
After making these changes, restart the module. In a few minutes, the device reports new metric values to Azure Monitor. The workbook charts reflect these updates:
The message frequency on the problematic device returns to normal. The overall SLO value turns green again if nothing else happens during the configured observation interval:

Try the sample
At this point, you can deploy the scenario sample to Azure to follow the steps and try your own use cases.
To deploy this solution, you need:
- PowerShell
- Azure CLI
- An Azure account with an active subscription. Create one for free.
Clone the IoT Elms repository.
git clone https://github.com/Azure-Samples/iotedge-logging-and-monitoring-solution.gitOpen a PowerShell console and run the
deploy-e2e-tutorial.ps1script../Scripts/deploy-e2e-tutorial.ps1
Next steps
In this article, you set up a solution with end-to-end observability capabilities for monitoring and troubleshooting. A common challenge in these solutions for IoT systems is sending observability data from devices to the cloud. The devices in this scenario are expected to be online and have a stable connection to Azure Monitor, but that's not always the case.
Go to follow-up articles like Distributed Tracing with IoT Edge for recommendations and techniques to handle scenarios when devices are usually offline or have limited or restricted connections to the observability backend in the cloud.