Monitor, diagnose, and troubleshoot Azure IoT Hub device connectivity
Connectivity issues for IoT devices can be difficult to troubleshoot because there are many possible points of failure. Application logic, physical networks, protocols, hardware, IoT Hub, and other cloud services can all cause problems. The ability to detect and pinpoint the source of an issue is critical. However, an IoT solution at scale could have thousands of devices, so it's not practical to check individual devices manually. IoT Hub integrates with two Azure services to help you:
Azure Monitor Azure Monitor enables you to collect, analyze, and act on telemetry from IoT Hub. To help you detect, diagnose, and troubleshoot these issues at scale, use the monitoring capabilities IoT Hub provides through Azure Monitor. This includes setting up alerts to trigger notifications and actions when disconnects occur and configuring logs that you can use to discover the conditions that caused disconnects.
Azure Event Grid For critical infrastructure and per-device disconnects, use Azure Event Grid to subscribe to device connect and disconnect events emitted by IoT Hub. Azure Event Grid enables you to use any of the following event handlers:
- Azure Functions
- Logic Apps
- Azure Automation
- WebHooks
- Queue Storage
- Hybrid Connections
- Event Hubs
Event Grid vs. Azure Monitor
Event Grid provides a low-latency, per-device monitoring solution that you can use to track device connections for critical devices and infrastructure. Azure Monitor provides a metric called Connected devices that you can use to monitor the number of devices connected to your IoT Hub and trigger an alert when that number drops below a static threshold.
Consider the following when deciding whether to use Event Grid or Azure Monitor for a particular scenario:
Alert latency: IoT Hub connection events are delivered much more quickly through Event Grid. This makes Event Grid a better choice for scenarios where quick notification is desirable.
Per-device notifications: Event Grid provides the ability to track connects and disconnects for individual devices. This makes Event Grid a better choice for scenarios where you need to monitor the connections for critical devices.
Lightweight setup: Azure Monitor metric alerts provide a lightweight setup experience that doesn't require integrating with other services to deliver notifications through Email, SMS, Voice, and other notifications. With Event Grid, you need to integrate with other Azure services to deliver notifications. Both services can integrate with other services to trigger more complex actions.
Event Grid: Monitor connect and disconnect events
To monitor device connect and disconnect events in production, we recommend subscribing to the DeviceConnected and DeviceDisconnected events in Event Grid to trigger alerts and monitor device connection state. Event Grid provides lower event latency than Azure Monitor, and you can monitor on a per-device basis. These factors make Event Grid the preferred method for monitoring critical devices and infrastructure.
When you use Event Grid to monitor or trigger alerts on device disconnects, make sure you build in a way of filtering out the periodic disconnects due to SAS token renewal on devices that use the Azure IoT SDKs. To learn more, see MQTT device disconnect behavior with Azure IoT SDKs.
Explore the following articles to learn more about monitoring device connection events with Event Grid:
For an overview of using Event Grid with IoT Hub, see React to IoT Hub events with Event Grid. Pay particular attention to the Limitations for device connection state events section.
For a tutorial about ordering device connection events, see Order device connection events from Azure IoT Hub using Azure Cosmos DB.
For a tutorial about sending Email notifications, see Send email notifications about Azure IoT Hub events using Event Grid and Logic Apps in the Event Grid documentation.
Azure Monitor: Route connection events to logs
IoT hub continuously emits resource logs for several categories of operations. To collect this log data, though, you need to create a diagnostic setting to route it to a destination where it can be analyzed or archived. One such destination is Azure Monitor Logs via a Log Analytics workspace (see pricing), where you can analyze the data using Kusto queries.
The IoT Hub resource logs connections category emits operations and errors having to do with device connections. The following screenshot shows a diagnostic setting to route these logs to a Log Analytics workspace:
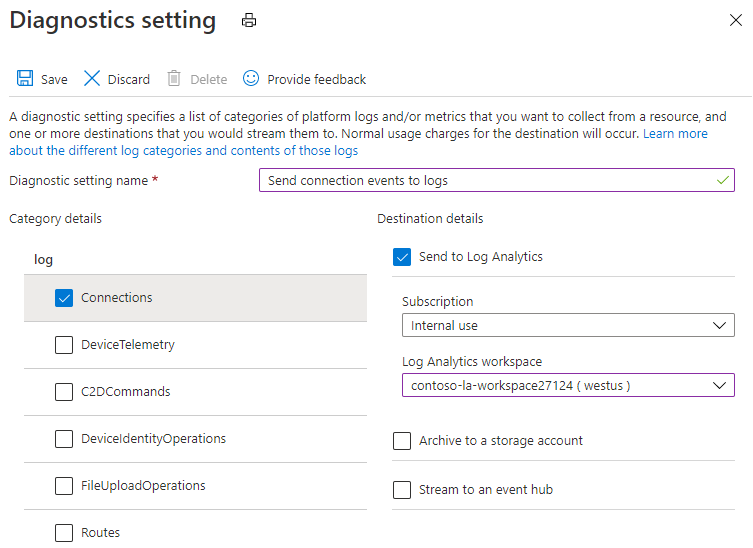
We recommend creating a diagnostic setting as early as possible after you create your IoT hub, because, although IoT Hub always emits resource logs, they aren't collected by Azure Monitor until you route them to a destination.
To learn more about routing logs to a destination, see Collection and routing. For detailed instructions to create a diagnostic setting, see the Use metrics and logs tutorial.
Azure Monitor: Set up metric alerts for device disconnects
You can set up alerts based on the platform metrics emitted by IoT Hub. With metric alerts, you can notify individuals that a condition of interest has occurred and also trigger actions that can respond to that condition automatically.
The Connected devices (preview) metric tells you how many devices are connected to your IoT Hub. You can create alerts to trigger if this metric drops below a threshold value:
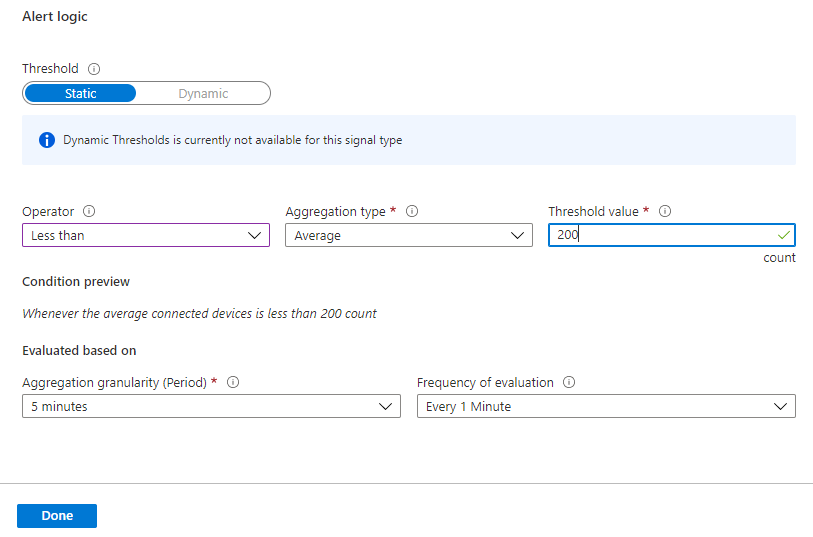
You can use metric alert rules to monitor for device disconnect anomalies at-scale. That is, use alerts to determine when a significant number of devices unexpectedly disconnect. When this is detected, you can look at logs to help troubleshoot the issue. To monitor per-device disconnects and disconnects for critical devices in near real time, however, you must use Event Grid.
To learn more about alerts with IoT Hub, see Alerts in Monitor IoT Hub. For a walk-through of creating alerts in IoT Hub, see the Use metrics and logs tutorial. For a more detailed overview of alerts, see Overview of alerts in Microsoft Azure in the Azure Monitor documentation.
Azure Monitor: Use logs to resolve connectivity errors
When you detect device disconnects by using Azure Monitor metric alerts or Event Grid, you can use logs to help troubleshoot the reason. This section describes how to look for common issues in Azure Monitor Logs. The steps below assume you've already created a diagnostic setting to send IoT Hub Connections logs to a Log Analytics workspace.
After you've created a diagnostic setting to route IoT Hub resource logs to Azure Monitor Logs, follow these steps to view the logs in Azure portal.
Navigate to your IoT hub in Azure portal.
Under Monitoring on the left pane of your IoT hub, Select Logs.
To isolate connectivity error logs for IoT Hub, enter the following query in the query editor and then select Run:
AzureDiagnostics
| where ( ResourceType == "IOTHUBS" and Category == "Connections" and Level == "Error")
If there are results, look for
OperationName,ResultType(error code), andResultDescription(error message) to get more detail.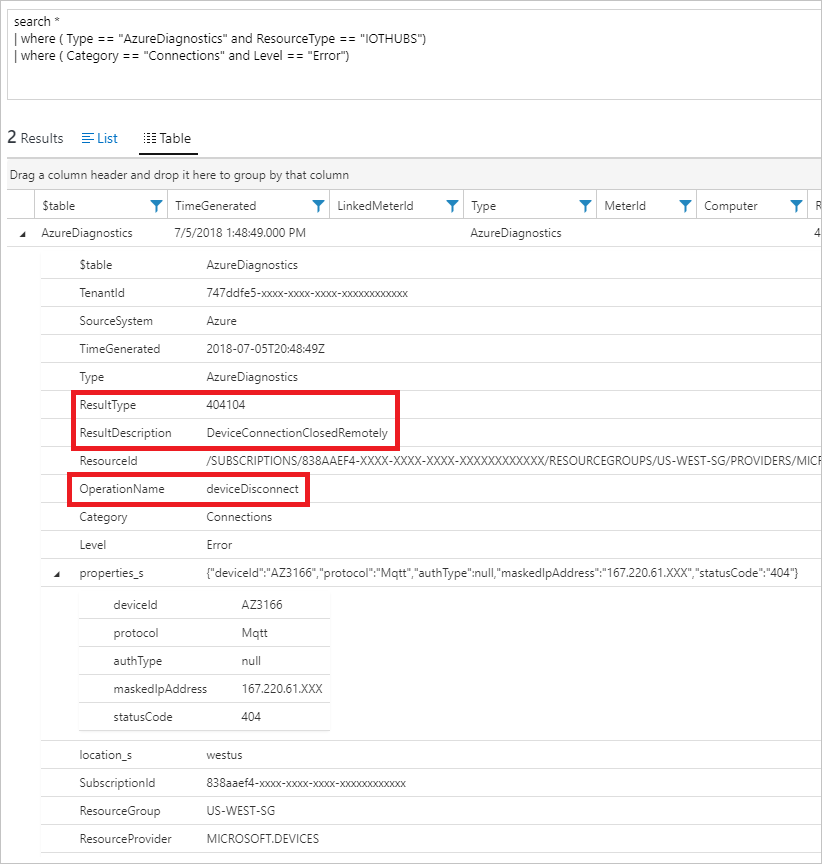
Use the following problem resolution guides for help with the most common errors:
Azure Monitor: Use logs to monitor connectivity for a specific device
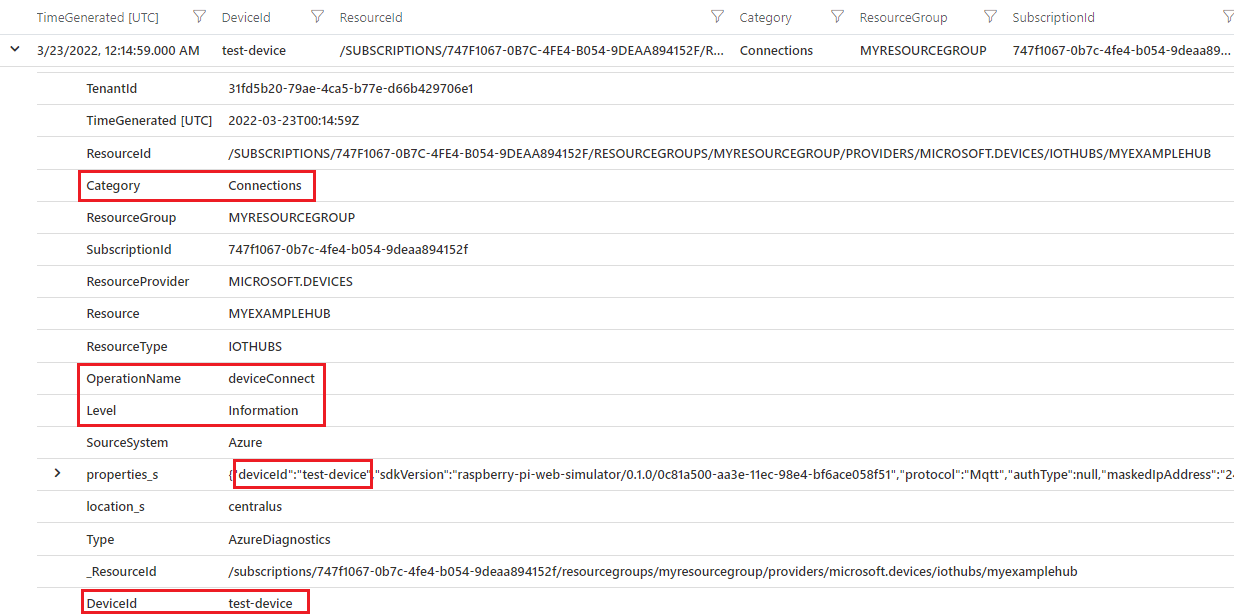
There may be situations when you want to use Azure Monitor to see connectivity errors and information for a specific device. To isolate connectivity events for a device, you can follow the same steps as in the preceding section, but enter the following query. Replace test-device with the name of your device.
AzureDiagnostics
| where ResourceProvider == "MICROSOFT.DEVICES" and ResourceType == "IOTHUBS"
| where Category == "Connections"
| extend DeviceId = tostring(parse_json(properties_s).deviceId)
| where DeviceId == "test-device"
The query returns both error and informational events for your target device. The following example output shows an informational deviceConnect event:
MQTT device disconnect behavior with Azure IoT SDKs
Azure IoT device SDKs disconnect from IoT Hub and then reconnect when they renew SAS tokens over the MQTT (and MQTT over WebSockets) protocol. In logs, this shows up as informational device disconnect and connect events sometimes accompanied by error events.
By default, the token lifespan is 60 minutes for all SDKs; however, it can be changed by developers in some of the SDKs. The following table summarizes the token lifespan, token renewal, and token renewal behavior for each of the SDKs:
| SDK | Token lifespan | Token renewal | Renewal behavior |
|---|---|---|---|
| .NET | 60 minutes, configurable | 85% of lifespan, configurable | SDK disconnects and reconnects at token lifespan plus a 10-minute grace period. Informational events and errors generated in logs. |
| Java | 60 minutes, configurable | 85% of lifespan, not configurable | SDK disconnects and reconnects at token lifespan plus a 10-minute grace period. Informational events and errors generated in logs. |
| Node.js | 60 minutes, configurable | configurable | SDK disconnects and reconnects at token renewal. Only informational events are generated in logs. |
| Python | 60 minutes, configurable | 120 seconds prior to expiration | SDK disconnects and reconnects at token lifespan. |
The following screenshots show the token renewal behavior in Azure Monitor Logs for different SDKs. The token lifespan and renewal threshold have been changed from their defaults as noted.
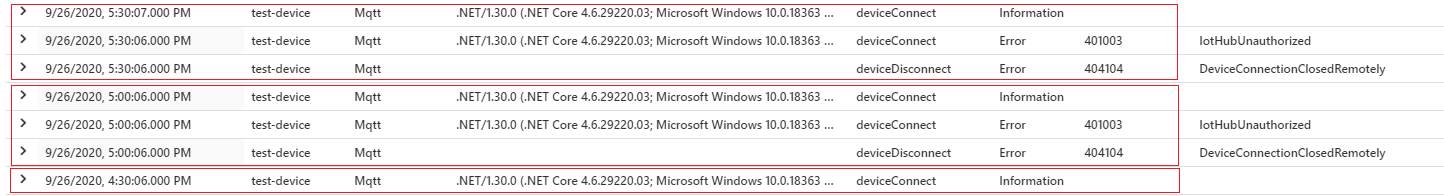
.NET device SDK with a 1200 second (20 minute) token lifespan and renewal set to happen at 90% of lifespan. disconnects happen every 30 minutes:
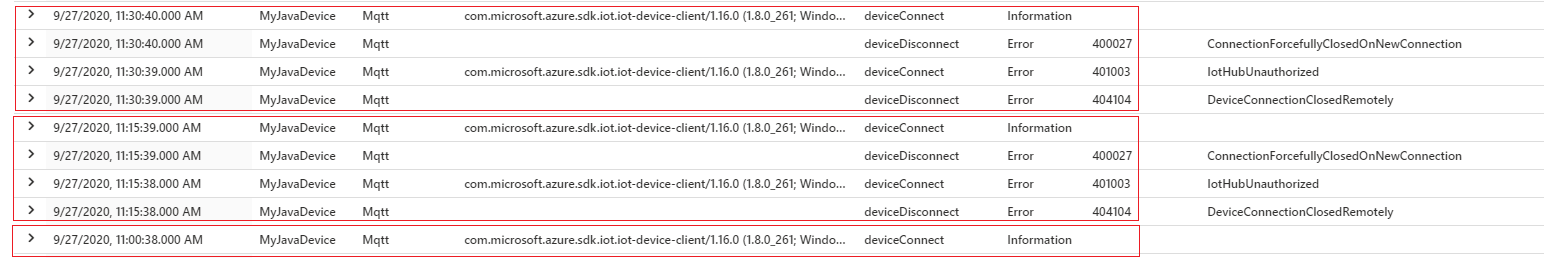
Java SDK with a 300 second (5 minute) token lifespan and default 85% of lifespan renewal. Disconnects happen every 15 minutes:
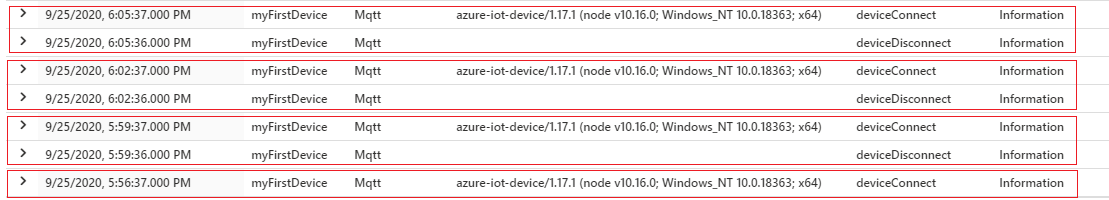
Node SDK with a 300 second (5 minute) token lifespan and token renewal set to happen at 3 minutes. Disconnects happen on token renewal. Also, there are no errors, only informational connect/disconnect events are emitted:
The following query was used to collect the results. The query extracts the SDK name and version from the property bag. To learn more, see SDK version in IoT Hub logs.
AzureDiagnostics
| where ResourceProvider == "MICROSOFT.DEVICES" and ResourceType == "IOTHUBS"
| where Category == "Connections"
| extend parsed_json = parse_json(properties_s)
| extend SDKVersion = tostring(parsed_json.sdkVersion) , DeviceId = tostring(parsed_json.deviceId) , Protocol =  tostring(parsed_json.protocol)
| distinct TimeGenerated, OperationName, Level, ResultType, ResultDescription, DeviceId, Protocol, SDKVersion
As an IoT solutions developer or operator, you need to be aware of this behavior in order to interpret connect/disconnect events and related errors in logs. If you want to change the token lifespan or renewal behavior for devices, check to see whether the device implements a device twin setting or a device method that makes this possible.
If you're monitoring device connections with Event Hubs, make sure you build in a way of filtering out the periodic disconnects due to SAS token renewal. For example, don't trigger actions based on disconnects as long as the disconnect event is followed by a connect event within a certain time span.
Note
IoT Hub only supports one active MQTT connection per device. Any new MQTT connection on behalf of the same device ID causes IoT Hub to drop the existing connection.
400027 ConnectionForcefullyClosedOnNewConnection will be logged into IoT Hub Logs
I tried the steps, but they didn't work
If the previous steps didn't help, try:
If you have access to the problematic devices, either physically or remotely (like SSH), follow the device-side troubleshooting guide to continue troubleshooting.
Verify that your devices are Enabled in the Azure portal > your IoT hub > IoT devices.
If your device uses MQTT protocol, verify that port 8883 is open. For more information, see Connecting to IoT Hub (MQTT).
Get help from Microsoft Q&A question page for Azure IoT Hub, Stack Overflow, or Azure support.
Next steps
To learn more about resolving transient issues, see Transient fault handling.
To learn more about the Azure IoT device SDKs and managing retries, see Retry patterns.
Feedback
Coming soon: Throughout 2024 we will be phasing out GitHub Issues as the feedback mechanism for content and replacing it with a new feedback system. For more information see: https://aka.ms/ContentUserFeedback.
Submit and view feedback for