Note
Access to this page requires authorization. You can try signing in or changing directories.
Access to this page requires authorization. You can try changing directories.
Important
Azure Lab Services will be retired on June 28, 2027. For more information, see the retirement guide. To simplify your migration, Microsoft has published automation scripts to help you clean up Lab Services resources, these are available in the Azure Lab Services Retirement Scripts GitHub repository.
This article describes the dashboard view of a lab in Azure Lab Services.
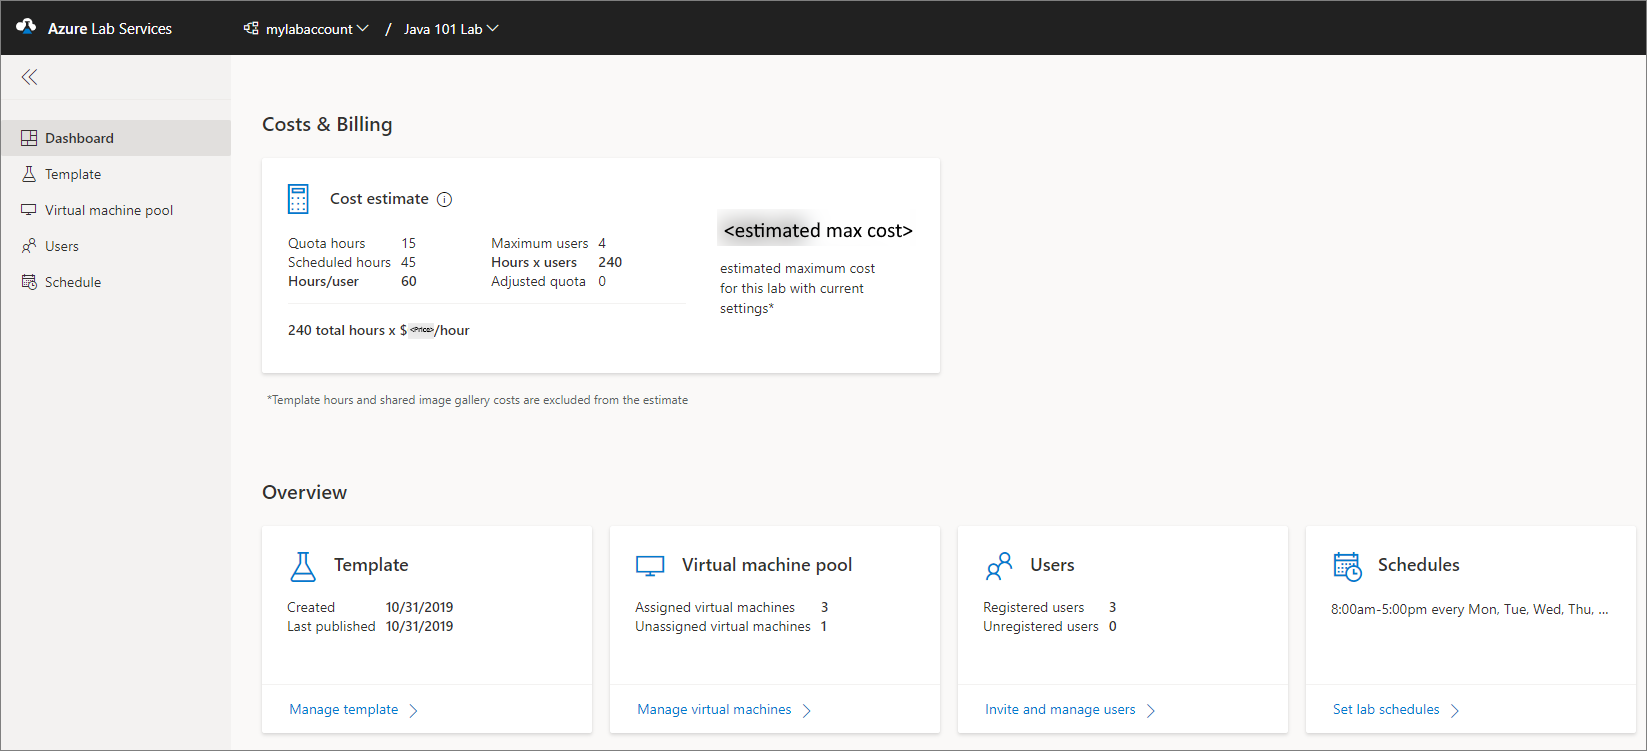
Costs and billing tile
This tile provides the following cost estimate details:
| Setting | Value |
|---|---|
| Quota hours | The maximum number of hours a user can use the VM outside the scheduled hours. |
| Scheduled hours | Hours that will be incurred based on the schedule set in the lab. This value is only available if there is a from/to date set on all the schedule events. |
| Hours/user | The sum of quota hours and scheduled hours. |
| Maximum users | Maximum number of users in the lab based on all virtual machines to be claimed. |
| Hours x users | Hours/user multiplied by the number of users. |
| Adjusted quota | The sum of the quota hours added to specific users. |
| Total hours * $/hour | The cost per hour based on the VM size selected. This is based on the regular pay as you go price. |
| Total estimated cost | This is the maximum price for this lab based on current settings. |
Template tile
You see the following information on this tile:
- The date on which the template was created
- The date on which the template was last published
It also has a link to navigate to the Template page where you can manage the template VM for the class.
Virtual machine pool tile
You see the following information on this tile:
- Number of virtual machines that are assigned to students (users)
- Number of virtual machines that haven't been assigned to students yet
It also has a link to navigate to the Virtual machine pool page where you can manage the pool of virtual machines in the lab.
Users tile
You see the following information on this tile:
- Number of users registered to the class
- Number of users who are added to the lab but not registered to the class
It also has a link to navigate to the Users page where you can manage users for the lab.
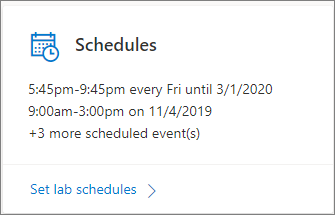
Schedules tile
You see the current scheduled events for the lab on the tile. It also has a link to navigate to the Schedule page where you can create and manage schedules. The tile shows you details for only two scheduled events and the number of remaining scheduled events for the lab.