Note
Access to this page requires authorization. You can try signing in or changing directories.
Access to this page requires authorization. You can try changing directories.
Azure Load Balancer exposes the following diagnostic capabilities:
Multi-dimensional metrics and alerts: Provides multi-dimensional diagnostic capabilities through Azure Monitor for Azure Load Balancer configurations. You can monitor, manage, and troubleshoot your standard load balancer resources.
Resource health: The Resource Health status of your load balancer is available in the Resource health page under Monitor. This automatic check informs you of the current availability of your load balancer resource.
This article provides a quick tour of these capabilities, and it offers ways to use them for a standard load balancer.
Multi-dimensional metrics
Azure Load Balancer provides multi-dimensional metrics via the Azure Metrics in the Azure portal, and it helps you get real-time diagnostic insights into your load balancer resources. Please note that multi-dimensional metrics are not supported for Basic Load Balancers
The various load balancer configurations provide the following metrics:
| Metric | Resource type | Description | Recommended aggregation |
|---|---|---|---|
| Data Path Availability | Public and internal load balancer | A load balancer continuously uses the data path from within a region to the load balancer frontend, to the network that supports your VM. As long as healthy instances remain, the measurement follows the same path as your application's load-balanced traffic. The data path in use is validated. The measurement is invisible to your application and doesn’t interfere with other operations. | Average |
| Health Probe Status | Public and internal load balancer | A load balancer uses a distributed health-probing service that monitors your application endpoint's health according to your configuration settings. This metric provides an aggregate or per-endpoint filtered view of each instance endpoint in the load balancer pool. You can see how load balancer views the health of your application, as indicated by your health probe configuration. | Average |
| SYN Count | Public and internal load balancer | A load balancer doesn’t terminate Transmission Control Protocol (TCP) connections or interact with TCP or User Data-gram Packet (UDP) flows. Flows and their handshakes are always between the source and the VM instance. To better troubleshoot your TCP protocol scenarios, you can make use of SYN packets counters to understand how many TCP connection attempts are made. The metric reports the number of TCP SYN packets that were received. | Sum |
| Source Network Address Translation (SNAT) Connection Count | Public load balancer | A load balancer reports the number of outbound flows that are masqueraded to the Public IP address frontend. SNAT ports are an exhaustible resource. This metric can give an indication of how heavily your application is relying on SNAT for outbound originated flows. Counters for successful and failed outbound SNAT flows are reported. The counters can be used to troubleshoot and understand the health of your outbound flows. | Sum |
| Allocated SNAT Ports | Public load balancer | A load balancer reports the number of SNAT ports allocated per backend instance | Average. |
| Used SNAT Ports | Public load balancer | A load balancer reports the number of SNAT ports that are utilized per backend instance. | Average |
| Byte Count | Public and internal load balancer | A load balancer reports the data processed per front end. You may notice that the bytes aren’t distributed equally across the backend instances. This is expected as the Azure Load Balancer algorithm is based on flows | Sum |
| Packet Count | Public and internal load balancer | A load balancer reports the packets processed per front end. | Sum |
Note
Bandwidth-related metrics such as SYN packet, byte count, and packet count will not capture any traffic to an internal load balancer via a UDR (eg. from an NVA or firewall).
Max and min aggregations are not available for the SYN count, packet count, SNAT connection count, and byte count metrics. Count aggregation is not recommended for Data path availability and health probe status. Use average instead for best represented health data.
Note
Data Path Availability metric may take up to 10 minutes to appear in Azure Monitor metrics after a load balancer is created or updated.
View your load balancer metrics in the Azure portal
The Azure portal exposes the load balancer metrics via the Metrics page. This page is available on both the load balancer's resource page for a particular resource and the Azure Monitor page.
Note
Azure Load Balancer does not send health probes to deallocated virtual machines. When virtual machines are deallocated, the load balancer will stop reporting metrics for that instance. Metrics that are unavailable will appear as a dashed line in Portal, or display an error message indicating that metrics cannot be retrieved.
To view the metrics for your load balancer resources:
Go to the metrics page and do either of the following tasks:
On the load balancer's resource page, select the metric type in the drop-down list.
On the Azure Monitor page, select the load balancer resource.
Set the appropriate metric aggregation type.
Optionally, configure the required filtering and grouping.
Optionally, configure the time range and aggregation. By default time is displayed in UTC.
Note
Time aggregation is important when interpreting certain metrics as data is sampled once per minute. If time aggregation is set to five minutes and metric aggregation type Sum is used for metrics such as SNAT allocation, your graph will display five times the total allocated SNAT ports.
Recommendation: When analyzing metric aggregation type Sum and Count, we recommend using a time aggregation value that is greater than one minute.
Retrieve multi-dimensional metrics programmatically via APIs
For API guidance for retrieving multi-dimensional metric definitions and values, see Azure Monitoring REST API walkthrough. These metrics can be written to a storage account by adding a diagnostic setting for the 'All Metrics' category.
Common diagnostic scenarios and recommended views
Is the data path up and available for my load balancer frontend?
Expand
The Data Path Availability metric describes the health within the region of the data path to the compute host where your VMs are located. The metric is a reflection of the health of your load balancer, based on your configuration and the Azure infrastructure. You can use the metric to:
Monitor the external availability of your service.
Investigate the platform where your service is deployed and determine if it's healthy. Determine if your guest OS or application instance is healthy.
Isolate whether an event is related to your service or the underlying data plane. Don’t confuse this metric with the Health Probe Status metric.
To get the Data Path Availability for your load balancer resources:
Make sure the correct load balancer resource is selected.
In the Metric drop-down list, select Data Path Availability.
In the Aggregation drop-down list, select Avg.
Additionally, add a filter on the frontend IP address or frontend port as the dimension with the required frontend IP address or frontend port. Then group them by the selected dimension.
The metric is generated by a probing service within the region that simulates traffic. The probing service periodically generates a packet that matches your deployment's frontend and load balancing rule. The packet then traverse the region from the source to the host of a VM in the backend pool. The load balancer infrastructure performs the same load balancing and translation operations as it does for all other traffic. After the probe arrives on the host, where a VM in the backend pool is located, the host generates a response to the probing service. Your VM doesn’t see this traffic.
Please note that the Data Path Availability metric will only be generated on frontend IP configurations with load balancing rules.
The Data Path Availability metric can be degraded for the following reasons:
Your deployment has no healthy VMs remaining in the backend pool.
An infrastructure outage has occurred.
For diagnostic purposes, you can use the Metric for data path availability together with the health probe status.
Use Average as the aggregation for most scenarios.
Are the backend instances for my load balancer responding to probes?
Expand
The Health Probe Status metric describes the health of your application deployment as configured by you when you configure the health probe of your load balancer. The load balancer uses the status of the health probe to determine where to send new flows. Health probes originate from an Azure infrastructure address and are visible within the guest OS of the VM.
To get the Health Probe Status metric for your load balancer resources:
Select the Health Probe Status metric with Avg aggregation type.
Apply a filter on the required frontend IP address or port (or both).
Health probes fail for the following reasons:
You configure a health probe to a port that isn’t listening or not responding or is using the wrong protocol. If your service is using direct server return or floating IP rules, verify the service is listening on the IP address of the NIC's IP configuration and the loopback that's configured with the frontend IP address.
Your Network Security Group, the VM's guest OS firewall, or the application layer filters don't allow the health probe traffic.
Use Average as the aggregation for most scenarios.
How do I check my outbound connection statistics?
Expand
The SNAT connections metric describes the volume of successful and failed connections for outbound flows.
A failed connections volume of greater than zero indicates SNAT port exhaustion. You must investigate further to determine what may be causing these failures. SNAT port exhaustion manifests as a failure to establish an outbound flow. Review the article about outbound connections to understand the scenarios and mechanisms at work, and to learn how to mitigate and design to avoid SNAT port exhaustion.
To get SNAT connection statistics:
Select SNAT Connections metric type and Sum as aggregation.
Group by Connection State for successful and failed SNAT connection counts to be represented by different lines.
How do I check my SNAT port usage and allocation?
Expand
The used SNAT ports metric tracks how many SNAT ports are being consumed to maintain outbound flows. This metric indicates how many unique flows are established between an internet source and a backend VM or virtual machine scale set that is behind a load balancer and doesn’t have a public IP address. By comparing the number of SNAT ports you’re using with the Allocated SNAT Ports metric, you can determine if your service is experiencing or at risk of SNAT exhaustion and resulting outbound flow failure.
If your metrics indicate risk of outbound flow failure, reference the article and take steps to mitigate this to ensure service health.
To view SNAT port usage and allocation:
Set the time aggregation of the graph to 1 minute to ensure desired data is displayed.
Select Used SNAT Ports and/or Allocated SNAT Ports as the metric type and Average as the aggregation.
By default, these metrics are the average number of SNAT ports allocated to or used by each backend VM or virtual machine scale set. They correspond to all frontend public IPs mapped to the load balancer, aggregated over TCP and UDP.
To view total SNAT ports used by or allocated for the load balancer use metric aggregation Sum.
Filter to a specific Protocol Type, a set of Backend IPs, and/or Frontend IPs.
To monitor health per backend or frontend instance, apply splitting.
- Note splitting only allows for a single metric to be displayed at a time.
For example, to monitor SNAT usage for TCP flows per machine, aggregate by Average, split by Backend IPs and filter by Protocol Type.
How do I check inbound/outbound connection attempts for my service?
Expand
A SYN packets metric describes the volume of TCP SYN packets, which have arrived or were sent for outbound flows that are associated with a specific front end. You can use this metric to understand TCP connection attempts to your service.For more information on outbound connections, see Source Network Address Translation (SNAT) for outbound connections
Use Sum as the aggregation for most scenarios.
How do I check my network bandwidth consumption?
Expand
The bytes and packet counters metric describes the volume of bytes and packets that are sent or received by your service on a per-frontend basis.
Use Sum as the aggregation for most scenarios.
To get byte or packet count statistics:
Select the Bytes Count and/or Packet Count metric type, with Sum as the aggregation.
Do either of the following:
Apply a filter on a specific frontend IP, frontend port, backend IP, or backend port.
Get overall statistics for your load balancer resource without any filtering.
How do I diagnose my load balancer deployment?
Expand
By using a combination of the data path availability and health probe status metrics on a single chart, you can identify where to look for the problem and resolve the problem. You can gain assurance that Azure is working correctly and use this knowledge to conclusively determine that the configuration or application is the root cause.
You can use health probe metrics to understand how Azure views the health of your deployment as per the configuration you’ve provided. Looking at health probes is always a great first step in monitoring or determining a cause.
You can take it a step further and use data path availability metric to gain insight into how Azure views the health of the underlying data plane that's responsible for your specific deployment. When you combine both metrics, you can isolate where the fault might be, as illustrated in this example:
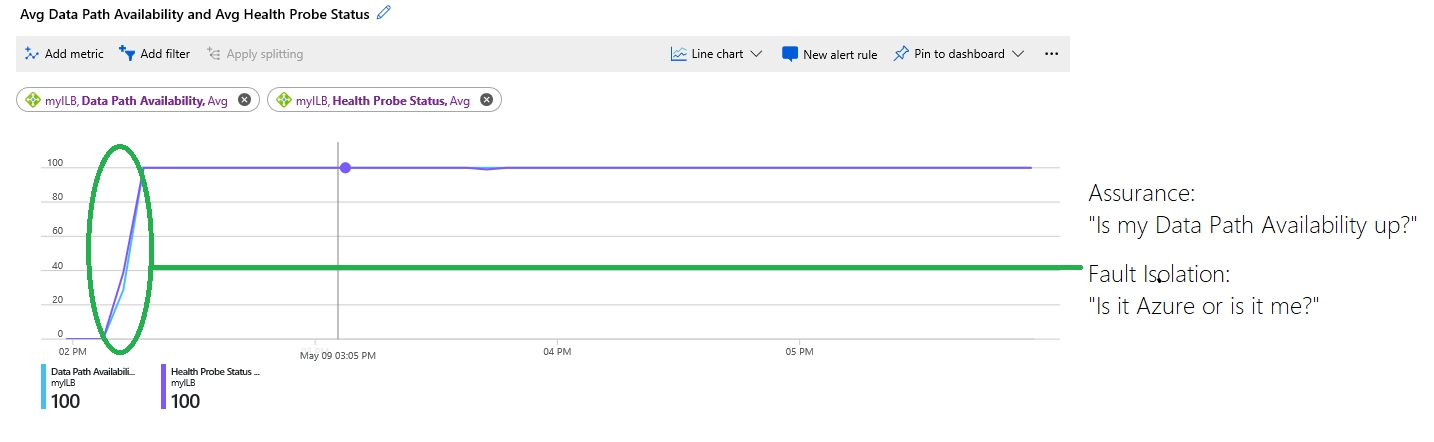
Figure: Combining data path availability and health probe status metrics
The chart displays the following information:
The infrastructure hosting your VMs was unavailable and at 0 percent at the beginning of the chart. Later, the infrastructure was healthy and the VMs were reachable, and more than one VM was placed in the back end. This information is indicated by the blue trace for data path availability, which was later at 100 percent.
The health probe status, indicated by the purple trace, is at 0 percent at the beginning of the chart. The circled area in green highlights where the health probe status became healthy, and at which point the customer's deployment was able to accept new flows.
The chart allows customers to troubleshoot the deployment on their own without having to guess or ask support whether other issues are occurring. The service was unavailable because health probes were failing due to either a misconfiguration or a failed application.
Configure alerts for multi-dimensional metrics
Azure Load Balancer supports easily configurable alerts for multi-dimensional metrics. Configure custom thresholds for specific metrics to trigger alerts with varying levels of severity to empower a no touch resource monitoring experience.
To configure alerts:
Go to the alert page for the load balancer
Create new alert rule
Configure alert condition (Note: to avoid noisy alerts, we recommend configuring alerts with the Aggregation type set to Average, looking back on a five-minute window of data, and with a threshold of 95%)
(Optional) Add action group for automated repair
Assign alert severity, name, and description that enables intuitive reaction
Inbound availability alerting
Note
If your load balancer's backend pools are empty, the load balancer will not have any valid data paths to test. As a result, the data path availability metric will not be available, and any configured Azure Alerts on the data path availability metric will not trigger.
To alert for inbound availability, you can create two separate alerts using the data path availability and health probe status metrics. Customers may have different scenarios that require specific alerting logic, but the below examples are helpful for most configurations.
Using data path availability, you can fire alerts whenever a specific load-balancing rule becomes unavailable. You can configure this alert by setting an alert condition for the data path availability and splitting by all current values and future values for both frontend port and frontend IP address. Setting the alert logic to be less than or equal to 0 will cause this alert to be fired whenever any load-balancing rule becomes unresponsive. Set the aggregation granularity and frequency of evaluation according to your desired evaluation.
With health probe status, you can alert when a given backend instance fails to respond to the health probe for a significant amount of time. Set up your alert condition to use the health probe status metric and split by backend IP address and backend port, using the Average aggregation type. This ensures that you can alert separately for each individual backend instance’s ability to serve traffic on a specific port.
Outbound availability alerting
For outbound availability, you can configure two separate alerts using the SNAT connection count and used SNAT port metrics.
To detect outbound connection failures, configure an alert using SNAT connection count and filtering to Connection State = Failed. Use the Total aggregation. Then, you can split this by backend IP address set to all current and future values to alert separately for each backend instance experiencing failed connections. Set the threshold to be greater than zero or a higher number if you expect to see some outbound connection failures.
With used SNAT ports, you can alert on a higher risk of SNAT exhaustion and outbound connection failure. Ensure you’re splitting by backend IP address and protocol when using this alert. Use the Average aggregation. Set the threshold to be greater than a percentage of the number of ports you’ve allocated per instance that you determine is unsafe. For example, configure a low severity alert when a backend instance uses 75% of its allocated ports. Configure a high severity alert when it uses 90% or 100% of its allocated ports.
Resource health status
Health status for the standard load balancer resources is exposed via the existing Resource health under Monitor > Service health. It’s evaluated every two minutes by measuring data path availability that determines whether your frontend load-balancing endpoints are available.
| Resource health status | Description |
|---|---|
| Available | Your standard load balancer resource is healthy and available. |
| Degraded | Your standard load balancer has platform or user initiated events impacting performance. The metric for data path availability has reported less than 90% but greater than 25% health for at least two minutes. With this status, you experience moderate to severe performance effect. See Support and troubleshooting for Azure Load Balancer to determine whether there are user initiated events impacting your availability. |
| Unavailable | Your standard load balancer resource isn’t healthy. The metric for data path availability has reported less the 25% health for at least two minutes. With this status, you experience significant performance effect or lack of availability for inbound connectivity. There may be user or platform events causing unavailability. See Support and troubleshooting for Azure Load Balancer to determine whether there are user initiated events impacting your availability. |
| Unknown | Health status for your load balancer resource hasn’t been updated or hasn’t received information for data path availability for the last 10 minutes. This state should be transient and will reflect correct status as soon as data is received. |
To view the health of your public standard load balancer resources:
Select Monitor > Service health.
Select Resource health, and then make sure that Subscription ID and Resource type = load balancer are selected.
In the list, select the load balancer resource to view its historical health status.
A generic description of a resource health status is available in the resource health documentation.
Resource health alerts
Azure Resource Health alerts can notify you in near real-time when the health state of your Load balancer resource changes. It's recommended that you set resource health alerts to notify you when your Load balancer resource is in a Degraded or Unavailable state.
When you create Azure resource health alerts for Load balancer, Azure sends resource health notifications to your Azure subscription. You can create and customize alerts based on:
- The subscription affected
- The resource group affected
- The resource type affected (Load balancer)
- The specific resource (any Load balancer resource you choose to set up an alert for)
- The event status of the Load balancer resource affected
- The current status of the Load balancer resource affected
- The previous status of the Load balancer resource affected
- The reason type of the Load balancer resource affected
You can also configure who the alert should be sent to:
- A new action group (that can be used for future alerts)
- An existing action group
For more information on how to set up these resource health alerts, see:
Next steps
- Learn about Network Analytics.
- Learn about using Insights to view these metrics preconfigured for your load balancer.
- Learn more about Standard load balancer.