Note
Access to this page requires authorization. You can try signing in or changing directories.
Access to this page requires authorization. You can try changing directories.
In this tutorial, you learn how to identify performance bottlenecks in a web application by using Azure Load Testing. You simulate load for a sample Node.js web application, and then use the load test dashboard to analyze client-side and server-side metrics.
The sample application consists of a Node.js web API, which interacts with a NoSQL database. You deploy the web API to Azure App Service web apps and use Azure Cosmos DB as the database.
In this tutorial, you learn how to:
- Deploy the sample app.
- Create and run a load test.
- Add Azure app components to the load test.
- Identify performance bottlenecks by using the load test dashboard.
Prerequisites
- An Azure account with an active subscription. If you don't have an Azure subscription, create a free account before you begin.
- The Azure CLI installed on your local computer.
- Azure CLI version 2.2.0 or later. Run
az --versionto find the version that is installed on your computer. If you need to install or upgrade the Azure CLI, see How to install the Azure CLI. - Visual Studio Code. If you don't have it, download and install it.
- Git. If you don't have it, download and install it.
Prerequisites check
Before you start, validate your environment:
Sign in to the Azure portal and check that your subscription is active.
Check your version of the Azure CLI in a terminal or command window by running
az --version. For the latest version, see the latest release notes.If you don't have the latest version, update your installation by following the installation guide for your operating system or platform.
Deploy the sample application
In this tutorial, you're generating load against a sample web application that you deploy to Azure App Service. Use Azure CLI commands, Git commands, and PowerShell commands to deploy the sample application in your Azure subscription.
Open Windows PowerShell, sign in to Azure, and set the subscription:
az login
az account set --subscription <your-Azure-Subscription-ID>
Clone the sample application's source repo:
git clone https://github.com/Azure-Samples/nodejs-appsvc-cosmosdb-bottleneck.gitThe sample application is a Node.js app that consists of an Azure App Service web component and an Azure Cosmos DB database. The repo includes a PowerShell script that deploys the sample app to your Azure subscription. It also has an Apache JMeter script that you'll use in later steps.
Go to the Node.js app's directory and deploy the sample app by using this PowerShell script:
cd nodejs-appsvc-cosmosdb-bottleneck .\deploymentscript.ps1At the prompt, provide:
- Your Azure subscription ID.
- A unique name for your web app.
- A location. By default, the location is
eastus. You can get region codes by running the Get-AzLocation command.
Important
For your web app's name, use only lowercase letters and numbers. Don't use spaces or special characters.
After deployment finishes, go to the running sample application by opening
https://<yourappname>.azurewebsites.netin a browser window.
Now that you have the sample application deployed and running, you can create an Azure load testing resource and a load test.
Create a load test
In this tutorial, you're creating a load test with the Azure CLI by uploading a JMeter test script (jmx file). The sample application repository already contains a load test configuration file and JMeter test script.
To create a load test by using the Azure portal, follow the steps in Quickstart: create a load test with a JMeter script.
Follow these steps to create an Azure load testing resource and a load test by using the Azure CLI:
Open a terminal window and enter the following command to sign in to your Azure subscription.
az loginGo to the sample application directory.
cd nodejs-appsvc-cosmosdb-bottleneckCreate a resource group for the Azure load testing resource.
Optionally, you can also reuse the resource group of the sample application you deployed previously.
Replace the
<load-testing-resource-group-name>text placeholder with the name of the resource group.resourceGroup="<load-testing-resource-group-name>" location="East US" az group create --name $resourceGroup --location $locationCreate an Azure load testing resource with the
az load createcommand.Replace the
<load-testing-resource-name>text placeholder with the name of the load testing resource.# This script requires the following Azure CLI extensions: # - load loadTestResource="<load-testing-resource-name>" az load create --name $loadTestResource --resource-group $resourceGroup --location $locationCreate a load test for simulating load against your sample application with the
az load test createcommand.Replace the
<web-app-hostname>text placeholder with the App Service hostname of the sample application. This value is of the formmyapp.azurewebsites.net. Don't include thehttps://part of the URL.testId="sample-app-test" webappHostname="<web-app-hostname>" az load test create --test-id $testId --load-test-resource $loadTestResource --resource-group $resourceGroup --load-test-config-file SampleApp.yaml --env webapp=$webappHostnameThis command uses the
Sampleapp.yamlload test configuration file, which references theSampleApp.jmxJMeter test script. You use a command-line parameter to pass the sample application hostname to the load test.
You now have an Azure load testing resource and a load test to generate load against the sample web application in your Azure subscription.
Add Azure app components to monitor the application
Azure Load Testing enables you to monitor resource metrics for the Azure components of your application. By analyzing these server-side metrics, you can identify performance and stability issues in your application directly from the Azure Load Testing dashboard.
In this tutorial, you add the Azure components for the sample application you deployed on Azure, such as the app service, Cosmos DB account, and more.
To add the Azure app components for the sample application to your load test:
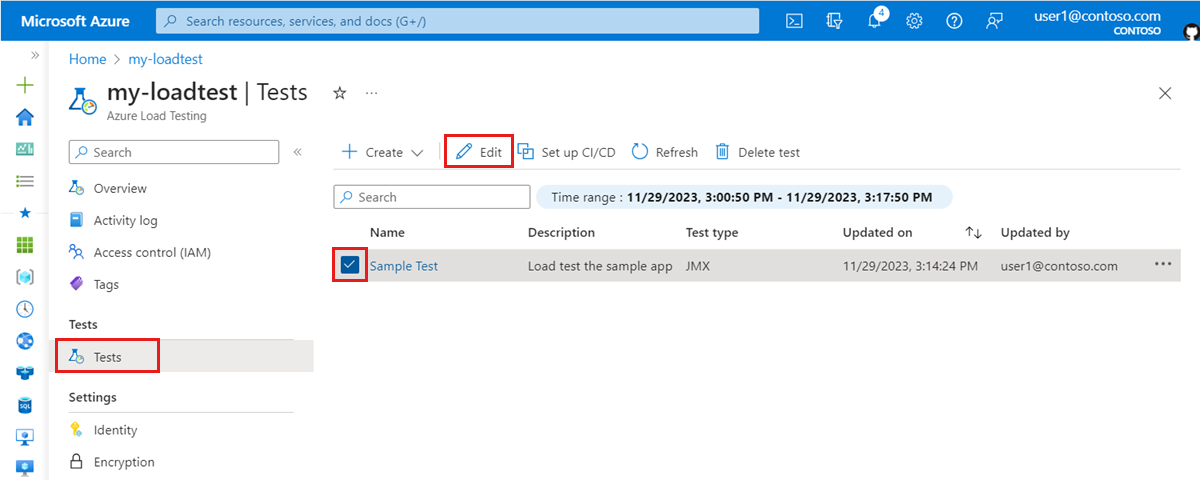
In the Azure portal, go to your Azure load testing resource.
On the left pane, select Tests to view the list of load tests
Select the checkbox next to your load test, and then select Edit.
Go to the Monitoring tab, and then select Add/Modify.
Select the checkboxes for the sample application you deployed previously, and then select Apply.
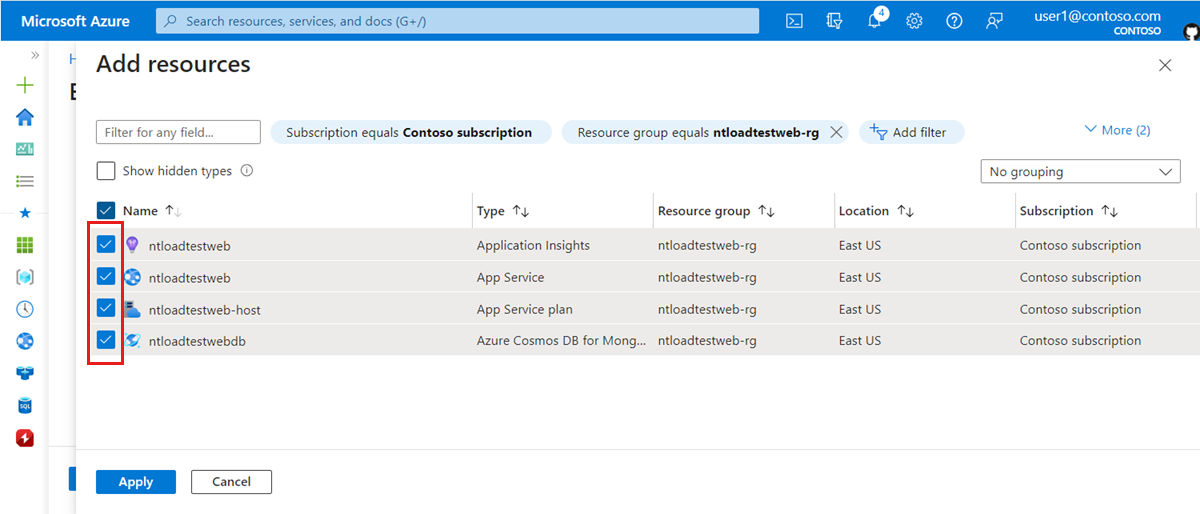
Tip
You can use the resource group filter to only view the Azure resources in the sample application resource group.
Select Apply to save the changes to the load test configuration.


You successfully added the Azure app components for the sample application to your load test to enable monitoring server-side metrics while the load test is running.
Run the load test
You can now run the load test to simulate load against the sample application you deployed in your Azure subscription. In this tutorial, you run the load test from within the Azure portal. Alternately, you can configure your CI/CD workflow to run your load test.
To run your load test in the Azure portal:
In the Azure portal, go to your Azure load testing resource.
On the left pane, select Tests to view the list of load tests
Select the load test from the list to view the test details and list of test runs.
Select Run, and then Run again to start the load test.
Optionally, you can enter a test run description.
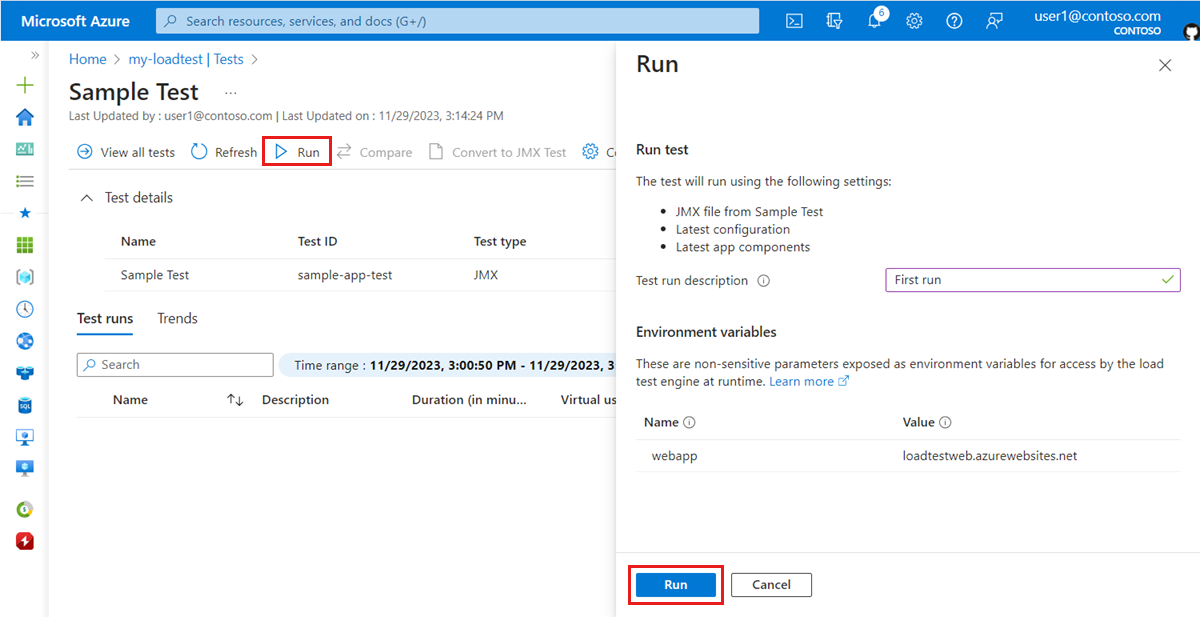
When you run a load test, Azure Load Testing deploys the JMeter test script and any extra files to the test engine instance(s), and then starts the load test.
When the load test starts, you should see the load test dashboard.
If the dashboard doesn't show, you can select Refresh on then select the test run from the list.
The load test dashboard presents the test run details, such as the client-side metrics and server-side application metrics. The graphs on the dashboard refresh automatically.
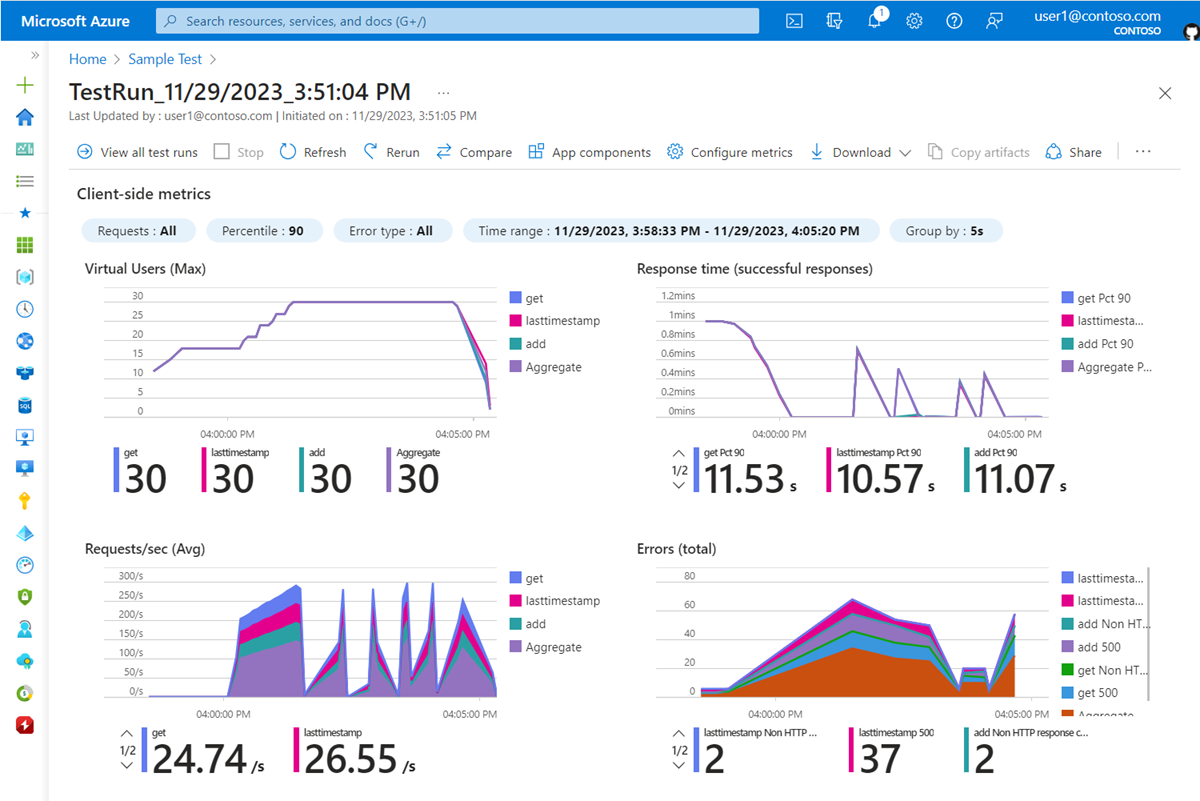
You can apply multiple filters or aggregate the results to different percentiles to customize the charts.
Tip
You can stop a load test at any time from the Azure portal by selecting Stop.


Wait until the load test finishes fully before you proceed to the next section.
Use server-side metrics to identify performance bottlenecks
In this section, you analyze the results of the load test to identify performance bottlenecks in the application. Examine both the client-side and server-side metrics to determine the root cause of the problem.
First, look at the client-side metrics. You notice that the 90th percentile for the Response time metric for the
addandgetAPI requests is higher than it is for thelasttimestampAPI.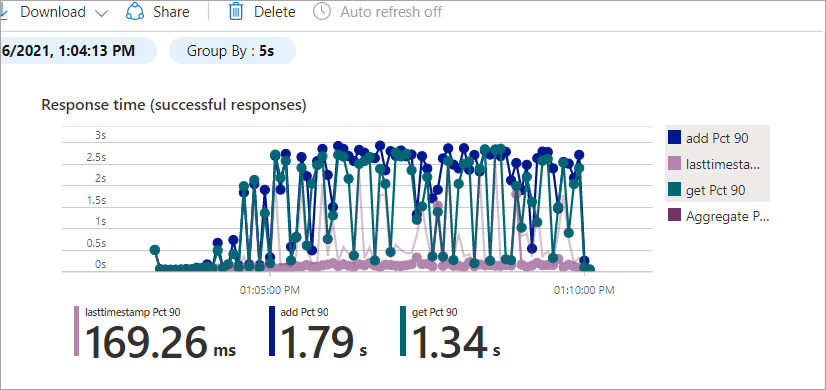
You can see a similar pattern for Errors, where the
lasttimestampAPI has fewer errors than the other APIs.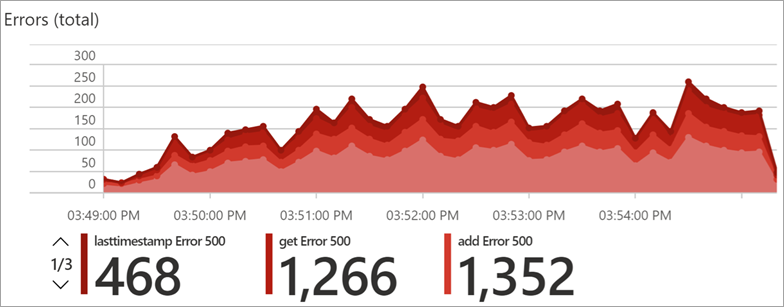
The results of the
addandgetAPIs are similar, whereas thelasttimestampAPI behaves differently. The cause might be database related, because both theaddandgetAPIs involve database access.To investigate this bottleneck in more detail, scroll down to the Server-side metrics dashboard section.
The server-side metrics show detailed information about your Azure application components: Azure App Service plan, Azure App Service web app, and Azure Cosmos DB.
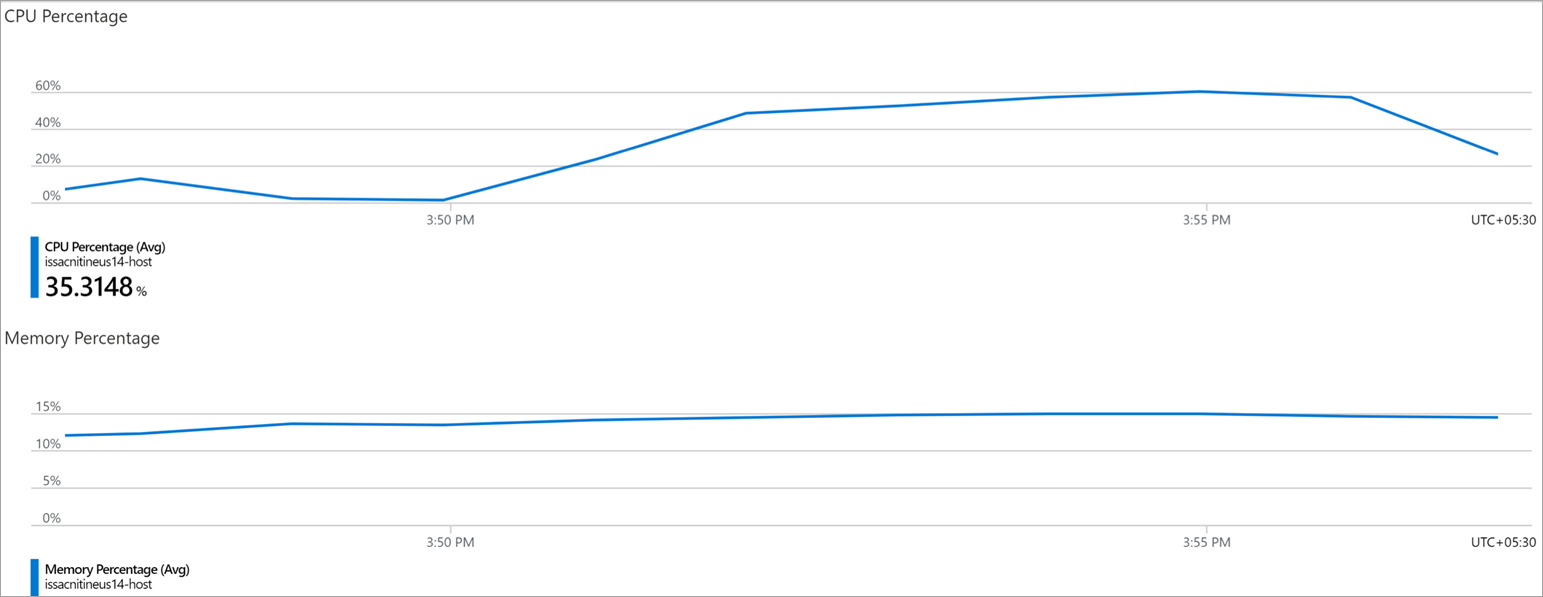
In the metrics for the Azure App Service plan, you can see that the CPU Percentage and Memory Percentage metrics are within an acceptable range.
Now, look at the Azure Cosmos DB server-side metrics.
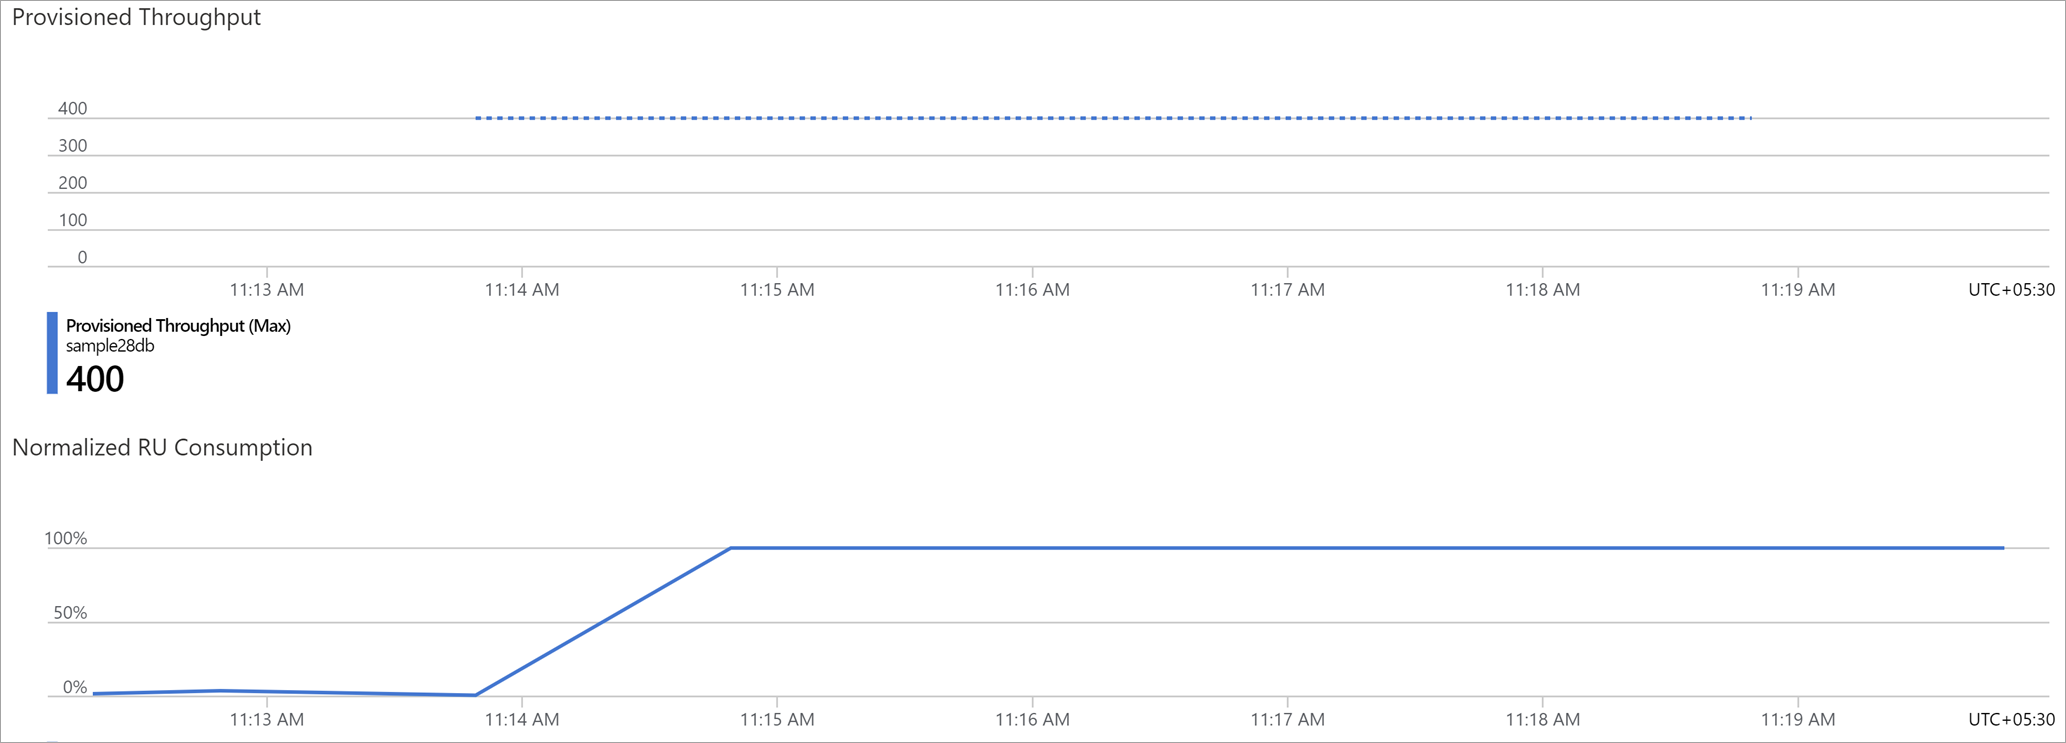
Notice that the Normalized RU Consumption metric shows that the database was quickly running at 100% resource utilization. The high resource usage might cause database throttling errors. It also might increase response times for the
addandgetweb APIs.You can also see that the Provisioned Throughput metric for the Azure Cosmos DB instance has a maximum throughput of 400 RUs. Increasing the provisioned throughput of the database might resolve the performance problem.
Increase the database throughput
In this section, you allocate more resources to the database to resolve the performance bottleneck.
For Azure Cosmos DB, increase the database RU scale setting:
Go to the Azure Cosmos DB resource that you provisioned as part of the sample application deployment.
Select the Data Explorer tab.
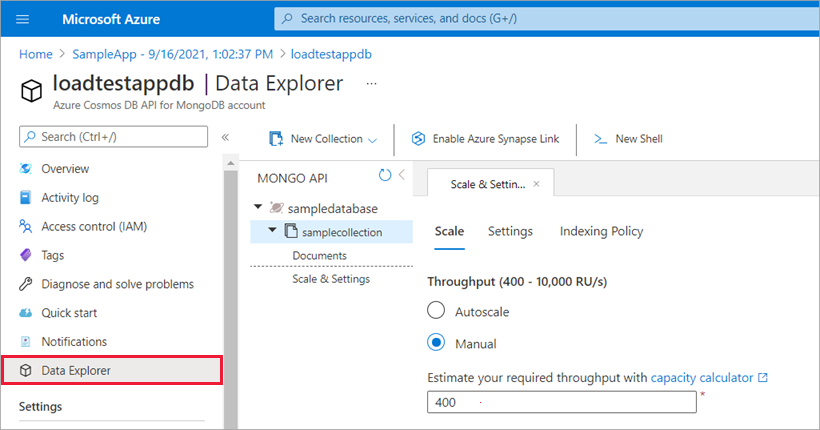
Select Scale & Settings, and update the throughput value to 1200.
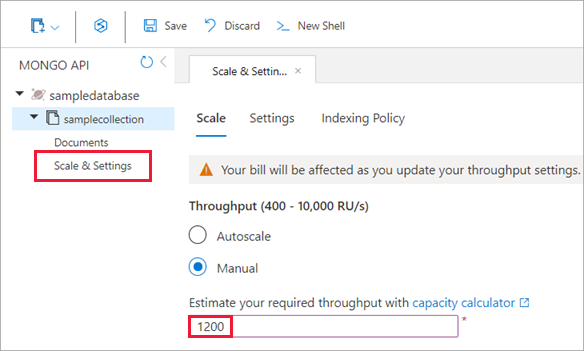
Select Save to confirm the changes.
Validate the performance improvements
Now that you increased the database throughput, rerun the load test and verify that the performance results improved:
On the test run dashboard, select Rerun, and then select Rerun on the Rerun test pane.
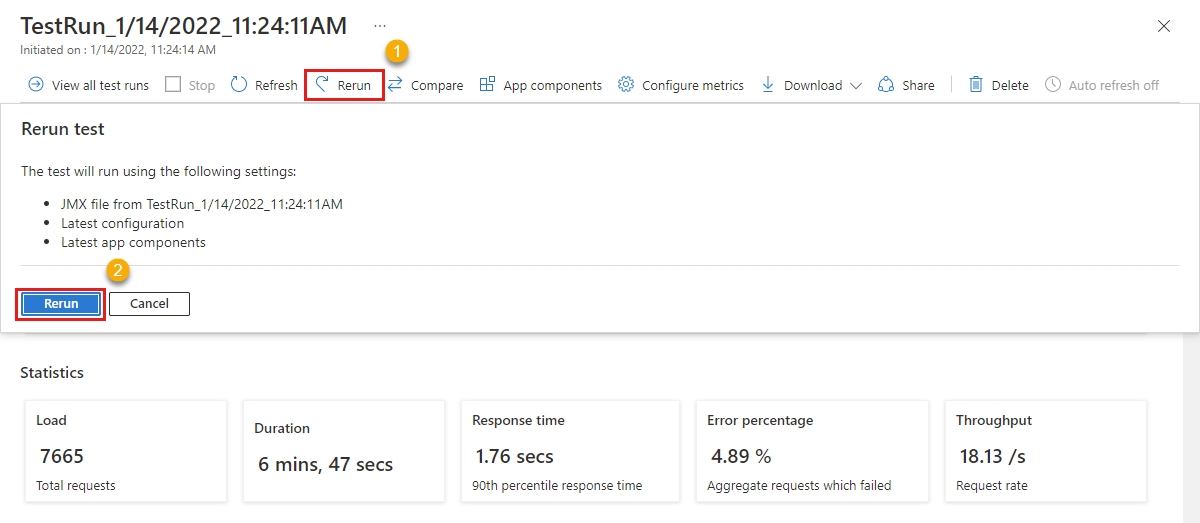
You can see a new test run entry with a status column that cycles through the Provisioning, Executing, and Done states. At any time, select the test run to monitor how the load test is progressing.
After the load test finishes, check the Response time results and the Errors results of the client-side metrics.
Check the server-side metrics for Azure Cosmos DB and ensure that the performance improved.

The Azure Cosmos DB Normalized RU Consumption value is now well below 100%.
Now that you updated the scale settings of the database, you can see that:
- The response time for the
addandgetAPIs improved. - The normalized RU consumption remains well under the limit.
As a result, the overall performance of your application improved.
Clean up resources
Important
You can reuse the Azure Load Testing resource that you created for other Azure Load Testing tutorials and how-to articles.
If you don't plan to use any of the resources that you created, delete them so you don't incur any further charges. If you've deployed the sample application in a different resource group, you might want to repeat the following steps.
To delete resources by using the Azure portal:
Select the menu button in the upper-left corner, and then select Resource groups.
From the list, select the resource group that you created.
Select Delete resource group.

Enter the resource group name. Then select Delete.
To delete resources by using the Azure CLI, enter the following command:
az group delete --name <yourresourcegroup>
Remember, deleting the resource group deletes all of the resources within it.
Related content
- Get more details about how to diagnose failing tests
- Monitor server-side metrics to identify performance bottlenecks in your application
- Define load test fail criteria to validate test results against your service requirements
- Learn more about the key concepts for Azure Load Testing.