Applies to: Azure Logic Apps (Consumption + Standard)
If you don't have visibility into workflow execution health, and your workflows integrate multiple services and run at scale, you can have a difficult time when you have to find and troubleshoot unexpected failures, slow triggers, or high action error rates. Azure Logic Apps exposes workflow performance data through Azure Monitor Metrics so you get real-time and historical views of workflow runs, triggers, actions, and job execution timing.
This guide shows how to find the health and performance metrics for your Consumption or Standard logic app workflows, identify the metrics that matter to your scenario, and apply filters to narrow the results to a specific workflow or status. This information helps you quickly identify and diagnose issues before they negatively affect your integrations.
For the full list of available metrics, see Supported metrics with Azure Monitor.
Prerequisites
Find and view metrics
To view the metrics for Consumption logic app workflows, follow these steps:
In the Azure portal, open your Consumption logic app.
On the logic app sidebar, under Monitoring, select Metrics.
The Metrics page opens and shows the following lists: Scope, Metric Namespace, Metric, and Aggregation.
Confirm that Scope is set to your logic app name and Metric Namespace is set to Logic app standard metrics.
Open the Metric list to view the available metrics for your workflow.
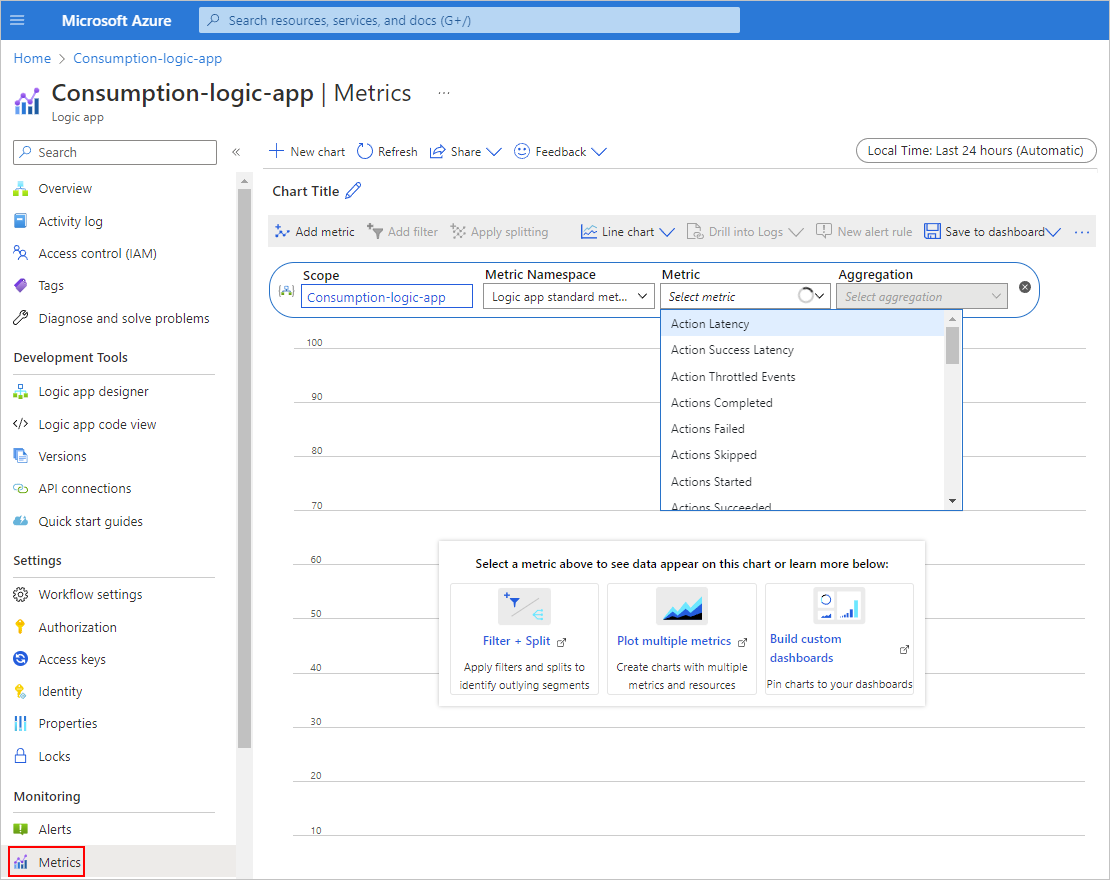
From the Metric list, select the metric to review.
For the full metrics list, see Supported metrics for Microsoft.Logic/Workflows.
From the Aggregation list, select the option to group the metric's values: Count, Avg, Min, Max, or Sum.
To view the metrics for Standard logic app workflows, follow these steps:
In the Azure portal, open your Standard logic app.
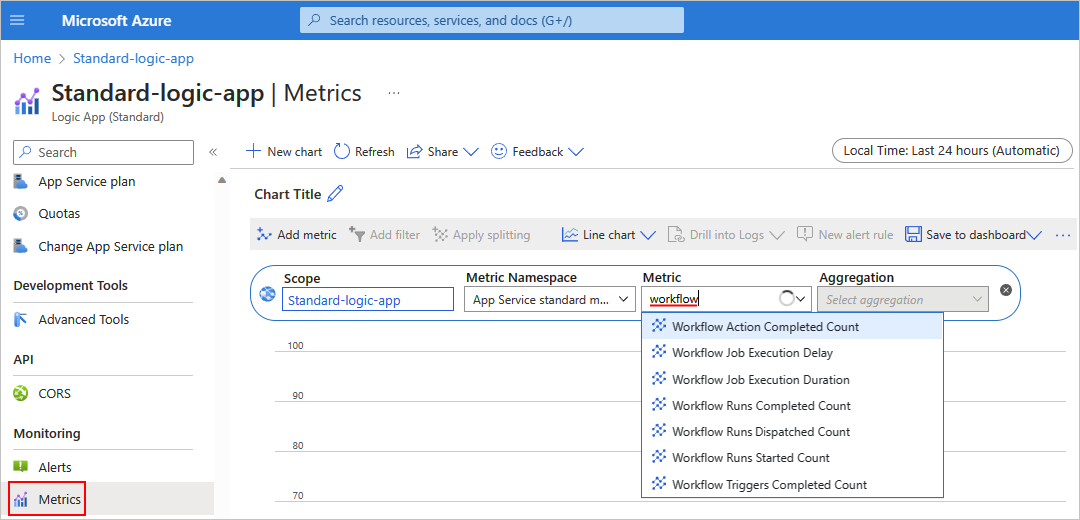
On the logic app sidebar, under Monitoring, select Metrics.
The Metrics page opens and shows the following lists: Scope, Metric Namespace, Metric, and Aggregation.
Confirm that Scope is set to your logic app name and Metric Namespace is set to App Service standard metrics.
In the Metric search box, enter workflow to view the metrics that start with Workflow.
The filtered list shows the metrics for your workflow:
| Metric name |
Description |
| Workflow Action Completed Count |
The number of completed actions, regardless of status. |
| Workflow Actions Failure Rate |
The rate of failed actions. |
| Workflow Job Execution Delay |
The amount of time between when a job was scheduled to run and when the job actually ran. |
| Workflow Job Execution Duration |
The amount of time that a job took to complete execution. |
| Workflow Runs Completed Count |
The number of completed workflow executions, regardless of status. |
| Workflow Runs Dispatched Count |
The number of previously queued requests that are now processed. |
| Workflow Runs Failure Rate |
The number of failed workflow runs. |
| Workflow Runs Started Count |
The number of started workflows, regardless of outcome status. |
| Workflow Triggers Completed Count |
The number of completed triggers, regardless of outcome. |
| Workflow Triggers Failure Rate |
The rate of failed triggers. |
Note
For information about non-workflow related metrics, such as Azure App Service metrics for Standard workflows, see Azure App Service - Metrics.
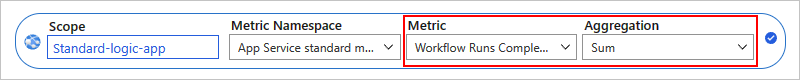
From the Metric list, select the metric to review.
From the Aggregation list, select the option to group the metric's values: Count, Avg, Min, Max, or Sum.
Filter by workflow
If your Standard logic app has multiple workflows running, you can filter the results by workflow:
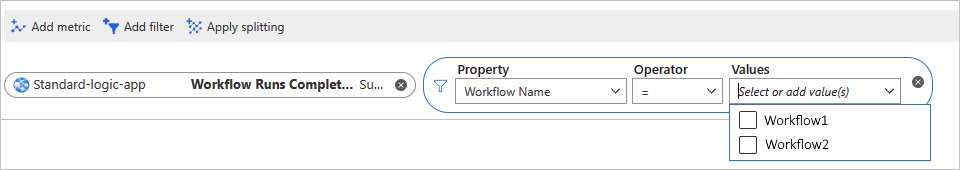
Under the Metrics toolbar, select Add filter.
From the Property list, select Workflow Name.
From the Values list, select the workflow to filter.
Filter by workflow status
Under the Metrics toolbar, select Add filter.
From the Property list, select Status.
From the Values list, select the status to filter.
Example
This example for a Standard logic app shows the number of workflow runs that have a specific status over the past 24 hours. Multiple workflows are running, so to filter the results, add a filter:
From the Metric list, select the metric named Workflow Runs Completed.
From the Aggregation list, select Sum.
On the Metrics toolbar, select Add filter.
From the Property list, select Workflow Name.
From the Values list, select the workflow.
Related content

