Note
Access to this page requires authorization. You can try signing in or changing directories.
Access to this page requires authorization. You can try changing directories.
In this article, we explain:
- What is reuse in Azure Machine Learning pipeline
- How does reuse works
- Step by step guidance to debug reuse issues
What is reuse in Azure Machine Learning pipeline?
Building models with Azure Machine Learning pipeline is an iterative process. As a data scientist, you can start with a basic pipeline and then experiment with different machine learning algorithms or do hyperparamter tuning to improve your model. During this process, you'll submit many pipeline jobs that may only have small changes compared to the previous job. With the reuse feature, the pipeline can automatically use the output from a previous job if it meets certain criteria, without running the component again. This can save you time and money while developing your pipeline.
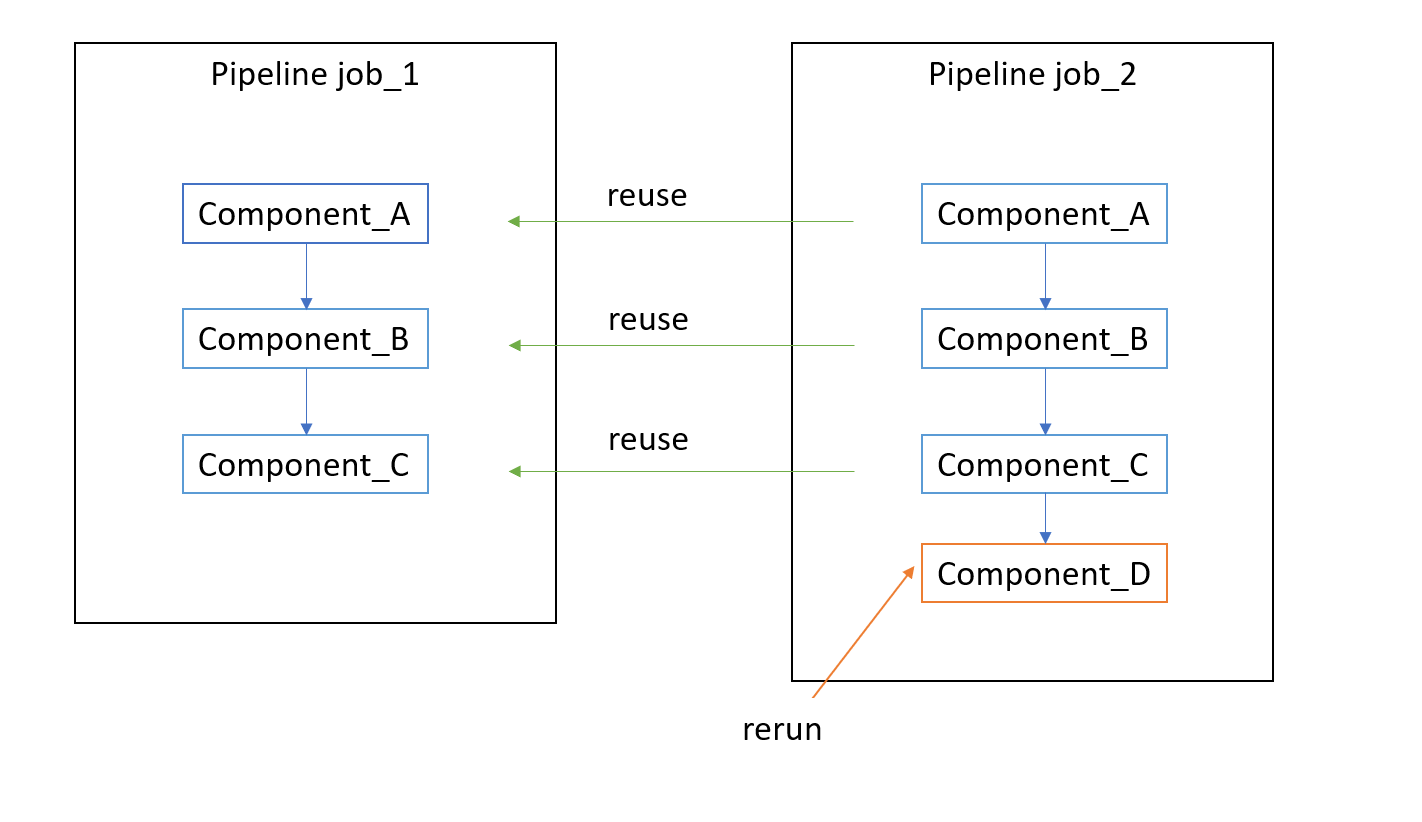
In the diagram, the data scientist first submits job_1, then adds Component_D to the pipeline and submits job_2. When executing pipeline job_2, the pipeline service detects the output for Component_A, Component_B and Component_C, which remain unchanged. So it doesn't run the first three components again. Instead it reuses the output from job_1 and only runs Component_D in job_2.
How does reuse work?
Azure Machine Learning pipeline has holistic logic to calculate whether a component's output can be reused. The next diagram explains the reuse criteria.
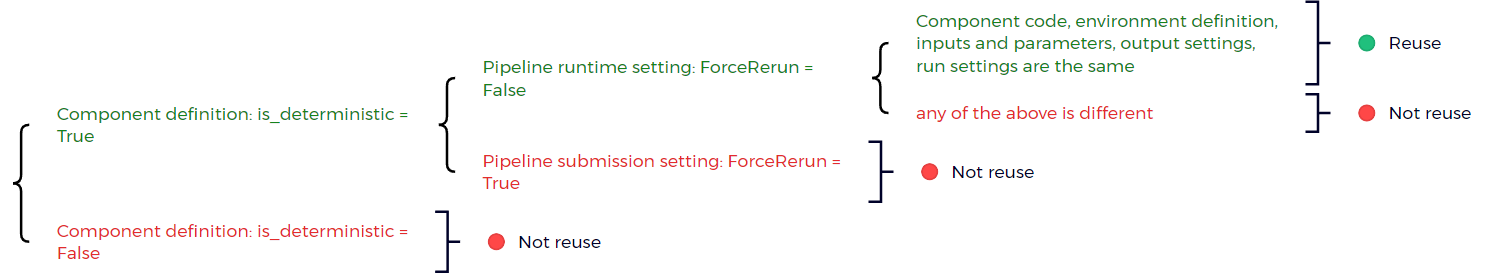
Reuse criteria:
- Component definition
is_deterministic= true - Pipeline runtime setting
ForceReRun= false - Component code, environment definition, inputs and parameters, output settings, and run settings are all the same.
If a component meets the reuse criteria, the pipeline service skips execution for the component, copies original component's status, displays original component's output/logs/metrics for the reused component. In the pipeline UI, the reused component shows a little recycle icon to indicate this component has been reused.
![]()
Steps to debug pipeline reuse issues
If reuse isn't working as expected in your pipeline, try the following steps to debug.
Step 1: Check if pipeline setting ForceRerun=True
If the pipeline setting ForceRerun is set to True, all child jobs of the pipeline rerun.
Note
All child jobs of the force rerun pipeline cannot be reused by other jobs. So make sure you check the ForceRerun value both for the job you expect to reuse and the original job you wish to reuse from.
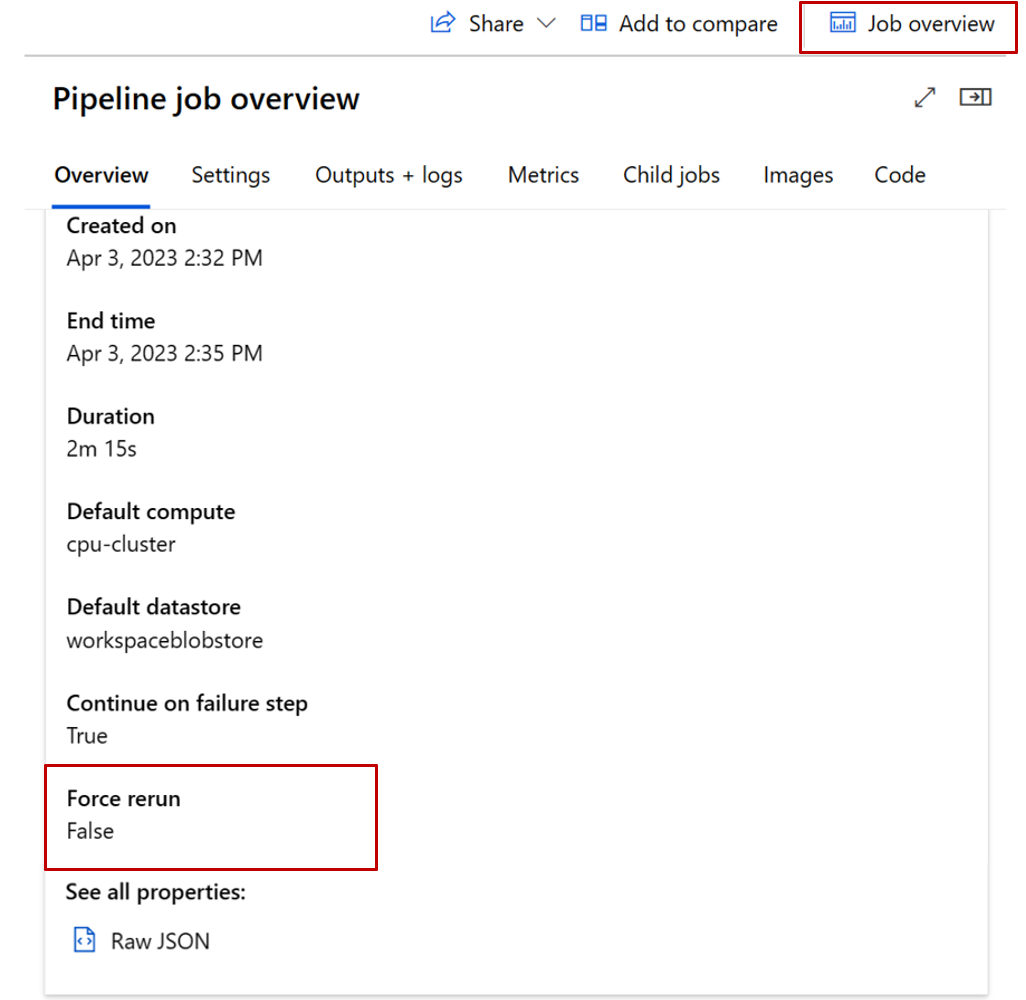
To check the ForceRerun setting in pipeline UI, go to pipeline job overview tab.
Step 2: Check if component definition is_deterministic = True
Right click on a component and select View definition.
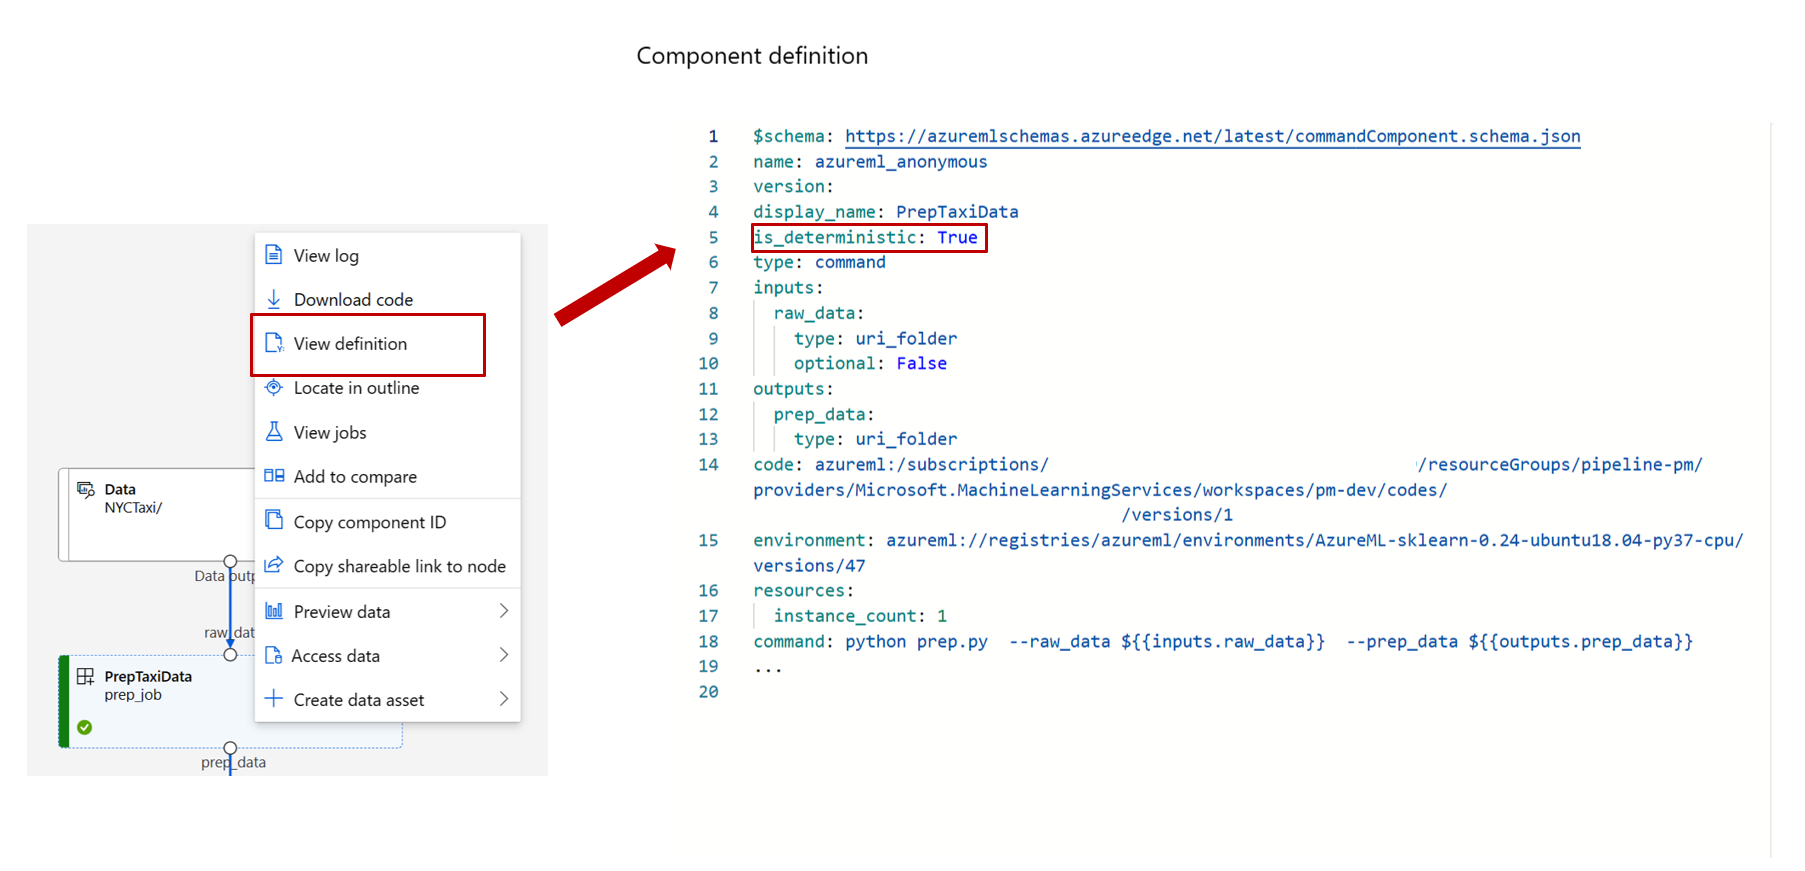
is_deterministic = True means this component produces the same output for the same input data. If it's set to False, the component always reruns.
Step 3: Check if there's any code change by comparing "ContentSnapshotId"
If you have two jobs, you expected the second job to reuse the first job, but it didn't. You can compare the component snapshot in the two jobs. If the snapshot ID changes, it means there's some component code content change, which leads to a rerun.
- Double click a component to open it's right panel
- Open Raw JSON under Overview tab
- Search for snapshot ID in the raw JSON

Step 4: Check if there's any environment change
If you're using inline environment, compare the environment definition in the component YAML. Your component YAML may not be uploaded to the Code tab. In such cases, you need to go to your component source code to check the environment definition for your component.

If you're using named environment, compare environment name and definition by going to the environments tab.

You can copy paste the env definition of the two jobs, then compare them using a local editor like VS Code or Notepad++.
The environment can also be compared in the graph comparison feature. We'll cover graph compare in next step.
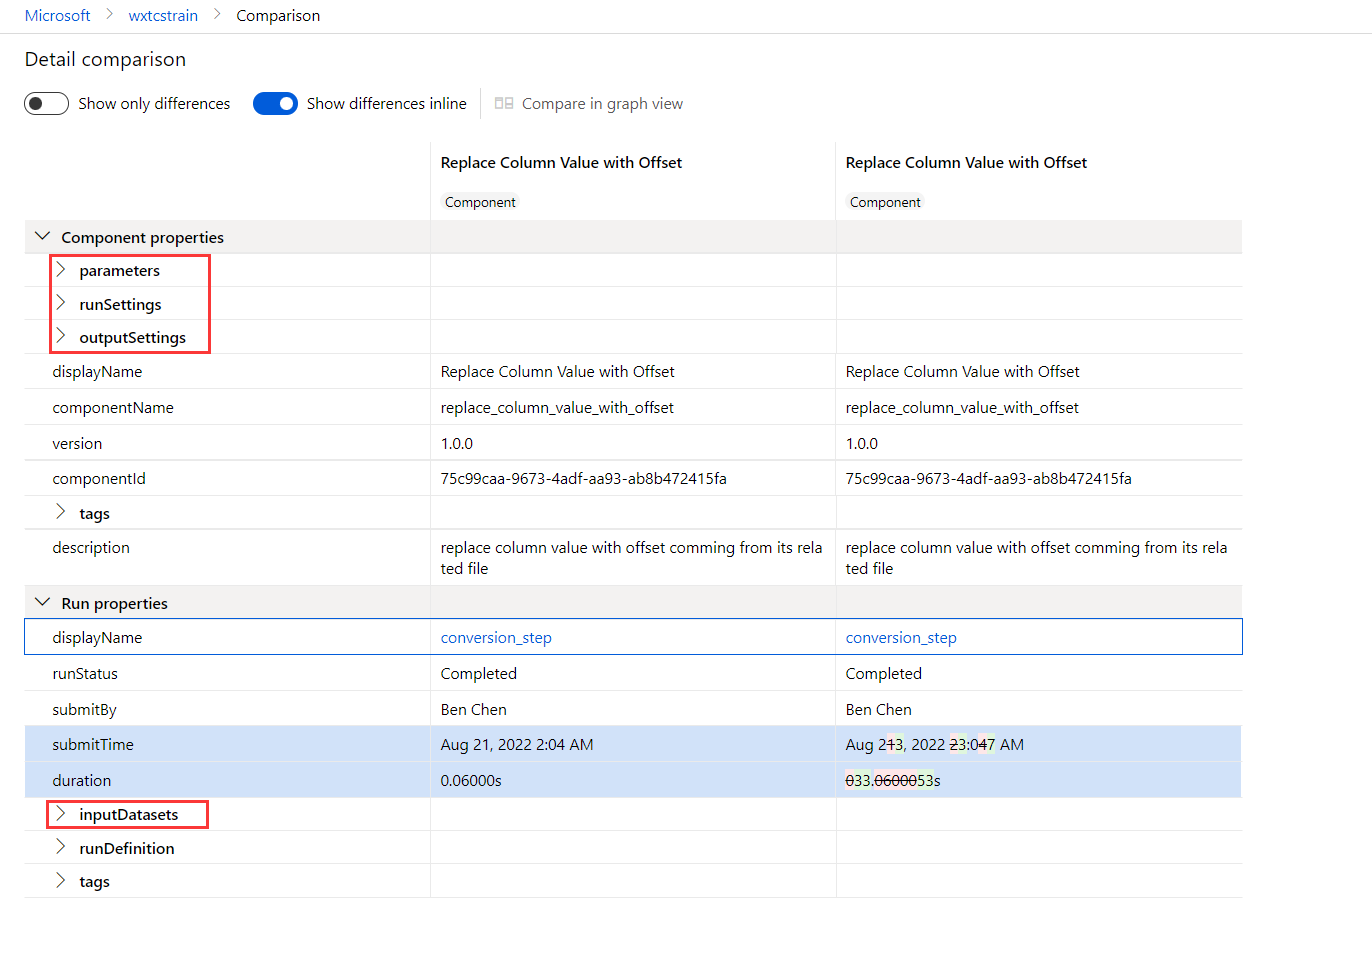
Step 5: Use graph comparison to check if there's any other change to the inputs, parameters, output settings, run settings
You can compare the input data, parameters, output settings, run settings of the two pipeline jobs or components using compare feature. To learn more, see how to enable and use the graph compare feature
To identify any changes in pipeline topology, pipeline input/output, or pipeline settings between two pipelines, select Compare graph after adding two pipeline jobs to the compare list.

Furthermore, you can compare two components to observe if there have been any changes in the component input/output, component setting or source code. To do this, select Compare details after adding two components to the compare list.
Step 6: Contact Microsoft for support
If you follow all above steps, and you still can't find the root cause of unexpected rerun, you can file a support case ticket to Microsoft to get help.