Note
Access to this page requires authorization. You can try signing in or changing directories.
Access to this page requires authorization. You can try changing directories.
Topology provides an interactive interface to view resources and their relationships in Azure across multiple subscriptions, regions, and resource groups. It helps you manage and monitor your cloud network infrastructure with interactive graphical interface that provides you with insights from Azure Network Watcher connection monitor and traffic analytics. Topology helps you diagnose and troubleshoot network issues by providing contextual access to Network Watcher diagnostic tools such as connection troubleshoot, packet capture, and next hop.
In this article, you learn how to use topology to visualize virtual networks and connected resources.
Note
Azure Resource Graph is used to draw resources topology. In case of any configuration changes, it might take up to 30 hours for the changes to reflect in Azure Resource Graph and then in topology.
Prerequisites
- An Azure account with an active subscription. Create an account for free.
- The necessary role-based access control (RBAC) permissions to use Azure Network Watcher capabilities.
Supported resource types
Topology supports the following resource types:
- Application Gateways
- Azure Bastion hosts
- Azure DDoS Protection plans
- Azure DNS zones
- Azure Firewalls
- Azure Front Door profiles
- Azure NAT Gateways
- Connections
- DNS Private Resolvers
- ExpressRoute circuits
- Load balancers
- Local network gateways
- Network interfaces
- Network security groups
- Private DNS zones
- Private endpoints
- Private Link services
- Public IP addresses
- Service endpoints
- Traffic Manager profiles
- Virtual hubs
- Virtual machine scale sets
- Virtual machines
- Virtual network gateways (VPN and ExpressRoute)
- Virtual networks
- Virtual WANs
- Web Application Firewall policies
Get started with topology
In this section, you learn how to view a region's topology and insights.
Sign in to the Azure portal.
In the search box at the top of the portal, enter network watcher. Select Network Watcher from the search results.

Under Monitoring, select Topology.
Note
You can also get to the topology from:
- Monitor: Insights > Networks > Topology.
- Virtual networks: Monitoring > Diagram.
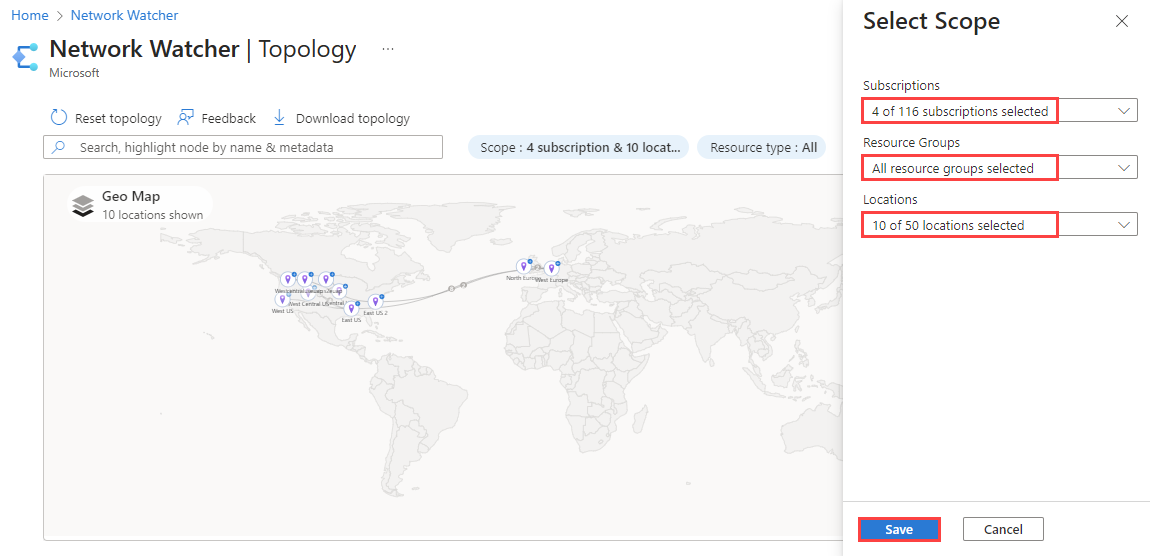
Select Scope to define the scope of the topology.
In the Select scope pane, select the list of Subscriptions, Resource groups, and Locations of the resources for which you want to view the topology, then select Save.
Select Resource type to choose the resource types that you want to include in the topology and select Apply. See supported resource types.
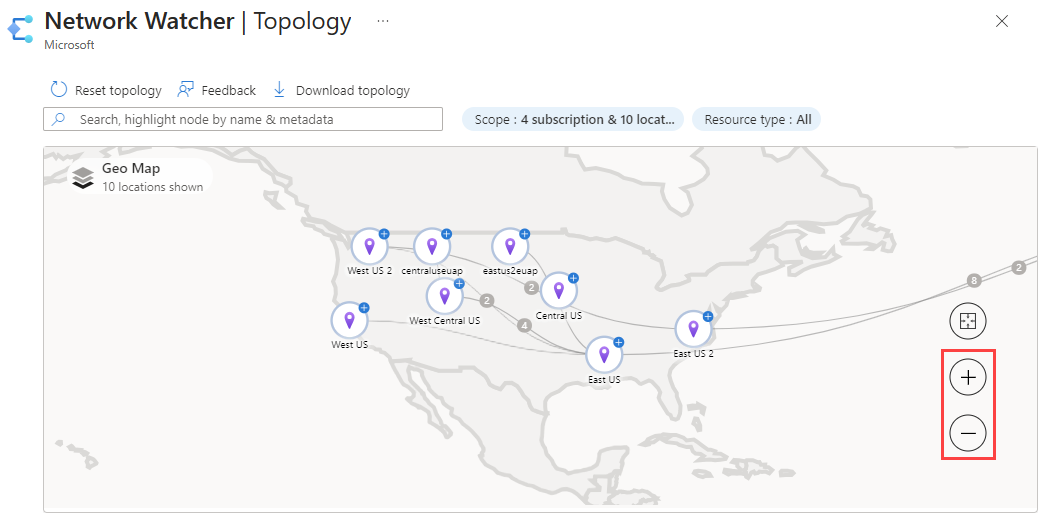
Use the mouse wheel to zoom in or out, or select the plus or minus sign. You can also use the mouse to drag the topology to move it around or use the arrows on the screen.
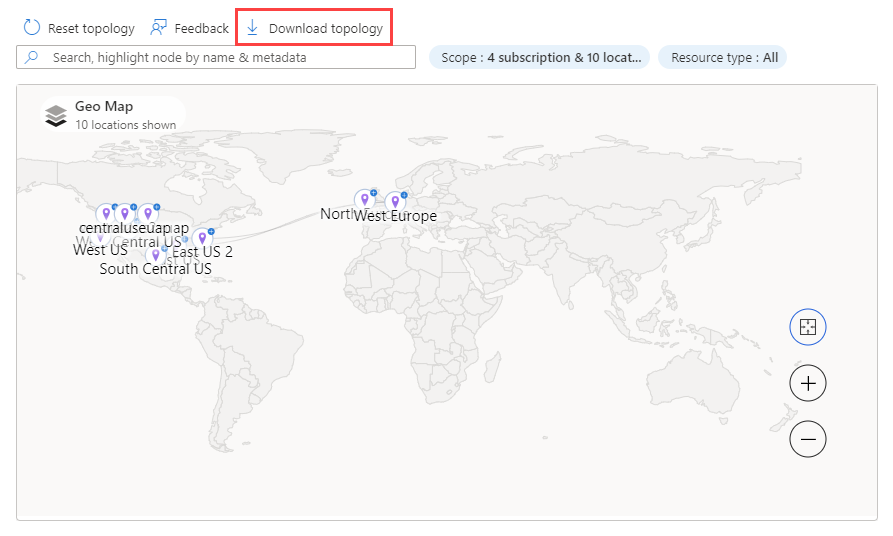
Select Download topology if you want to download the topology view to your computer. A file with the .svg extension is downloaded.
Select a region to see its information and insights. The Insights tab provides a snapshot of connectivity and traffic insights for the selected region.
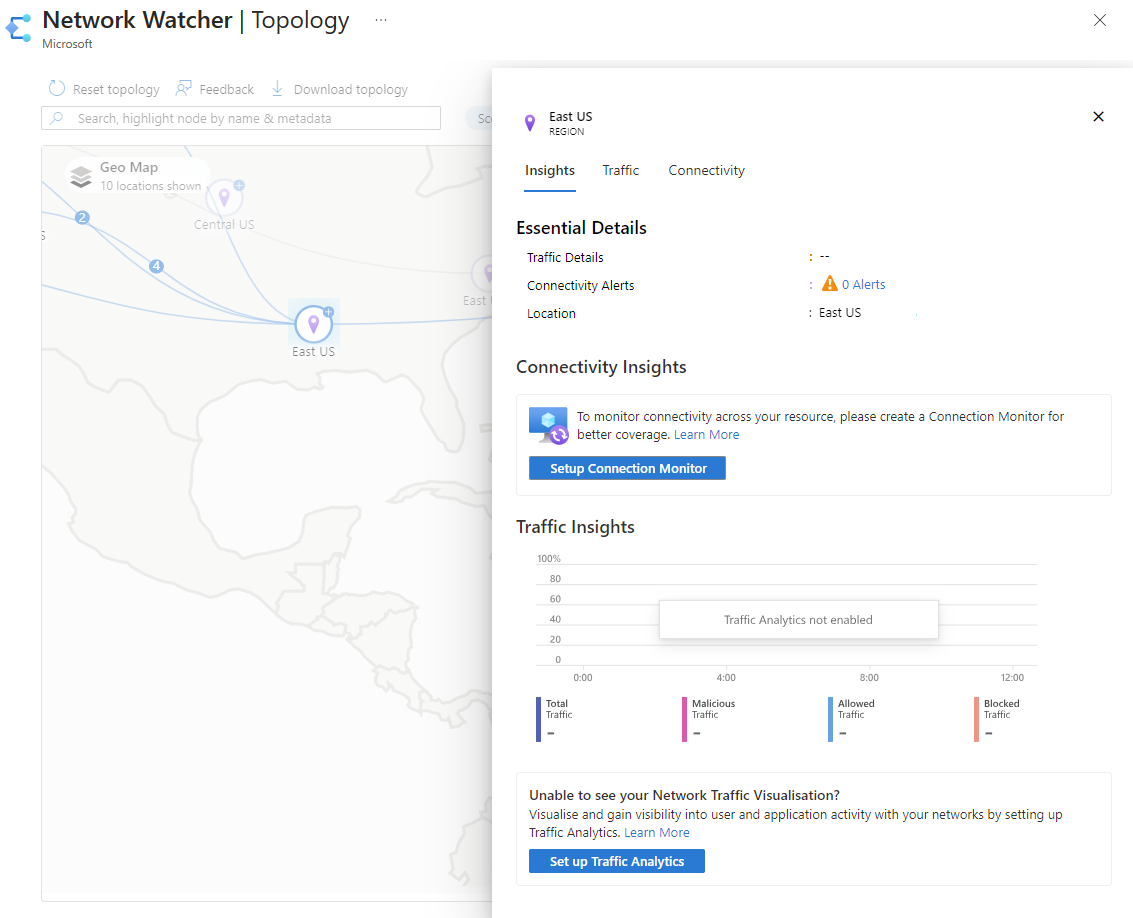
Note
- Connectivity insights are available when connection monitor is enabled. For more information, see connection monitor.
- Traffic insights are available when Flow logs and traffic analytics are enabled. For more information, see NSG flow logs, VNet flow logs and traffic analytics.
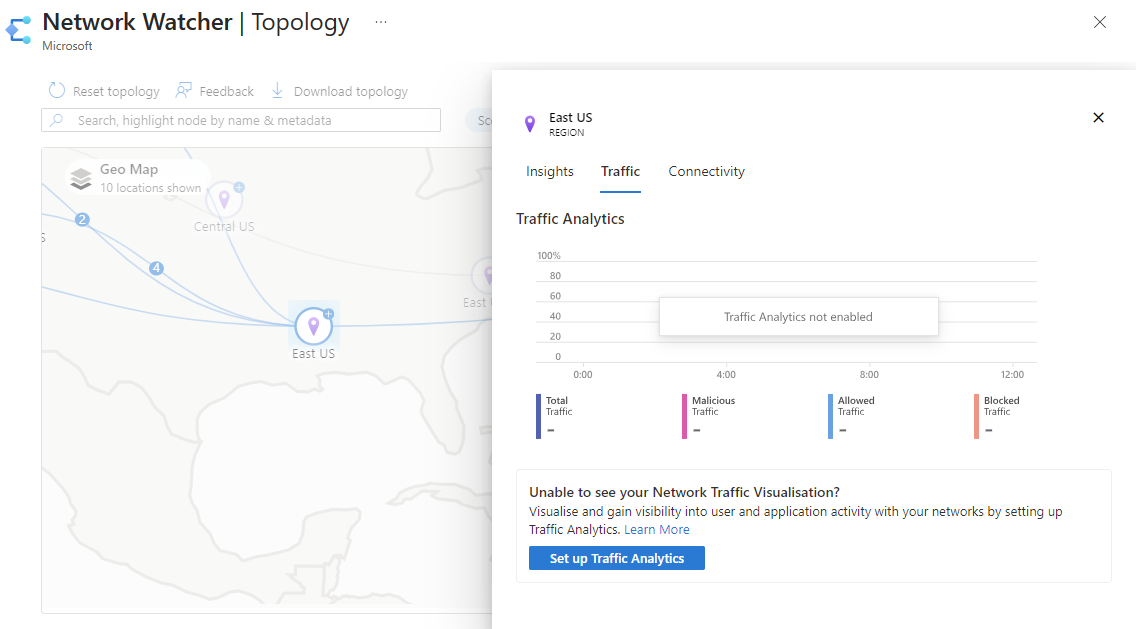
Select the Traffic tab to see detailed traffic information about the selected region. The insights presented in this tab are fetched from Network Watcher flow logs and traffic analytics. You see Set up Traffic Analytics with no insights if traffic analytics isn't enabled.
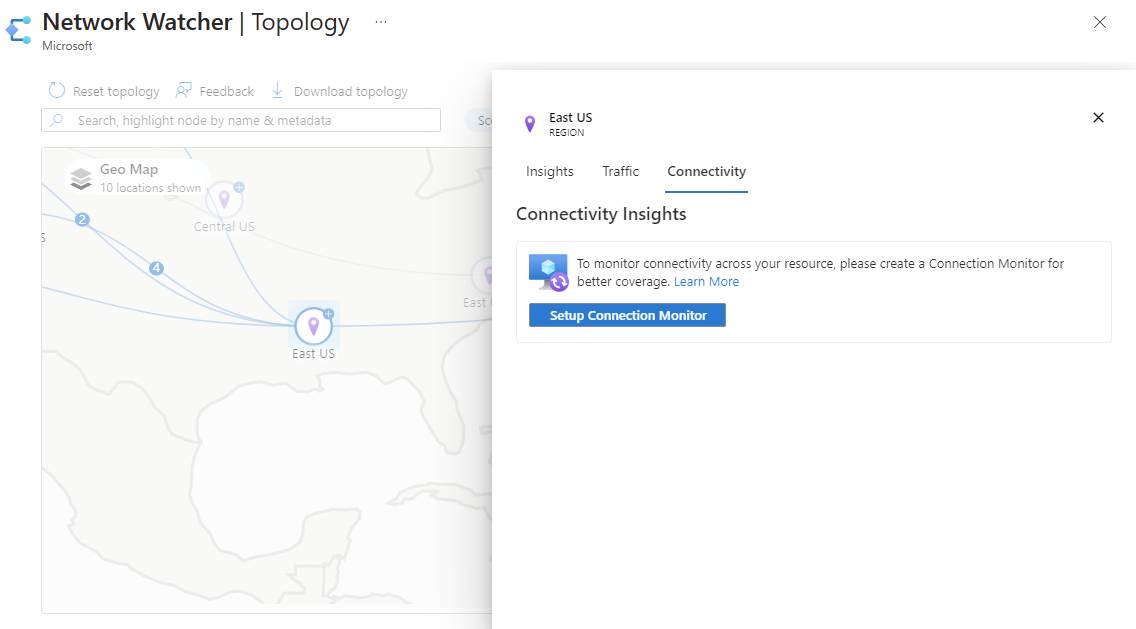
Select the Connectivity tab to see detailed connectivity information about the selected region. The insights presented in this tab are fetched from Network Watcher connection monitor. You see Set up Connection Monitor with no insights if connection monitor isn't enabled.


Drilldown resources
In this section, you learn how to navigate the topology view from regions to the individual Azure resource such as a virtual machine (VM). Once you drill down to the VM, you can see its traffic and connectivity insights. From the VM view, you have access to Network Watcher diagnostic tools such as connection troubleshoot, packet capture and next hop to help in troubleshooting any issues you have with the VM.
Select Scope to choose the subscriptions and regions of the resources that you want to navigate to. The following example shows one subscription and region selected.
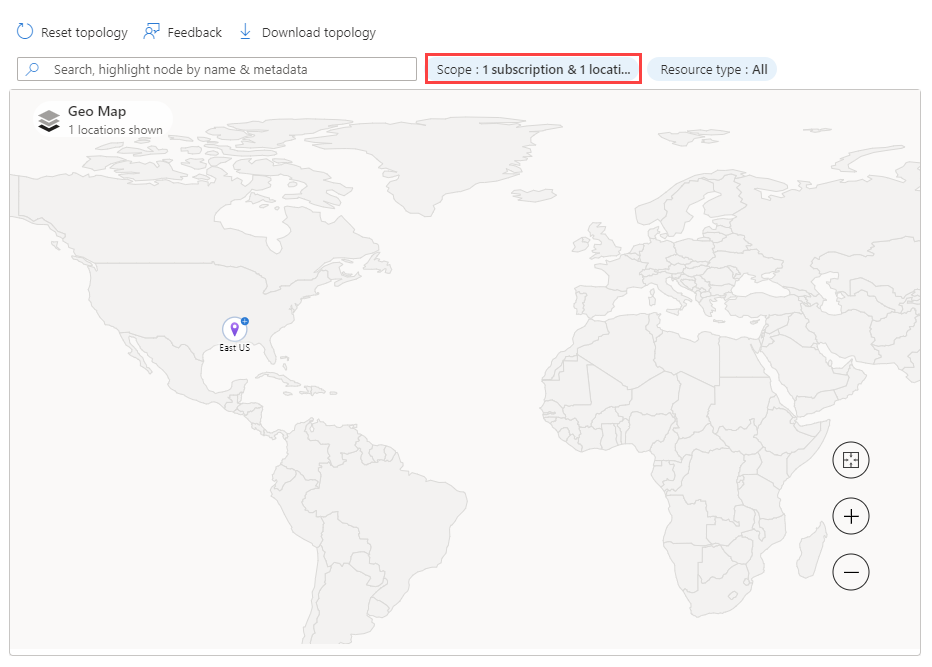
Select the plus sign of the region that has the resource that you want to see to navigate to the region view.
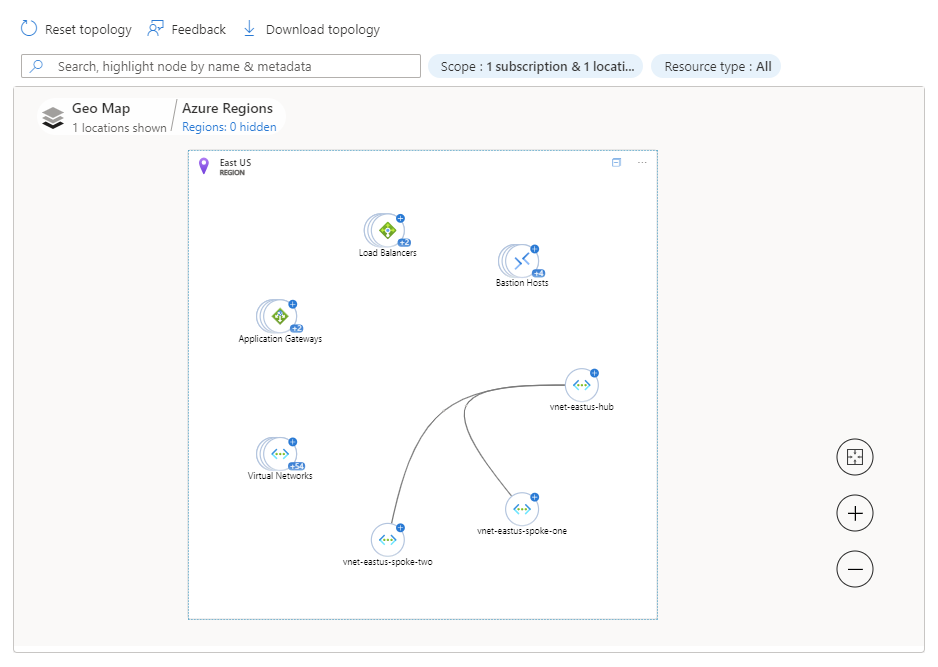
In the region view, you see virtual networks and other Azure resources in the region. You see any virtual network peerings in the region so you can understand the traffic flow from and to resources within the region. You can navigate to the virtual network view to see its subnets.
Select the plus sign of the virtual network that has the resource that you want to see to navigate to the virtual network view. If the region has multiple virtual networks, you might see Virtual Networks. Select the plus sign of Virtual Networks to drill down to the virtual networks in your region and then select the plus sign of the virtual network that has the resource that you want to see.
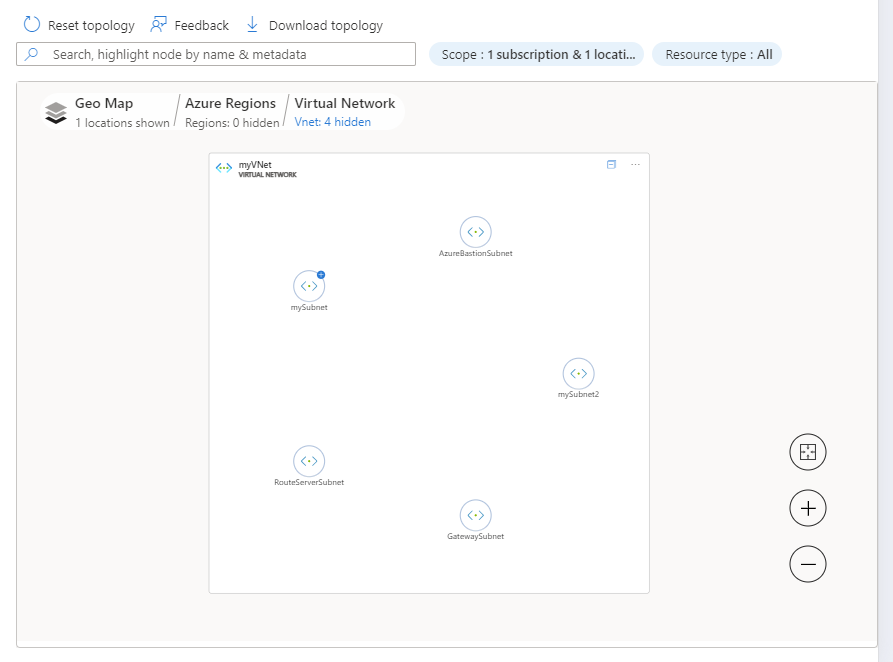
In the virtual network view of myVNet, you see all five subnets that myVNet has.
Select the plus sign of a subnet to see all the resources that exist in it and their relationships.

In the subnet view of mySubnet, you see Azure resources that exist in it and their relationships. For example, you see myVM and its network interface myvm36 and IP configuration ipconfig1.
Select the virtual machine that you want to see its insights.
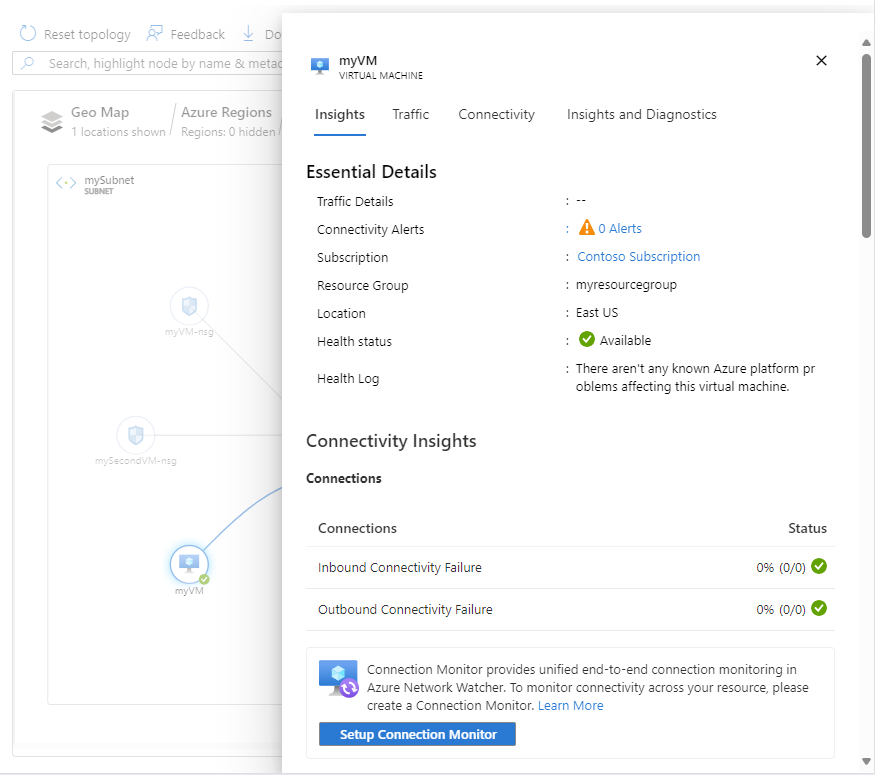
In insights tab, you see essential insights. Scroll down to see connectivity and traffic insights and resource metrics.
Note
- Connectivity insights are available when connection monitor is enabled. For more information, see Connection monitor.
- Traffic insights are available when flow logs and traffic analytics are enabled. For more information, see NSG flow logs, VNet flow logs and traffic analytics.
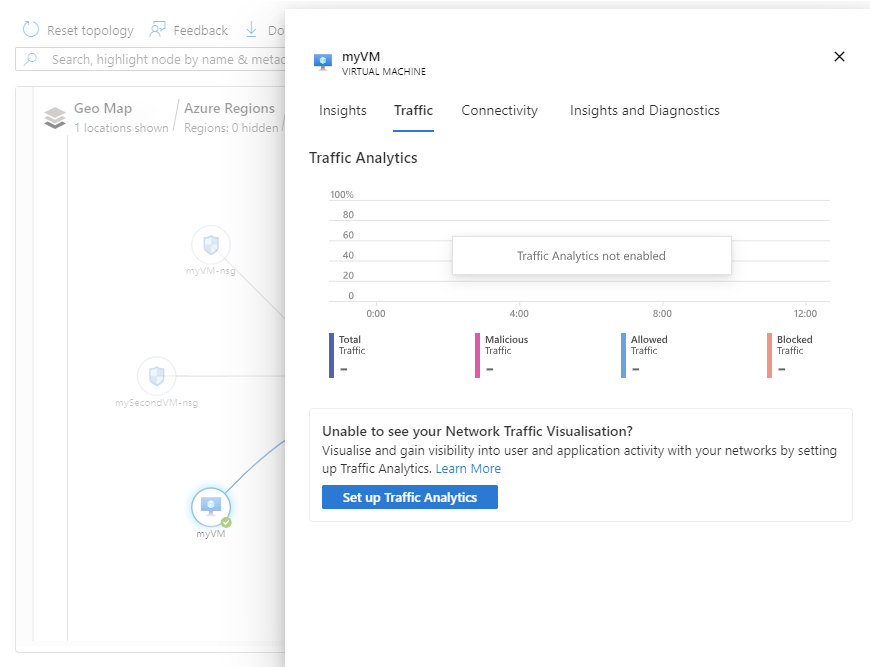
Select the Traffic tab to see detailed traffic information about the selected VM. The insights presented in this tab are fetched from Network Watcher flow logs and traffic analytics. You see Set up Traffic Analytics with no insights if traffic analytics isn't enabled.
Select the Connectivity tab to see detailed connectivity information about the selected VM. The insights presented in this tab are fetched from Network Watcher connection monitor. You see Set up Connection Monitor with no insights if connection monitor isn't enabled.

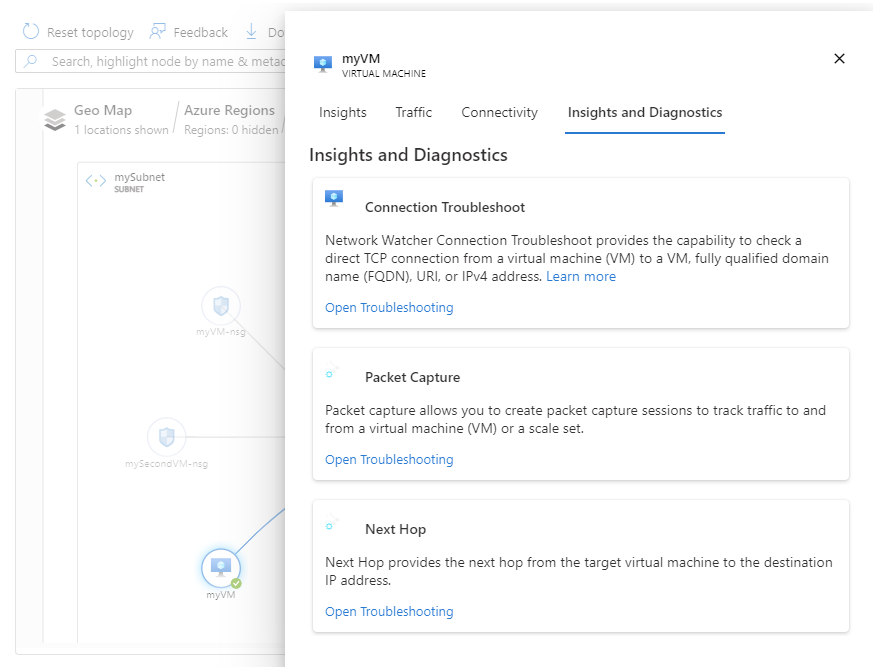
Select the Insights + Diagnostics tab to see the summary of the VM and to use Network Watcher diagnostic tools such as connection troubleshoot, packet capture and next hop to help in troubleshooting any issues you have with the VM.