Inspect and analyze Network Watcher packet capture files
By using the packet capture feature of Azure Network Watcher, you can initiate and manage capture sessions on your Azure virtual machines (VMs) and virtual machine scale sets:
- From the Azure portal, PowerShell, and the Azure CLI.
- Programmatically through the SDK and REST API.
With packet capture, you can address scenarios that require packet-level data by providing the information in a readily usable format. By using freely available tools to inspect the data, you can examine communications sent to and from your VMs or scale sets to gain insights into your network traffic. Example uses of packet capture data include investigating network or application problems, detecting network misuse and intrusion attempts, and maintaining regulatory compliance.
In this article, you learn how to use a popular open-source tool to open a packet capture file that Network Watcher provided. You also learn how to calculate connection latency, identify abnormal traffic, and examine network statistics.
Prerequisites
A packet capture file created through Network Watcher. For more information, see Manage packet captures for virtual machines using the Azure portal.
Wireshark. For more information, see the Wireshark website.
Calculate network latency
In this example, you learn how to view the initial round-trip time (RTT) of a Transmission Control Protocol (TCP) conversation between two endpoints.
When a TCP connection is established, the first three packets sent in the connection follow a pattern called the three-way handshake. By examining the first two packets sent in this handshake (an initial request from the client and a response from the server), you can calculate the latency. This latency is the RTT. For more information on the TCP protocol and the three-way handshake, see Explanation of the three-way handshake via TCP/IP.
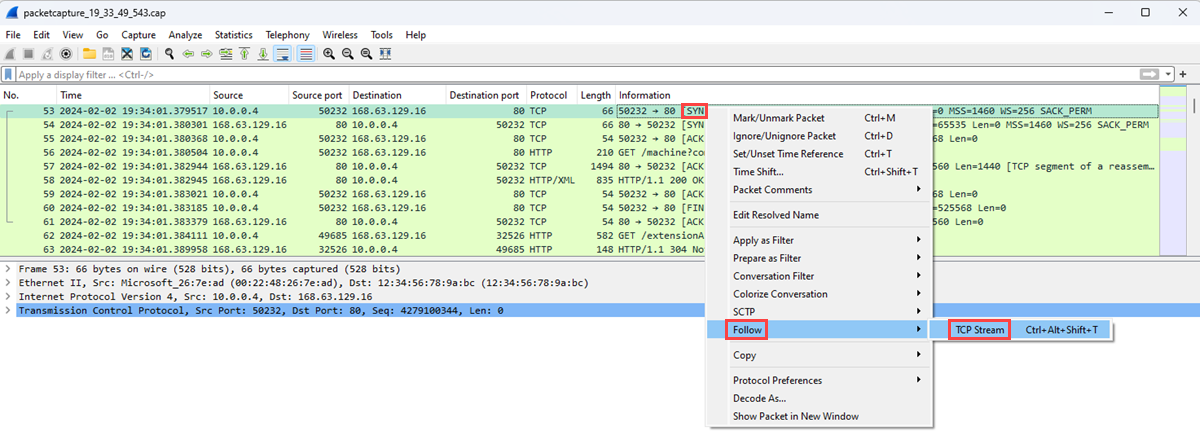
Launch Wireshark.
Load the .cap file from your packet capture session.
Select a [SYN] packet in your capture. This packet is the first packet that the client sends to initiate a TCP connection.
Right-click the packet, select Follow, and then select TCP Stream.
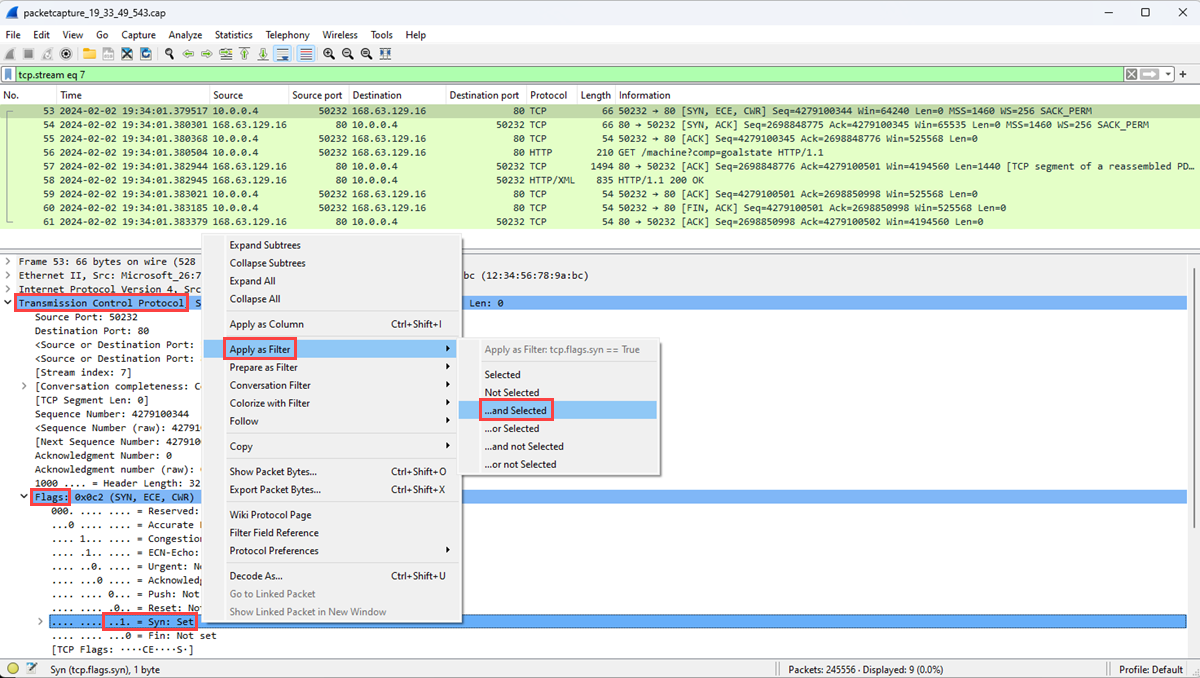
Expand the Transmission Control Protocol section of the [SYN] packet, and then expand the Flags section.
Confirm that the Syn bit is set to 1, and then right-click it.
Select Apply as Filter, and then select ...and selected to show the packets that have the Syn bit set to 1 within the TCP stream.
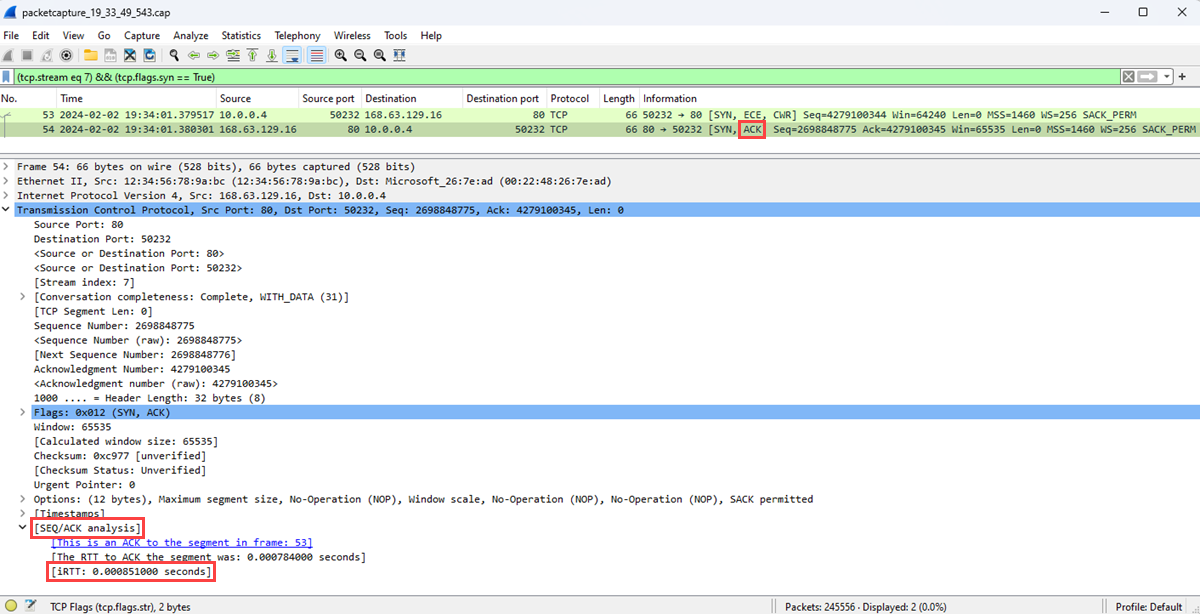
The first two packets involved in the TCP handshake are the [SYN] and [SYN, ACK] packets. You don't need the last packet in the handshake, which is the [ACK] packet. The client sends the [SYN] packet. After the server receives the [SYN] packet, it sends the [ACK] packet as an acknowledgment of receiving the [SYN] packet from the client.
Select the [SCK] packet.
Expand the SEQ/ACK analysis section to show the initial RTT in seconds.


Find unwanted protocols
You can have many applications running on an Azure virtual machine. Many of these applications communicate over the network, sometimes without your explicit permission. By using packet capture to record network communication, you can investigate how applications communicate over the network. The investigation helps you identify and address any potential problems.
In this example, you learn how to analyze a packet capture to find unwanted protocols that might indicate unauthorized communication from an application running on your virtual machine.
Open Wireshark.
Load the .cap file from your packet capture session.
On the Statistics menu, select Protocol Hierarchy.
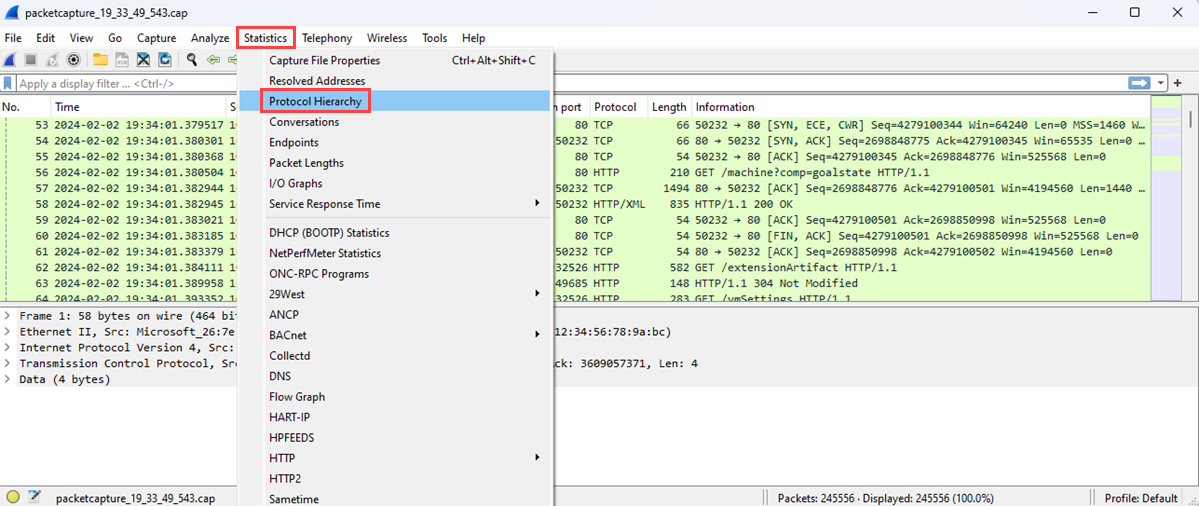
The Protocol Hierarchy Statistics window lists all the protocols that were in use during the capture session, along with the number of packets transmitted and received for each protocol. This view is useful for finding unwanted network traffic on your virtual machines or network.
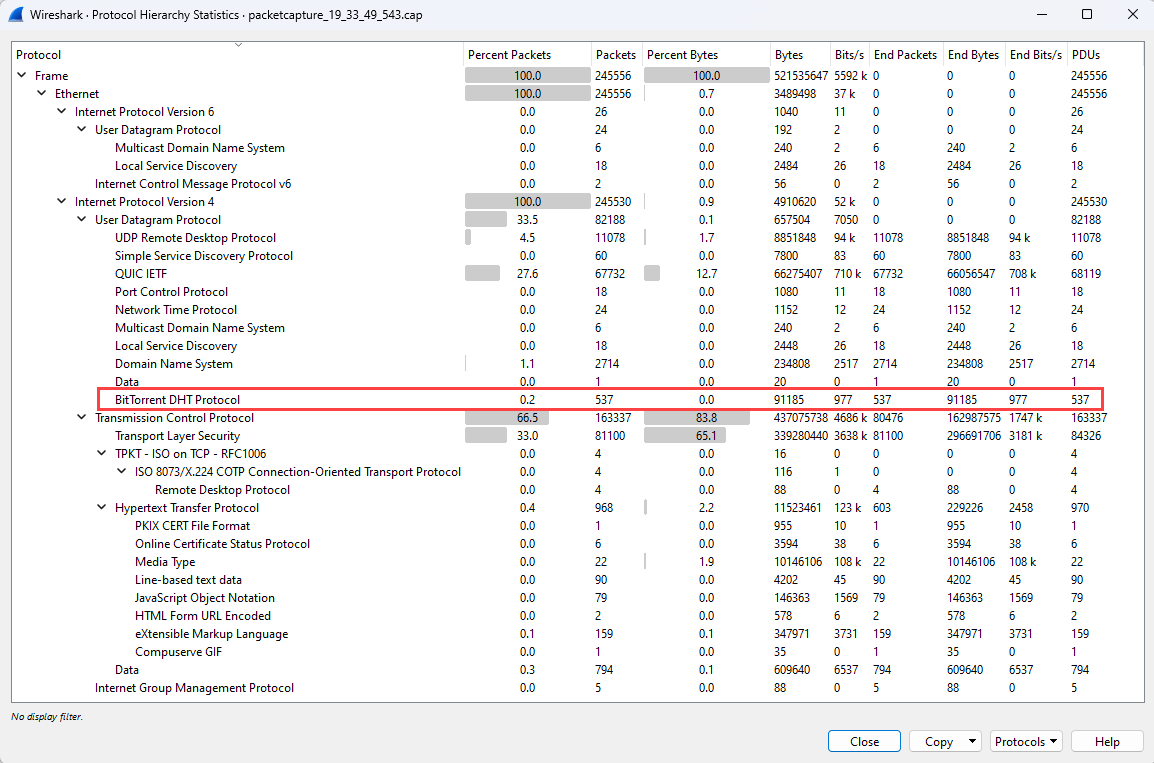
This example shows traffic for the BitTorrent protocol, which is used for peer-to-peer file sharing. As an administrator, if you don't expect to see BitTorrent traffic on this virtual machine, you can either:
- Remove the peer-to-peer software that's installed on this virtual machine.
- Block the traffic by using a network security group or a firewall.


Find destinations and ports
Understanding the types of traffic, the endpoints, and the ports for communication is important when you're monitoring or troubleshooting applications and resources in your network. By analyzing a packet capture file, you can learn the top destinations that your virtual machine communicated with and the ports that they used.
Launch Wireshark.
Load the .cap file from your packet capture session.
On the Statistics menu, select IPv4 Statistics and then select Destinations and Ports.
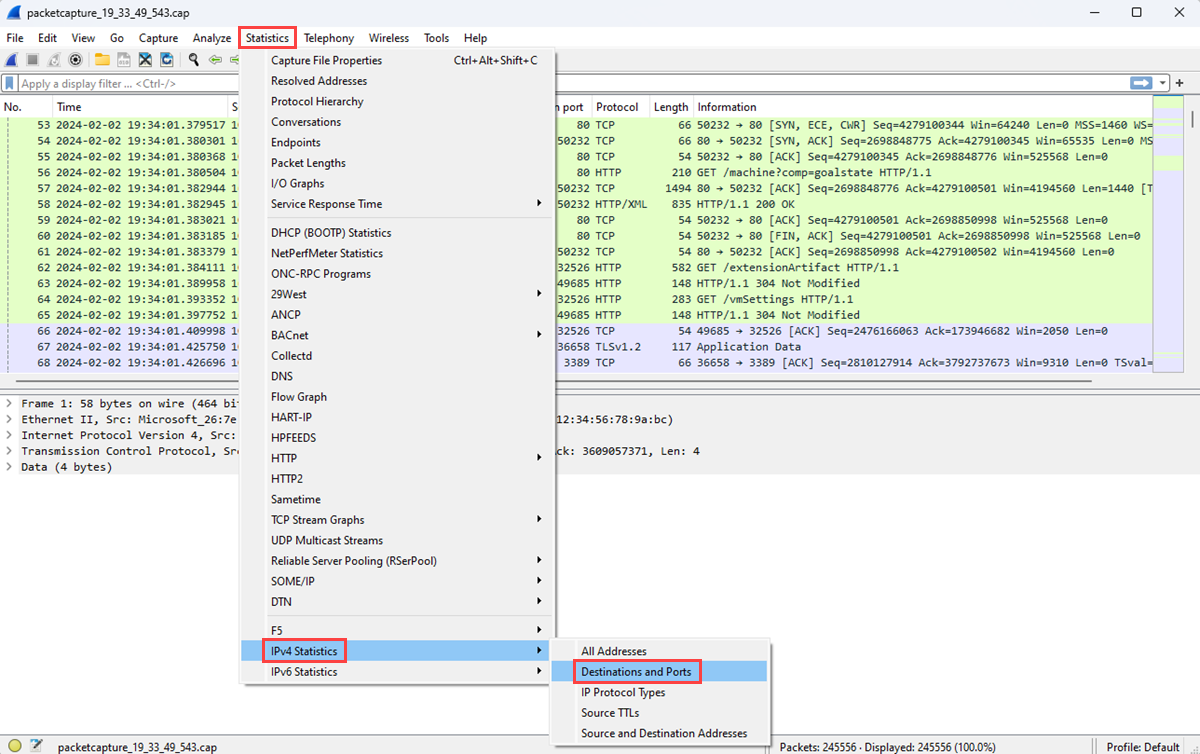
The Destinations and Ports window lists the top destinations and ports that the VM communicated with during the capture session. You display only communication through a specific protocol by using a filter. For example, you can see if any communication used Remote Desktop Protocol (RDP) by entering rdp in the Display filter box.
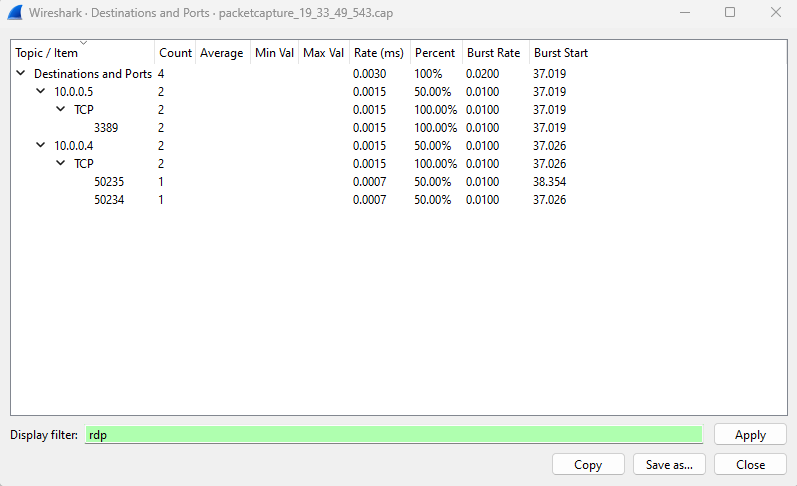
Similarly, you can filter for other protocols that you're interested in.


Next step
To learn about the other network diagnostic tools of Network Watcher, see: