Visualize network traffic patterns to and from your VMs by using open-source tools
Packet captures contain network data that help you perform network forensics and deep packet inspection. Many open-source tools are available for you to analyze packet captures and gain insights about your network. One such tool is CapAnalysis, an open-source visualization tool for packet captures.
Visualizing packet capture data is a valuable way to quickly derive insights on patterns and anomalies within your network. Visualizations also provide a way to share such insights in an easily consumable format.
With Azure Network Watcher, you can capture data by performing packet captures on your network. This article provides a walkthrough of how to visualize and gain insights from packet captures by using CapAnalysis with Network Watcher.
Scenario
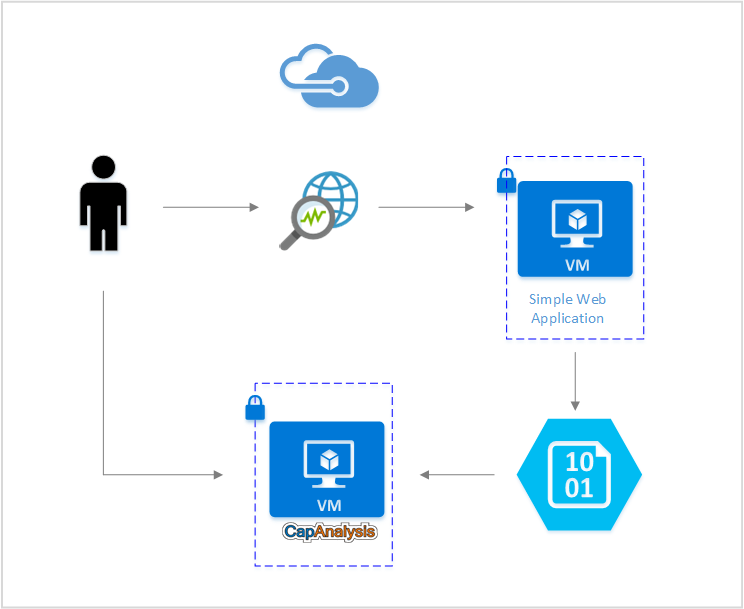
In this article, assume that you have a simple web application deployed on a virtual machine (VM) in Azure. You want to use open-source tools to visualize its network traffic and quickly identify flow patterns and any anomalies. With Network Watcher, you can get a packet capture of your network environment and directly store it on your storage account. CapAnalysis can then ingest the packet capture directly from the storage blob and visualize its contents.
Install CapAnalysis
To install CapAnalysis on a virtual machine, see the official CapAnalysis instructions.
To access CapAnalysis remotely, you need to open port 9877 on your VM by adding a new inbound security rule. For more information about creating rules in network security groups (NSGs), see Create a security rule. After you successfully add the rule, you should be able to access CapAnalysis from http://<PublicIP>:9877.
Use Azure Network Watcher to start a packet capture session
With Network Watcher, you can capture packets to track traffic in and out of a virtual machine. To start a packet capture session, follow the instructions in the Manage packet captures with Network Watcher article. A packet capture can be stored in a storage blob that CapAnalysis can access.
Upload a packet capture to CapAnalysis
You can directly upload a packet capture from Network Watcher. Use the Import from URL tab and provide a link to the storage blob where the packet capture is stored.
When you're providing a link to CapAnalysis, be sure to append a shared access signature (SAS) token to the storage blob URL. Go to Shared access signature from the storage account, designate the allowed permissions, and select the Generate SAS button to create a token. You can then append the SAS token to the packet capture's storage blob URL.
The resulting URL looks something like http://storageaccount.blob.core.windows.net/container/location?addSASkeyhere.
Analyze packet captures
CapAnalysis offers various options to visualize your packet capture. Each one provides analysis from a different perspective. With these visual summaries, you can understand your network traffic trends and quickly spot any unusual activity.
The following list describes a few of the CapAnalysis features:
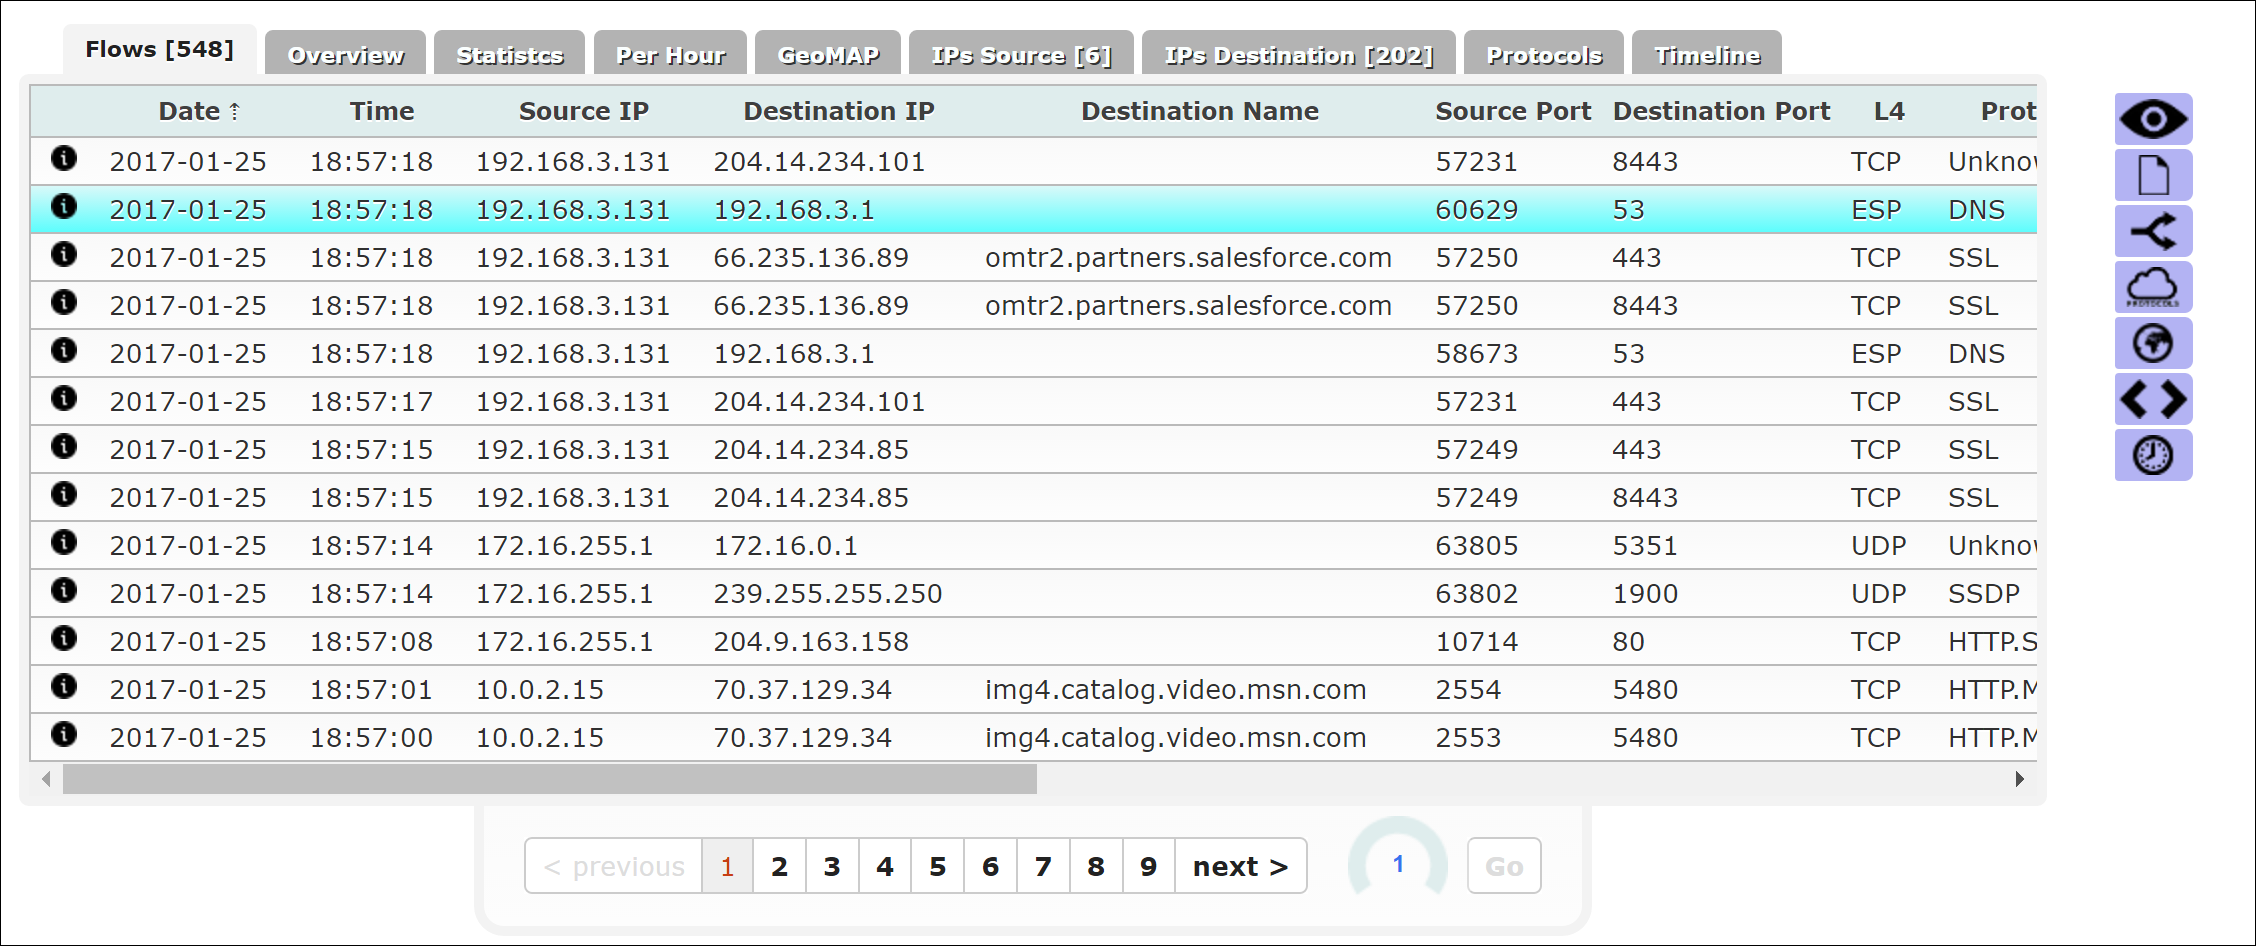
Flow tables
The Flows tab lists flows in the packet data. For each flow, the tab shows information like the time stamp, source and destination IPs, and associated protocols.
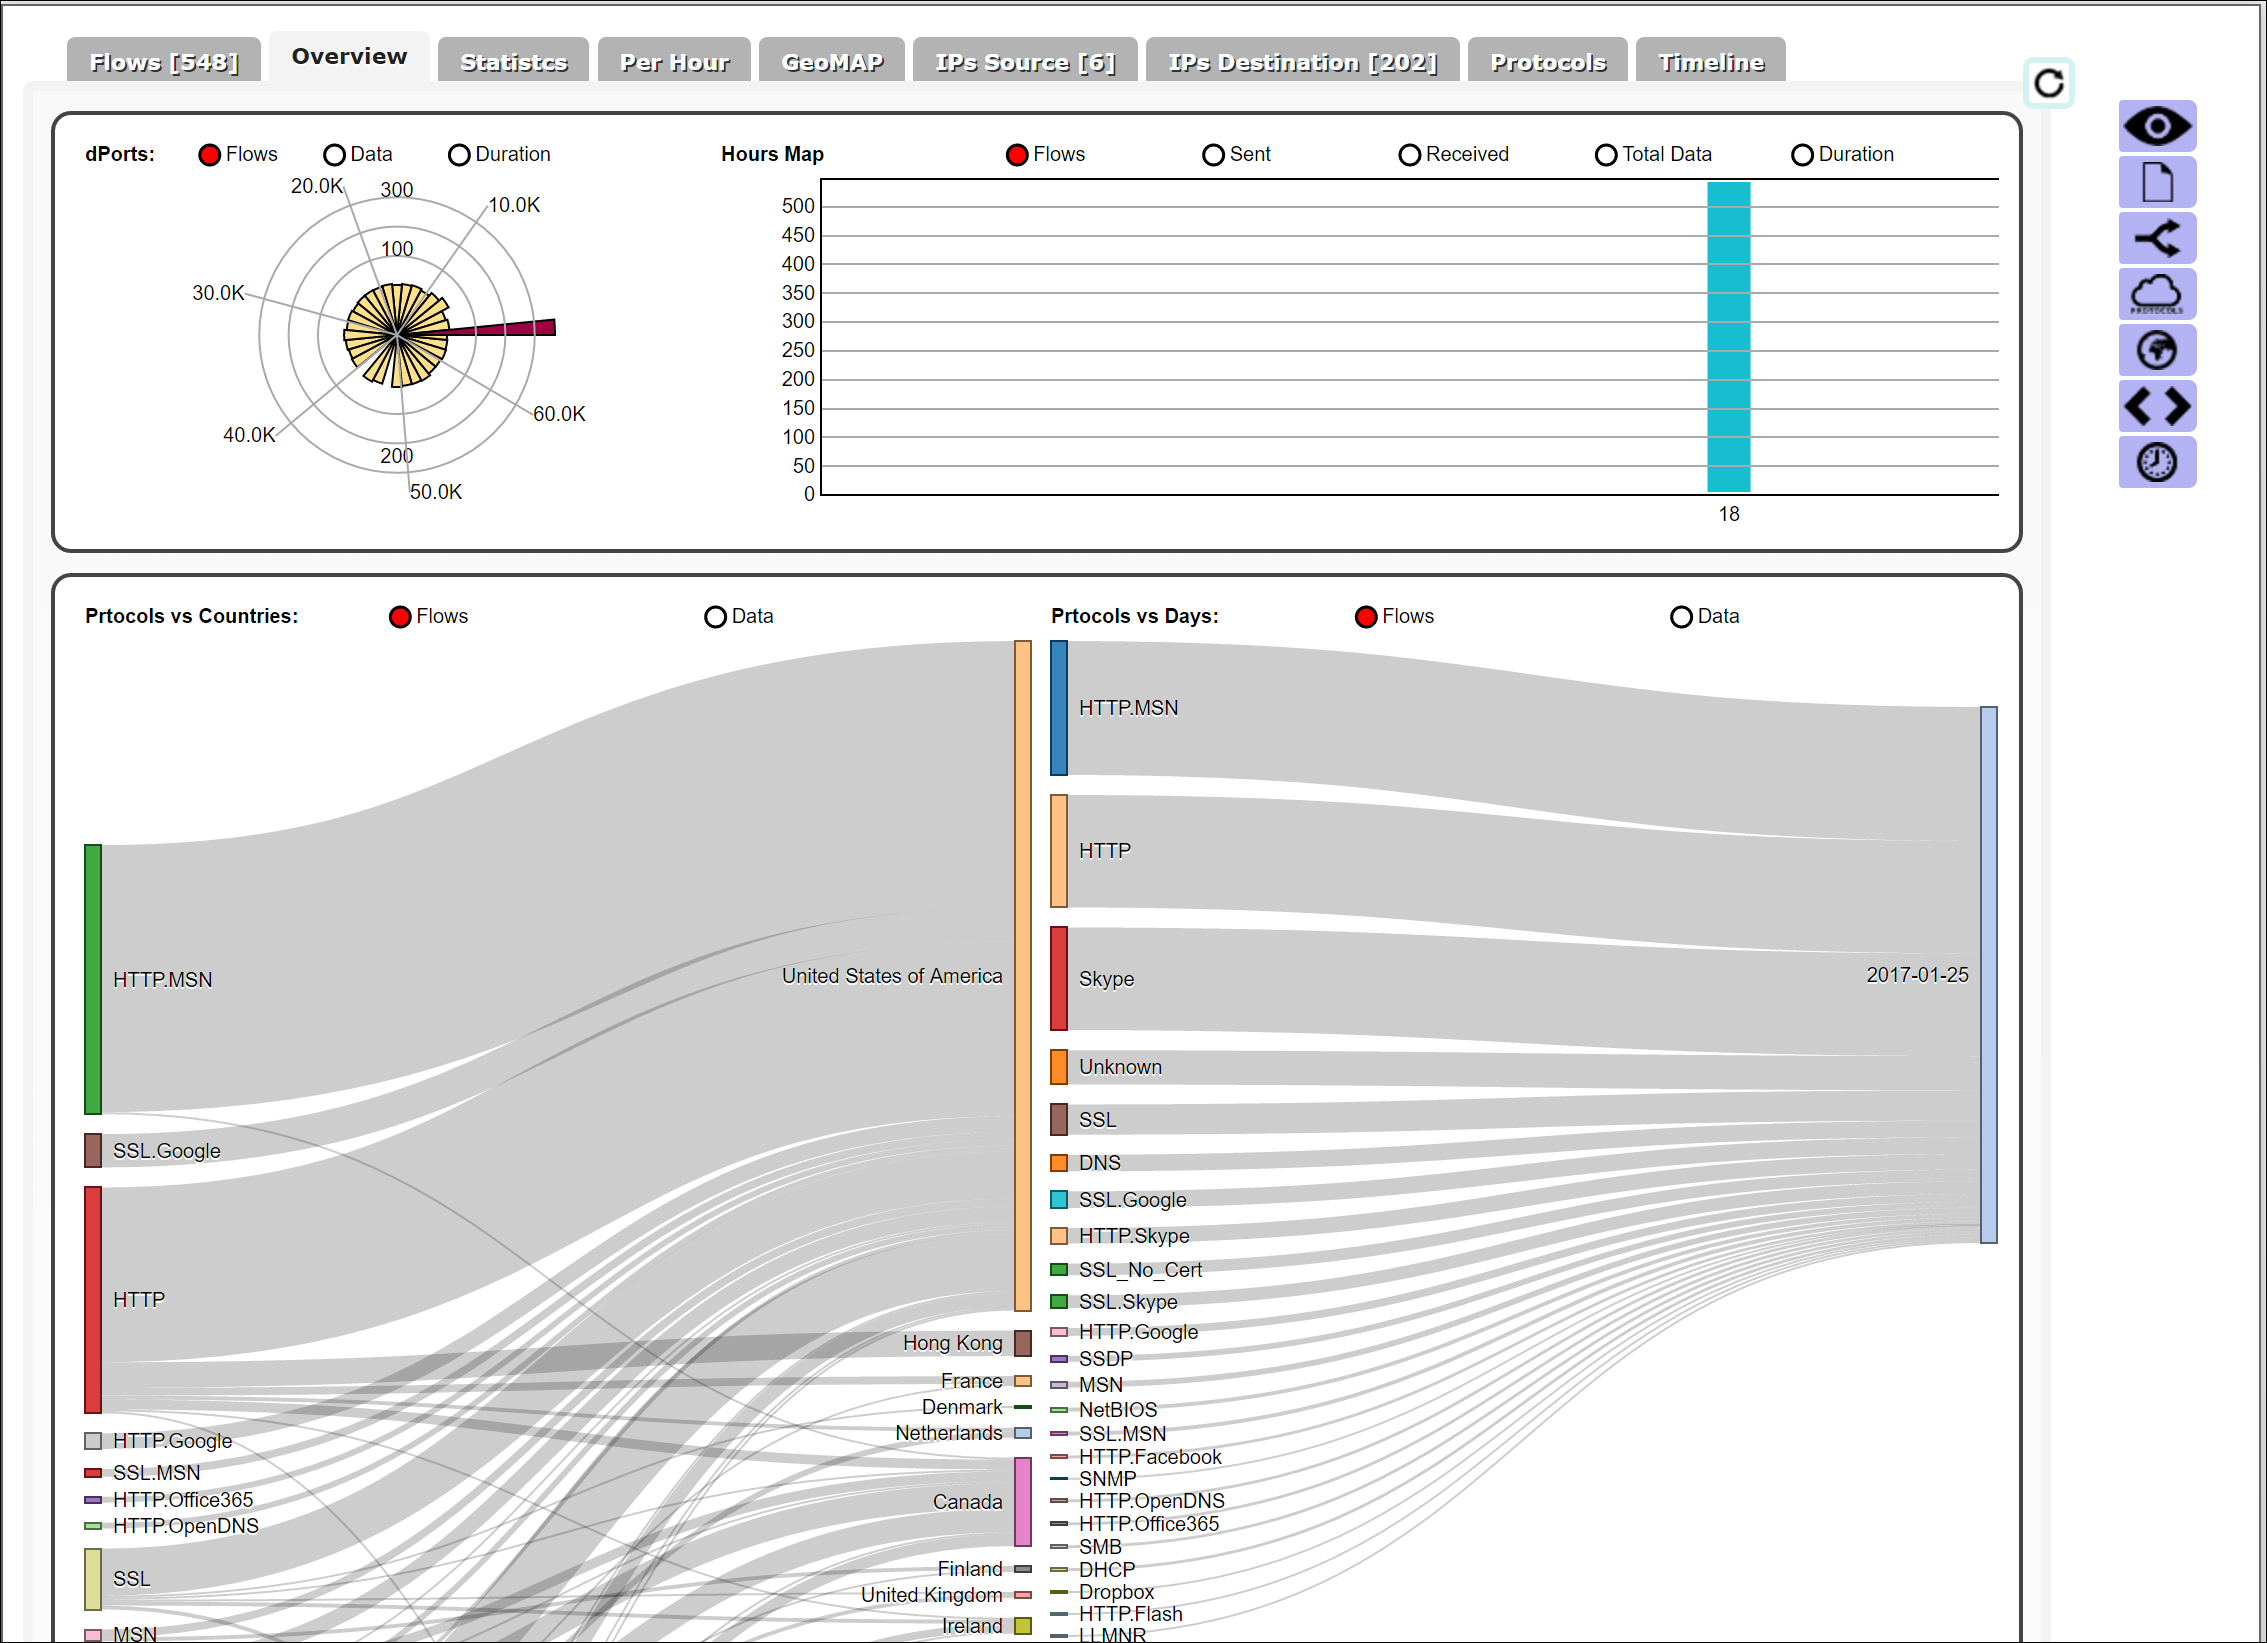
Protocol overview
The Overview tab shows the distribution of network traffic over the various protocols and geographies.
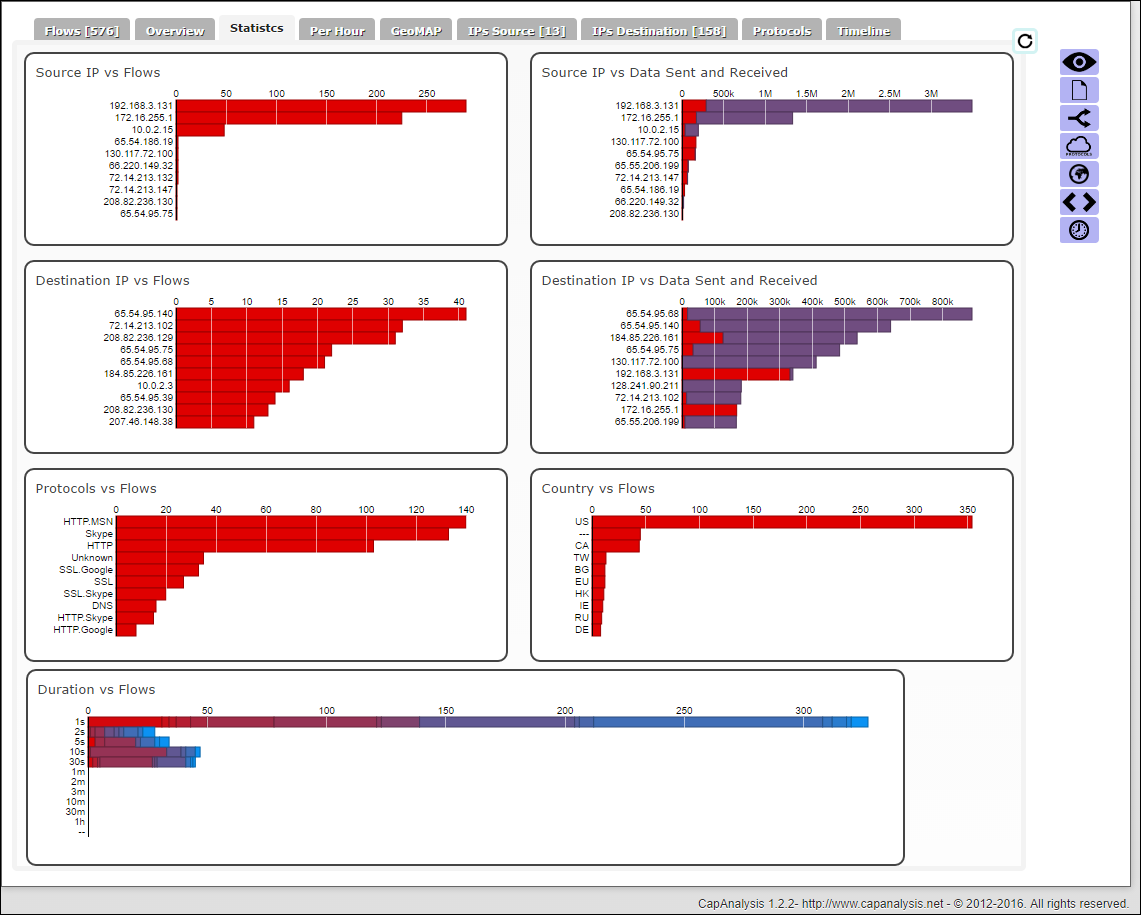
Statistics
The Statistics tab shows network traffic statistics. This information includes bytes sent and received from source and destination IPs, flows for each of the source and destination IPs, protocols used for various flows, and the duration of flows.
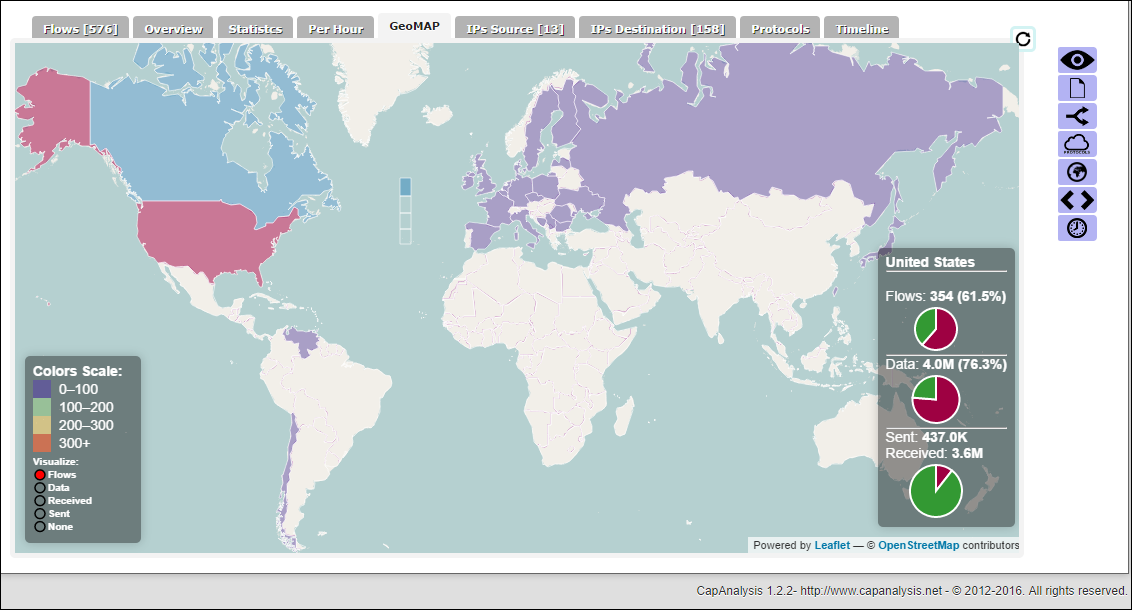
Geographical map
The GeoMAP tab provides a map view of your network traffic. Colors scale to the volume of traffic from each country/region. You can select highlighted countries/regions to view additional flow statistics, such as the proportion of data sent and received from IPs in a country/region.
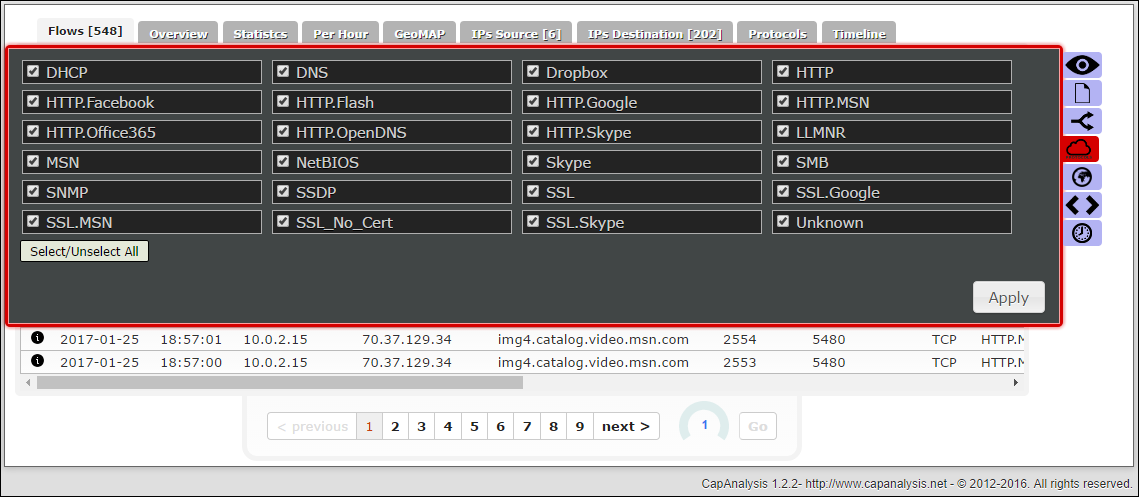
Filters
CapAnalysis provides a set of filters for quick analysis of specific packets. For example, you can choose to filter the data by protocol to gain specific insights on that subset of traffic.
To learn more about all the capabilities of CapAnalysis, go to the tool's website.
Conclusion
You can use the Network Watcher packet capture feature to capture the necessary data to perform network forensics and better understand your network traffic. The scenario in this article showed how you can integrate packet captures from Network Watcher by using open-source visualization tools. By using tools such as CapAnalysis to visualize packet captures, you can perform deep packet inspection and quickly identify trends in your network traffic.
Next steps
- Learn about NSG flow logs.
- Learn how to visualize your NSG flow logs by using Power BI.
Feedback
Coming soon: Throughout 2024 we will be phasing out GitHub Issues as the feedback mechanism for content and replacing it with a new feedback system. For more information see: https://aka.ms/ContentUserFeedback.
Submit and view feedback for