Note
Access to this page requires authorization. You can try signing in or changing directories.
Access to this page requires authorization. You can try changing directories.
Traffic Analytics in Azure Network Watcher processes and aggregates virtual network flow logs to provide visibility into network flows, traffic patterns, and potential security risks. It enriches flow data with threat intelligence, geolocation attributes, and topology context to help identify anomalies and evaluate exposure across your environment.
Traffic Analytics supports integration with Microsoft Sentinel. Microsoft Sentinel is a scalable, cloud-native Security Information and Event Management (SIEM) solution that provides cost-efficient security monitoring across multicloud and multiplatform environments. Microsoft Sentinel uses ASIM-based parsers to normalize incoming data, allowing Traffic Analytics flow data to be transformed into the required schema for correlation, investigation, and threat detection.
Together, Traffic Analytics and Microsoft Sentinel enable both proactive monitoring and reactive investigation. Flow-level telemetry highlights unexpected communication paths, unusual traffic volumes, and indicators of compromise, allowing you to detect deviations from baseline behavior and investigate events with reliable and structured insights.
Prerequisites
An Azure account with an active subscription. Create an account for free.
Traffic Analytics enabled for your flow logs. For more information, see Enable or disable traffic analytics.
Contributor or Security Admin access on the workspace.
Microsoft Sentinel Contributor role on the resource group that the workspace belongs to.
Integrate Microsoft Sentinel with Traffic Analytics using the Azure portal
You can easily integrate Microsoft Sentinel with Traffic Analytics directly from the Azure portal.
Enable Microsoft Sentinel on the workspace
Start by enabling Microsoft Sentinel on the same Log Analytics workspace used by Traffic Analytics. This allows Sentinel to access and analyze Traffic Analytics data without requiring additional configuration or data movement.
In the search box at the top of the portal, search for Microsoft Sentinel.
Select Create, then choose the Log Analytics workspace used by Traffic Analytics.
Select Add to enable Microsoft Sentinel on the workspace.
Install Network analytics content
Install the required network solution from the Microsoft Sentinel content hub. This provides prebuilt workbooks, analytics rules, and hunting queries designed to analyze normalized network traffic data.
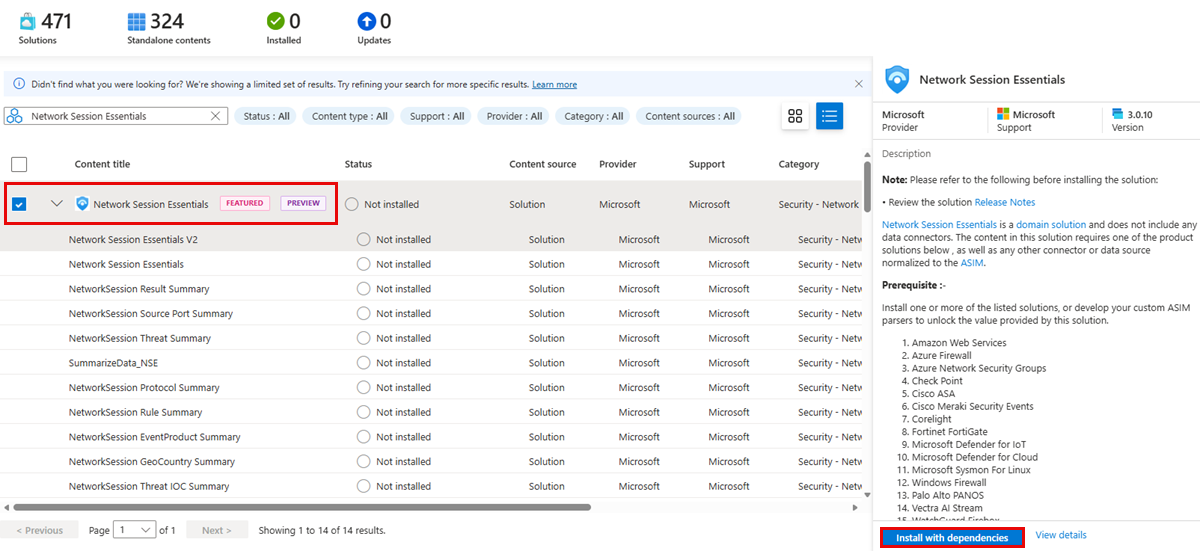
Under Content management in Microsoft Sentinel, select Content hub.
Search for Network Session Essentials.
Select Network Session Essentials and then select Install with dependencies.
Select Install to confirm and install the solution.

Enable analytics rules
Enable the relevant network analytics rules to start generating security alerts and incidents. These rules continuously evaluate Traffic Analytics data to detect suspicious or anomalous network behavior.
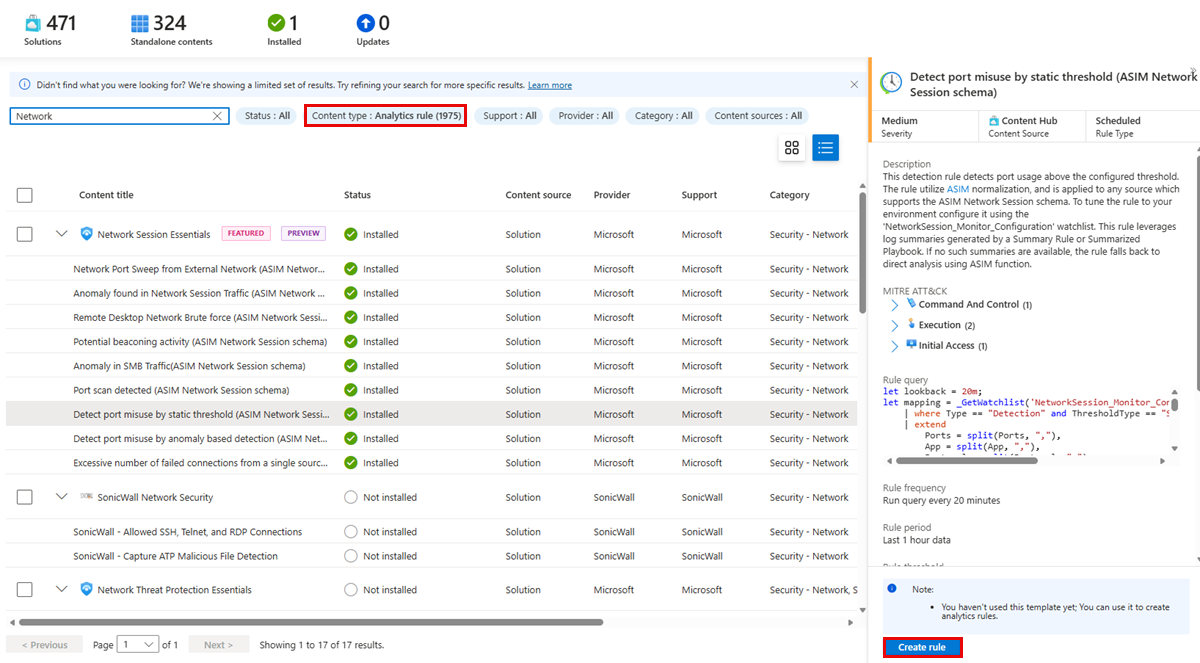
In the Content hub, filter by Content type: Analytics rule.
Search for Network to view all available network-related detection rules that can be enabled in your workspace.
To enable an Analytics rule, select the rule from the list and then select Create rule to create the rule in your workspace and start generating alerts based on matching network activity. This opens the Analytics rule wizard
In the Set rule logic tab of Analytics rule wizard, review the default rule configuration, including query logic, scheduling frequency, and lookback period. Adjust these settings if required.
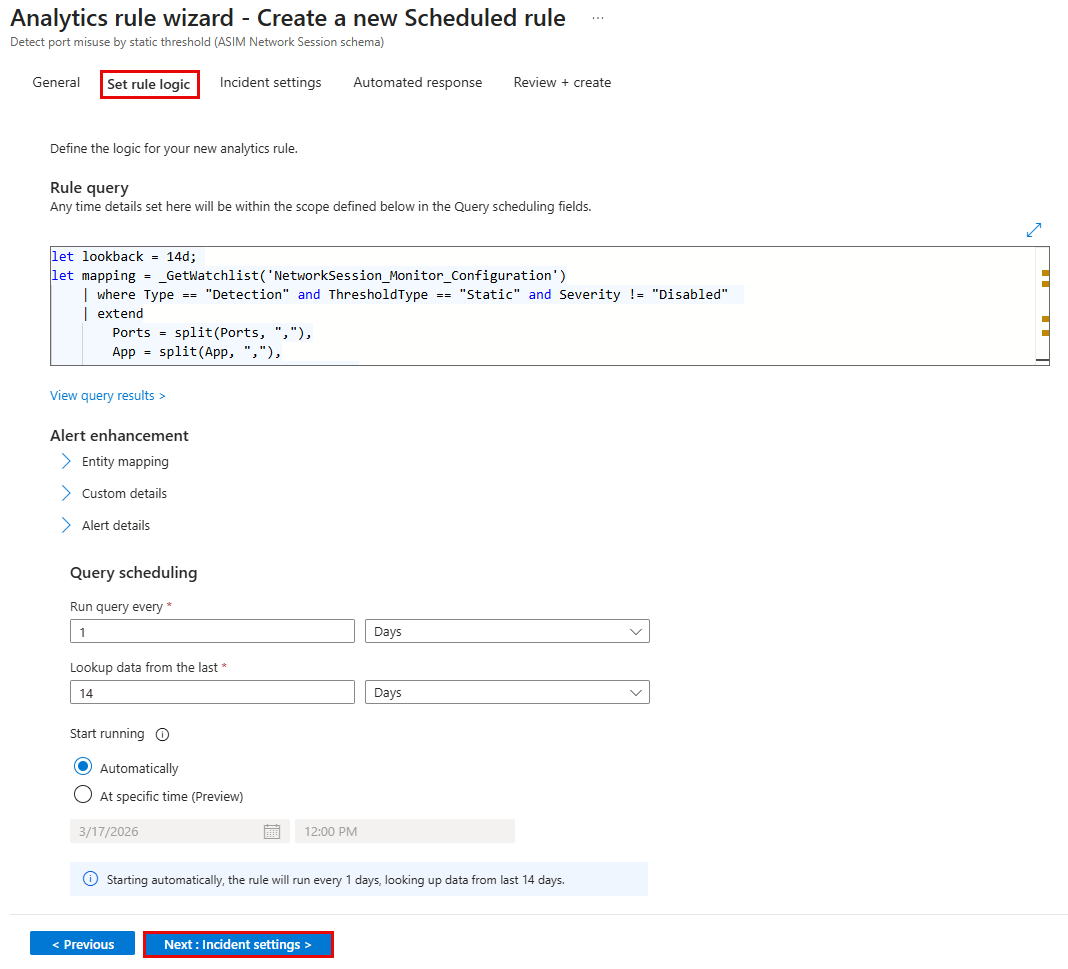
In the Incident settings tab, configure how alerts are grouped into incidents.
Select Review + create, then select Save to enable the rule.
Once enabled, the rule runs automatically on Traffic Analytics data and generates alerts and incidents when matching network activity is detected.


Insights generated by analytics rules
This section describes how Microsoft Sentinel analytics rules generate security insights from NSG Flow Logs using the ASIM Network Session schema. It walks through a set of nine analytics rules that collectively help identify suspicious and potentially malicious network behaviours such as brute‑force attempts, port scans, beaconing patterns, and traffic anomalies. For each rule, the table explains what type of activity is being detected, and shows how alerts appear in Sentinel through alert graphs.
The content also highlights how analysts can move from high‑level alert trends to detailed investigation by drilling into individual alerts, reviewing timestamps, entities, and extended properties, and correlating detections with MITRE ATT&CK tactics and techniques.
| Alert Rule | What does it indicate |
|---|---|
| Remote Desktop Network Brute Force | Multiple failed RDP (port 3389) connection attempts from a source, indicating a potential brute-force attack. |
| Network Port Sweep from External Network | An external source scanning the same port across multiple destination IPs, indicating reconnaissance. |
| Anomaly found in Network Session Traffic | Unusual deviations in network traffic patterns (direction, protocol, volume) compared to historical behaviour. |
| Port scan detected | A single source attempting connections to many different ports in a short time window, indicating port scanning. |
| Excessive number of failed connections from a single source | A source generating an unusually high number of failed network connections, suggesting suspicious or malicious activity. |
| Anomaly in SMB Traffic | Abnormal spikes or deviations in SMB (file-sharing) traffic compared to baseline behaviour. |
| Potential beaconing activity | Repetitive, patterned outbound network traffic that may indicate malware beaconing or command-and-control communication. |
| Detect port misuse by anomaly-based detection | Usage of network ports that deviates from learned normal behaviour, indicating suspicious port usage. |
| Detect port misuse by static threshold | Network port usage crossing a predefined static threshold, indicating potentially suspicious or policy-violating traffic. |