Note
Access to this page requires authorization. You can try signing in or changing directories.
Access to this page requires authorization. You can try changing directories.
In this article, we walk you through the process of setting up diagnostic settings and monitoring configuration differences in Azure Operator Nexus Network Fabric.
Step 1: Access device settings in the Azure portal
Sign in to the Azure portal.
In the search box at the top of the portal page, enter network devices.

Select the appropriate network device from the search results. Ensure that you choose the device for which you need to configure diagnostic settings.
Step 2: Add a diagnostic setting
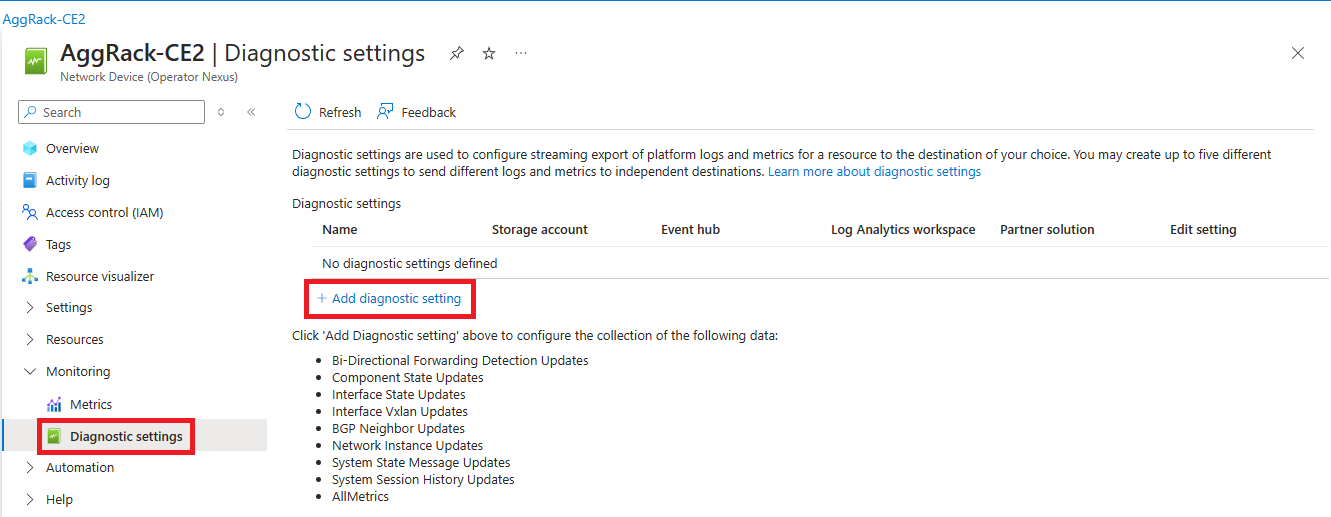
After you select the appropriate network device, on the left pane under Monitoring, select Diagnostic settings.
After you access the Diagnostic settings section, select Add diagnostic setting.
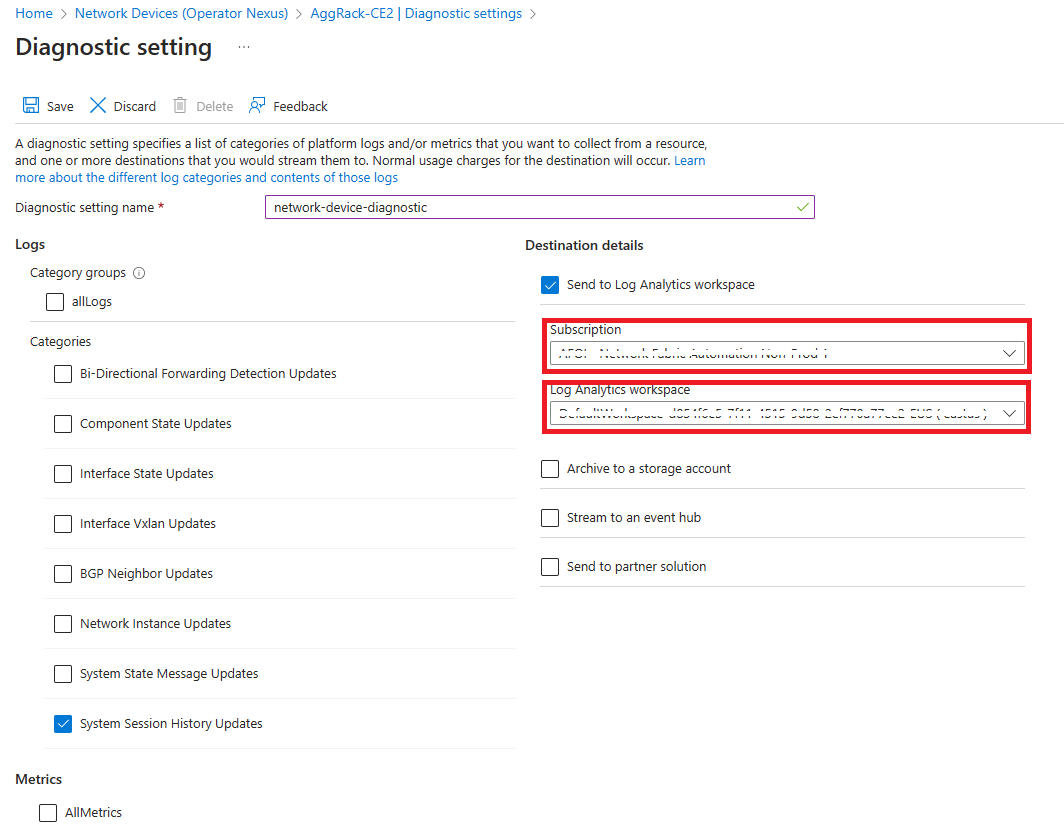
Within the diagnostic settings, provide a descriptive name for the diagnostic setting to easily identify its purpose.
In the diagnostic settings, select the categories of data that you want to collect for this diagnostic setting.

Step 3: Choose a log destination
After the diagnostic setting is added, locate the section where the log destination is specified.
Select the log destination from several choices, including a Log Analytics workspace, a storage account, or an event hub.
Note
In this example, you push the logs to the Log Analytics workspace.
To set up the Log Analytics workspace, if you haven't done so already, you might need to create one. Follow the prompts to create a new workspace or select an existing one.
After the log destination is configured, confirm the settings and save.
Step 4: Monitor configuration differences
Go to the Log Analytics workspace where the logs from the network device are being stored.
In the Log Analytics workspace, access the query interface or log search functionality.
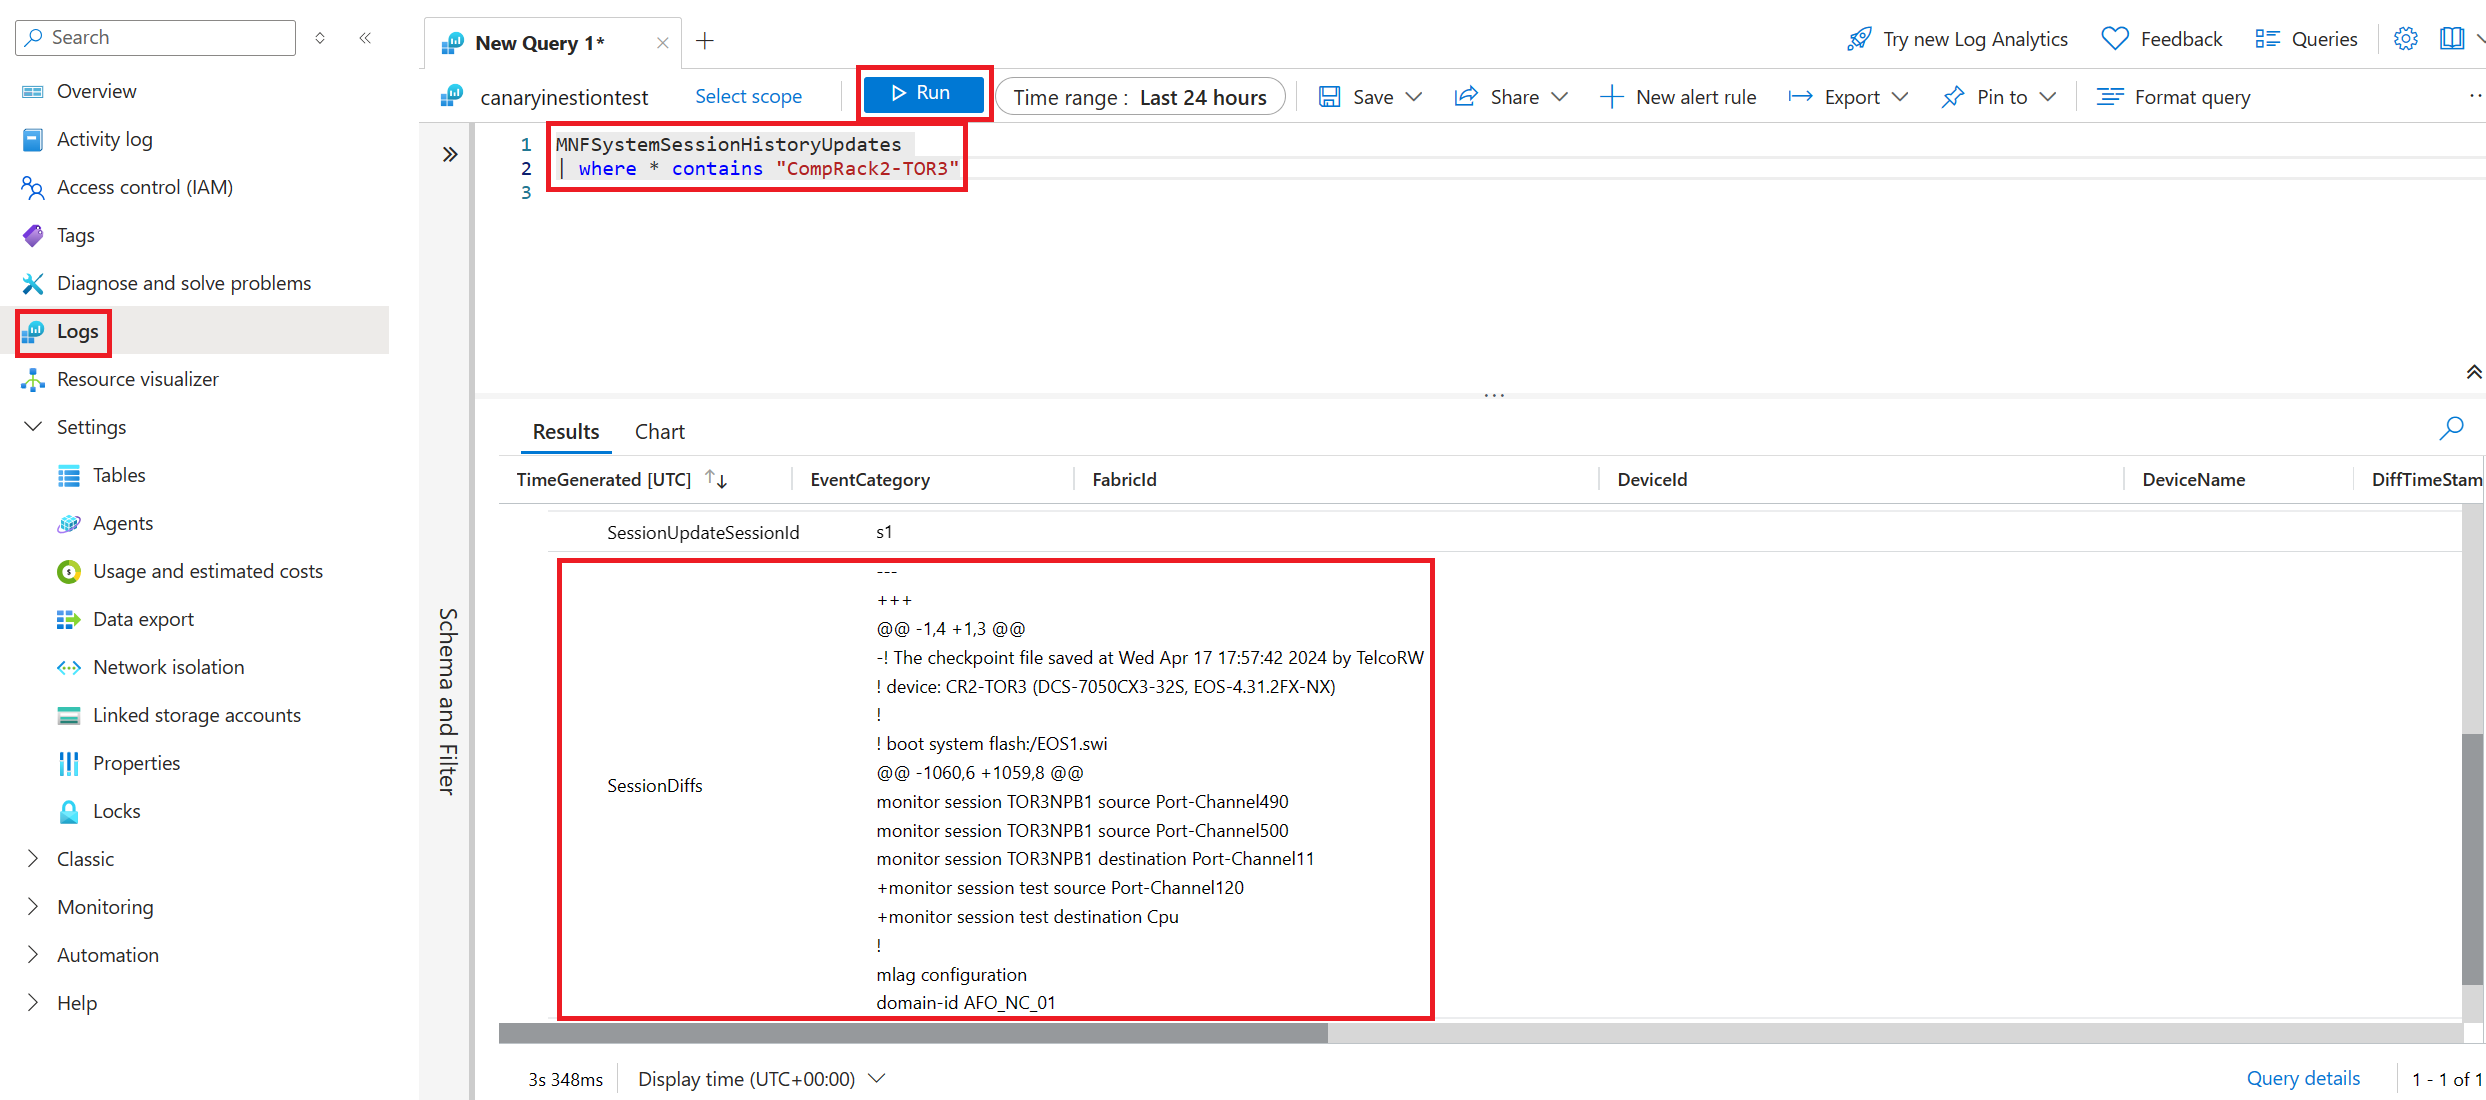
In the query interface, specify the event category as
MNFSystemSessionHistoryUpdates. This category filters the logs to specifically show configuration updates and changes comprehensively.