Note
Access to this page requires authorization. You can try signing in or changing directories.
Access to this page requires authorization. You can try changing directories.
This article describes how to identify and diagnose the root cause of slow-running queries.
In this article, you can learn:
- How to identify slow-running queries.
- How to identify a slow-running procedure along with it. Identify a slow query among a list of queries that belong to the same slow-running stored procedure.
Prerequisites
Enable troubleshooting guides by following the steps described in use troubleshooting guides.
Configure the
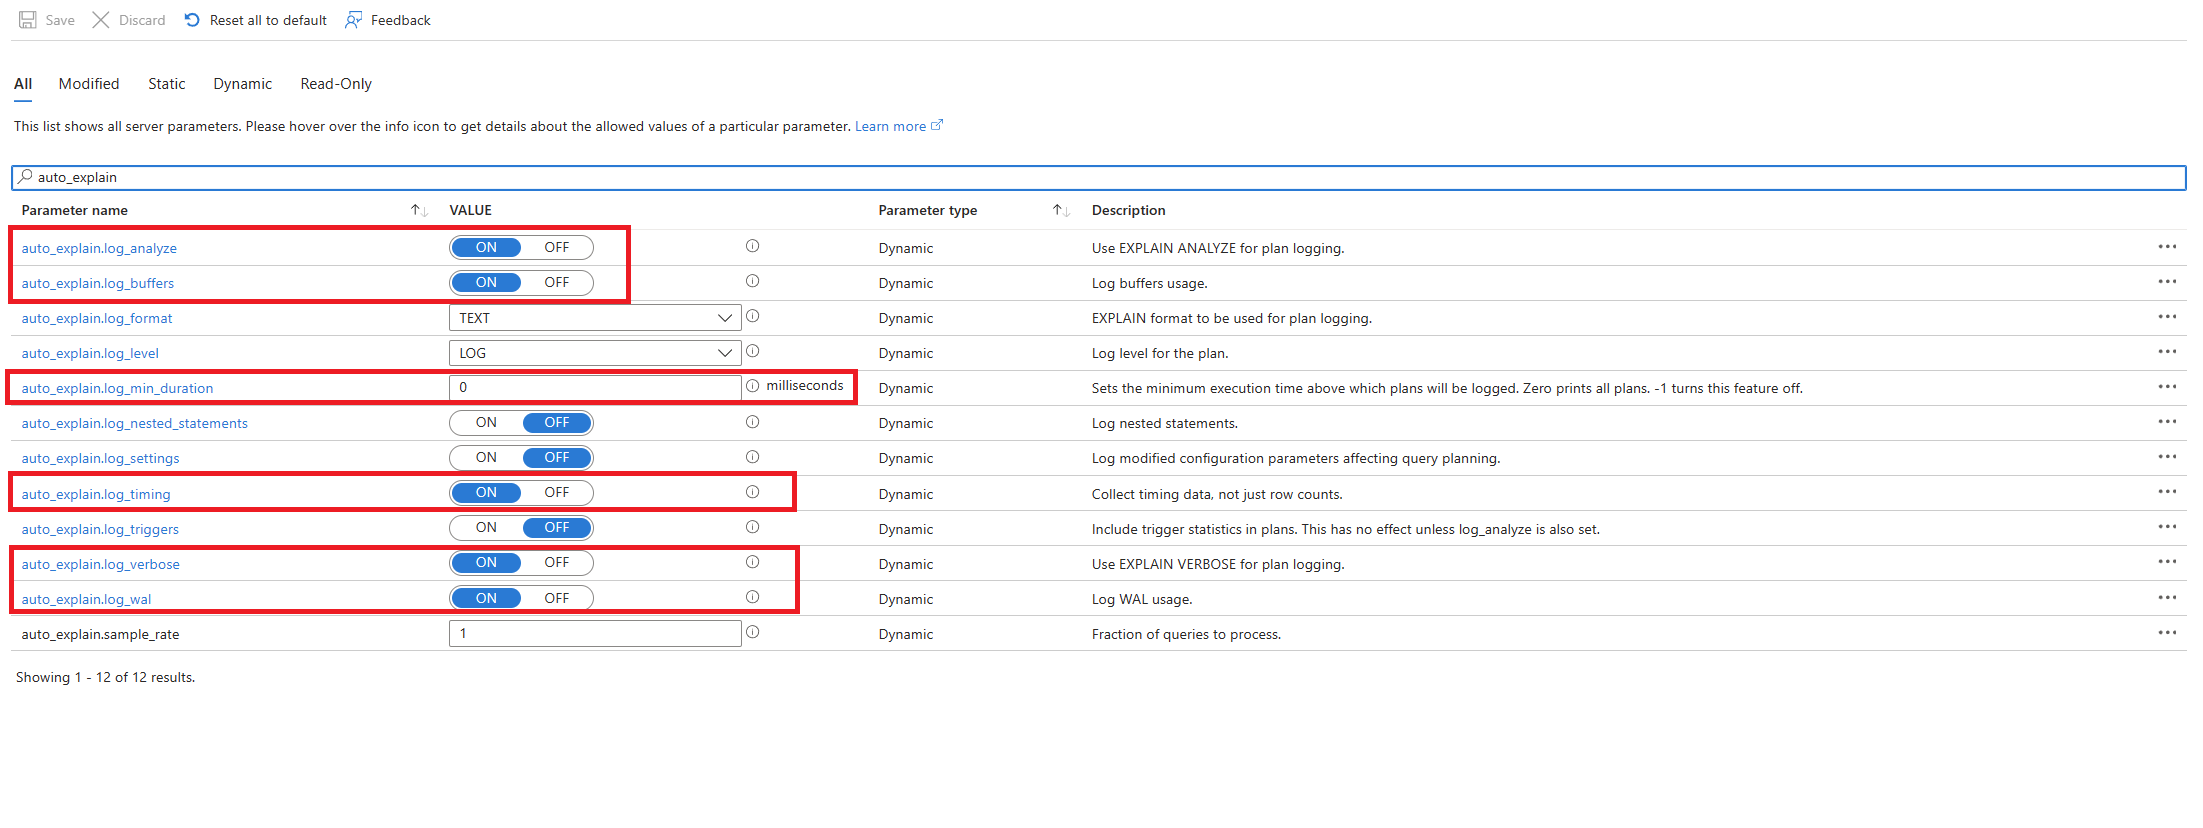
auto_explainextension by allowlisting and loading the extension.After the
auto_explainextension is configured, change the following server parameters, which control the behavior of the extension:auto_explain.log_analyzetoON.auto_explain.log_bufferstoON.auto_explain.log_min_durationaccording to what's reasonable in your scenario.auto_explain.log_timingtoON.auto_explain.log_verbosetoON.

Note
If you set auto_explain.log_min_duration to 0, the extension starts logging all queries being executed on the server. This might affect performance of the database. Proper due diligence must be made to come to a value, which is considered slow on the server. For example, if all queries complete in less than 30 seconds, and that's acceptable for your application, then it's advised to update the parameter to 30,000 milliseconds. This would then log any query, which takes longer than 30 seconds to complete.
Identify slow query
With troubleshooting guides and auto_explain extension in place, we describe the scenario with the help of an example.
We have a scenario where CPU utilization spikes to 90% and want to determine the cause of the spike. To debug the scenario, follow these steps:
As soon as you're alerted by a CPU scenario, in the resource menu of the affected instance of Azure Database for PostgreSQL flexible server, under the Monitoring section, select Troubleshooting guides.
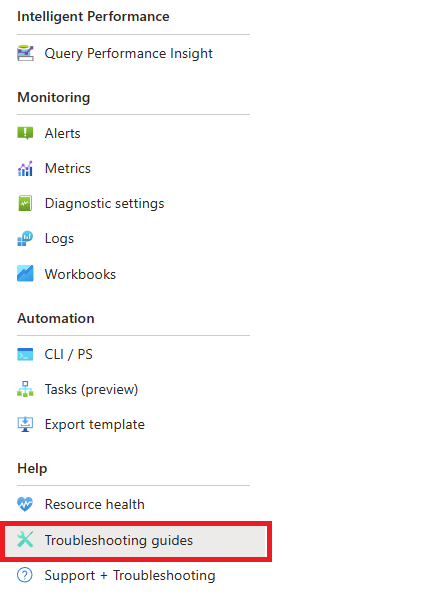
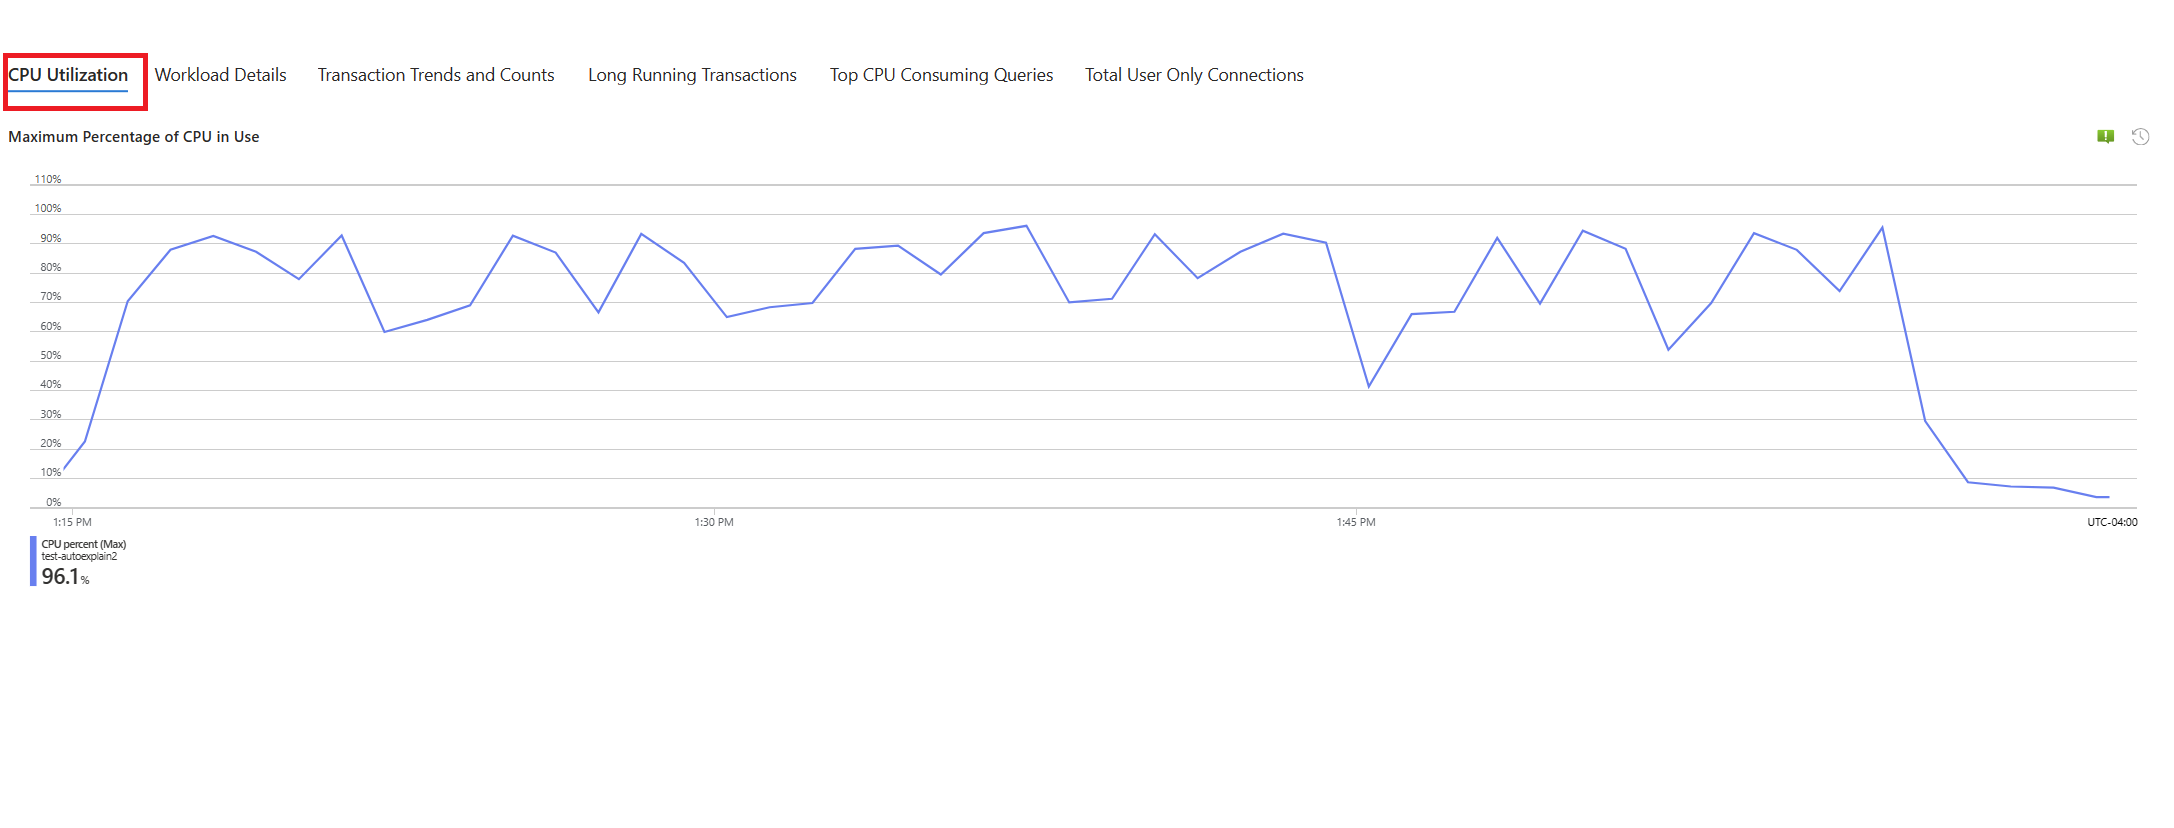
Select the CPU tab. The Optimizing high CPU utilization troubleshooting guide opens.
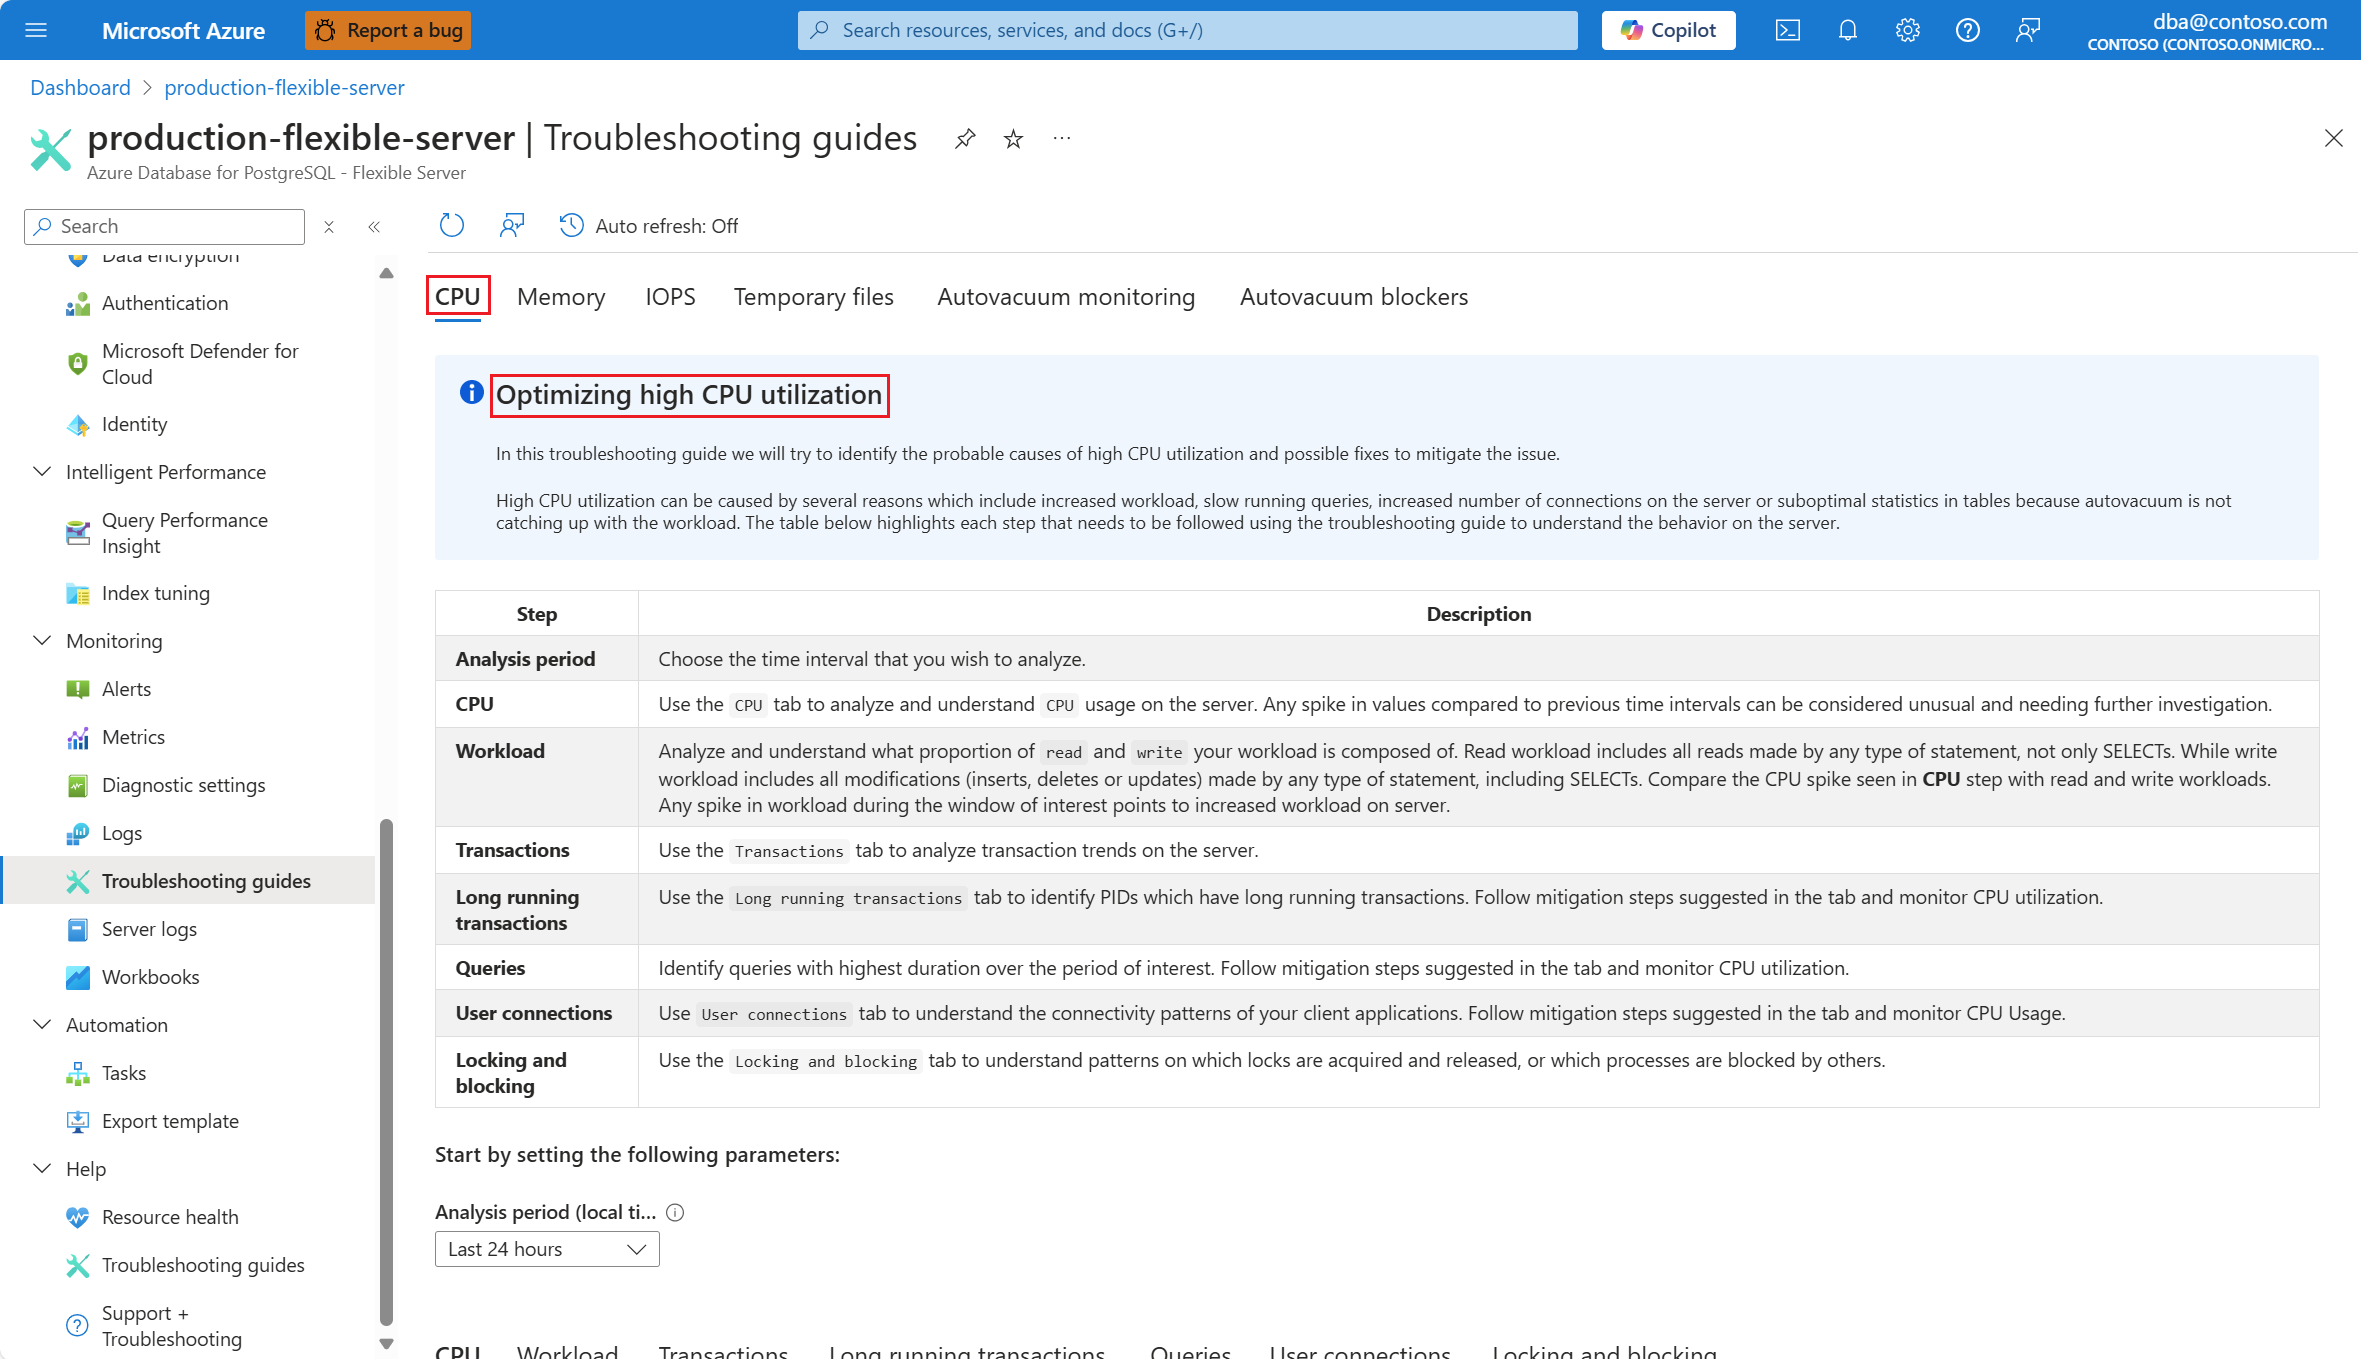
From the Analysis period (local time) dropdown, select the time range on which you want to focus the analysis.
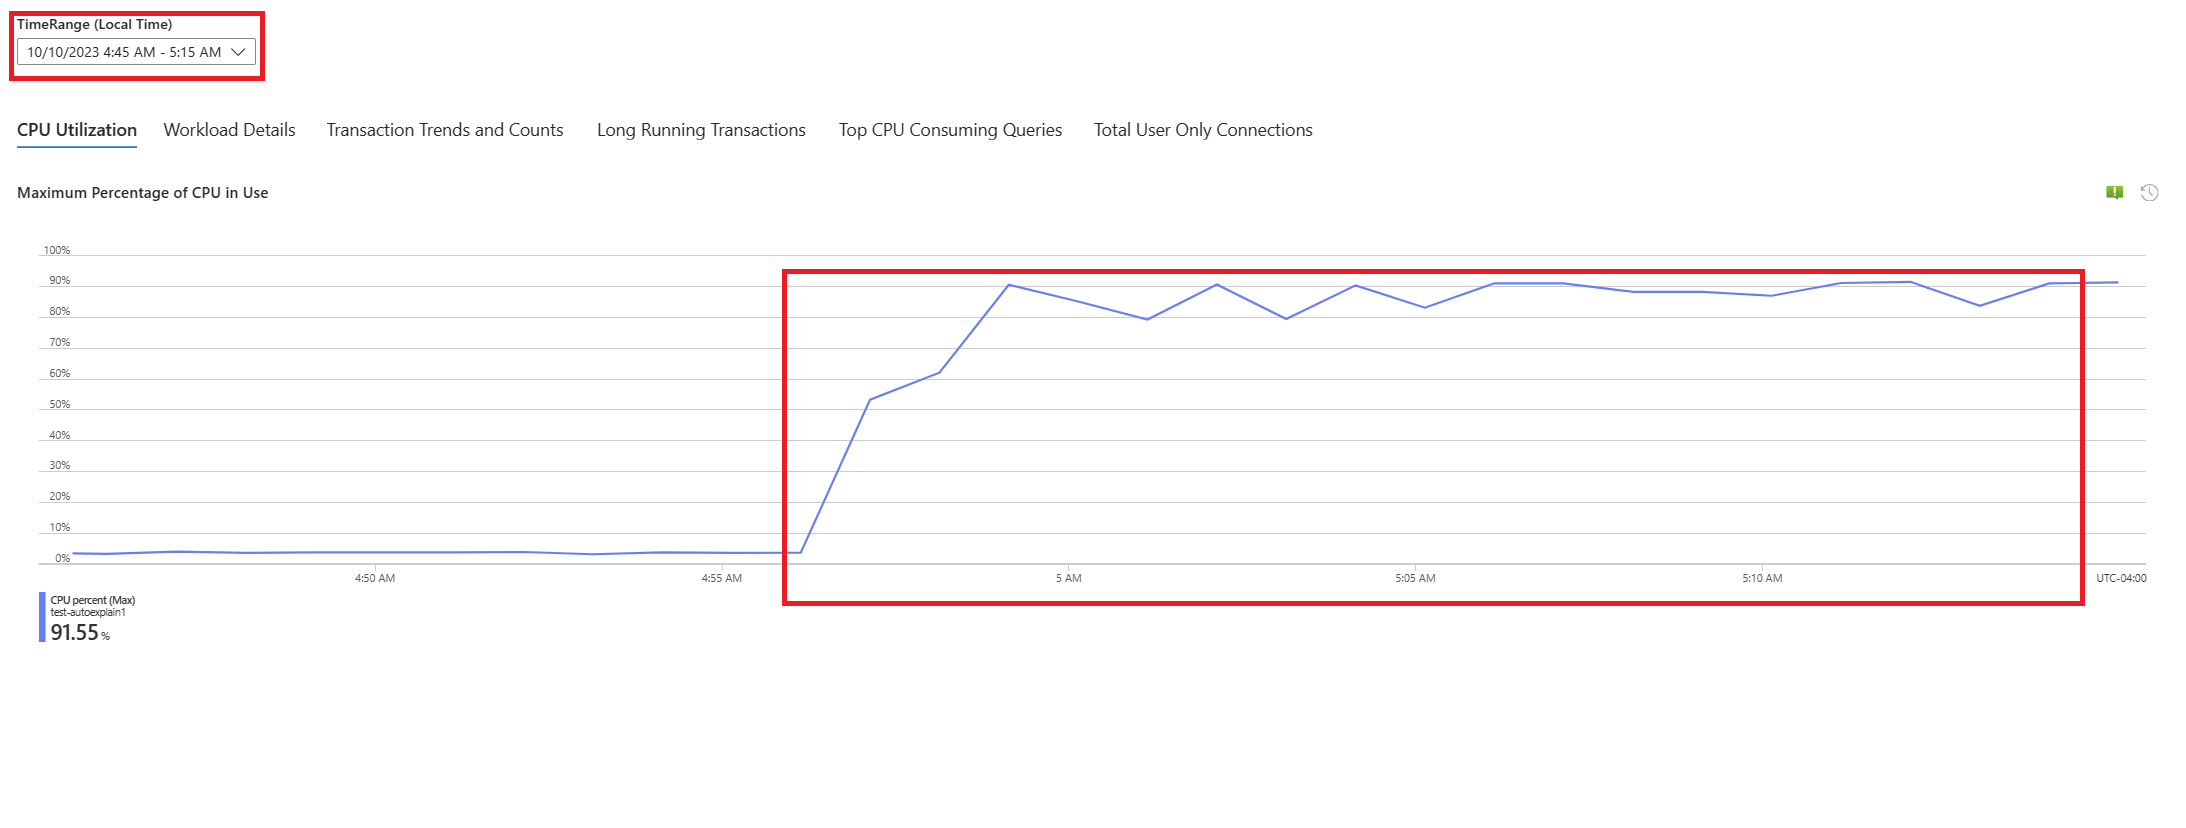
Select Queries tab. It shows details of all the queries that ran in the interval where 90% CPU utilization was seen. From the snapshot, it looks like the query with the slowest average execution time during the time interval was ~2.6 minutes, and the query ran 22 times during the interval. That query is most likely the cause of the CPU spikes.
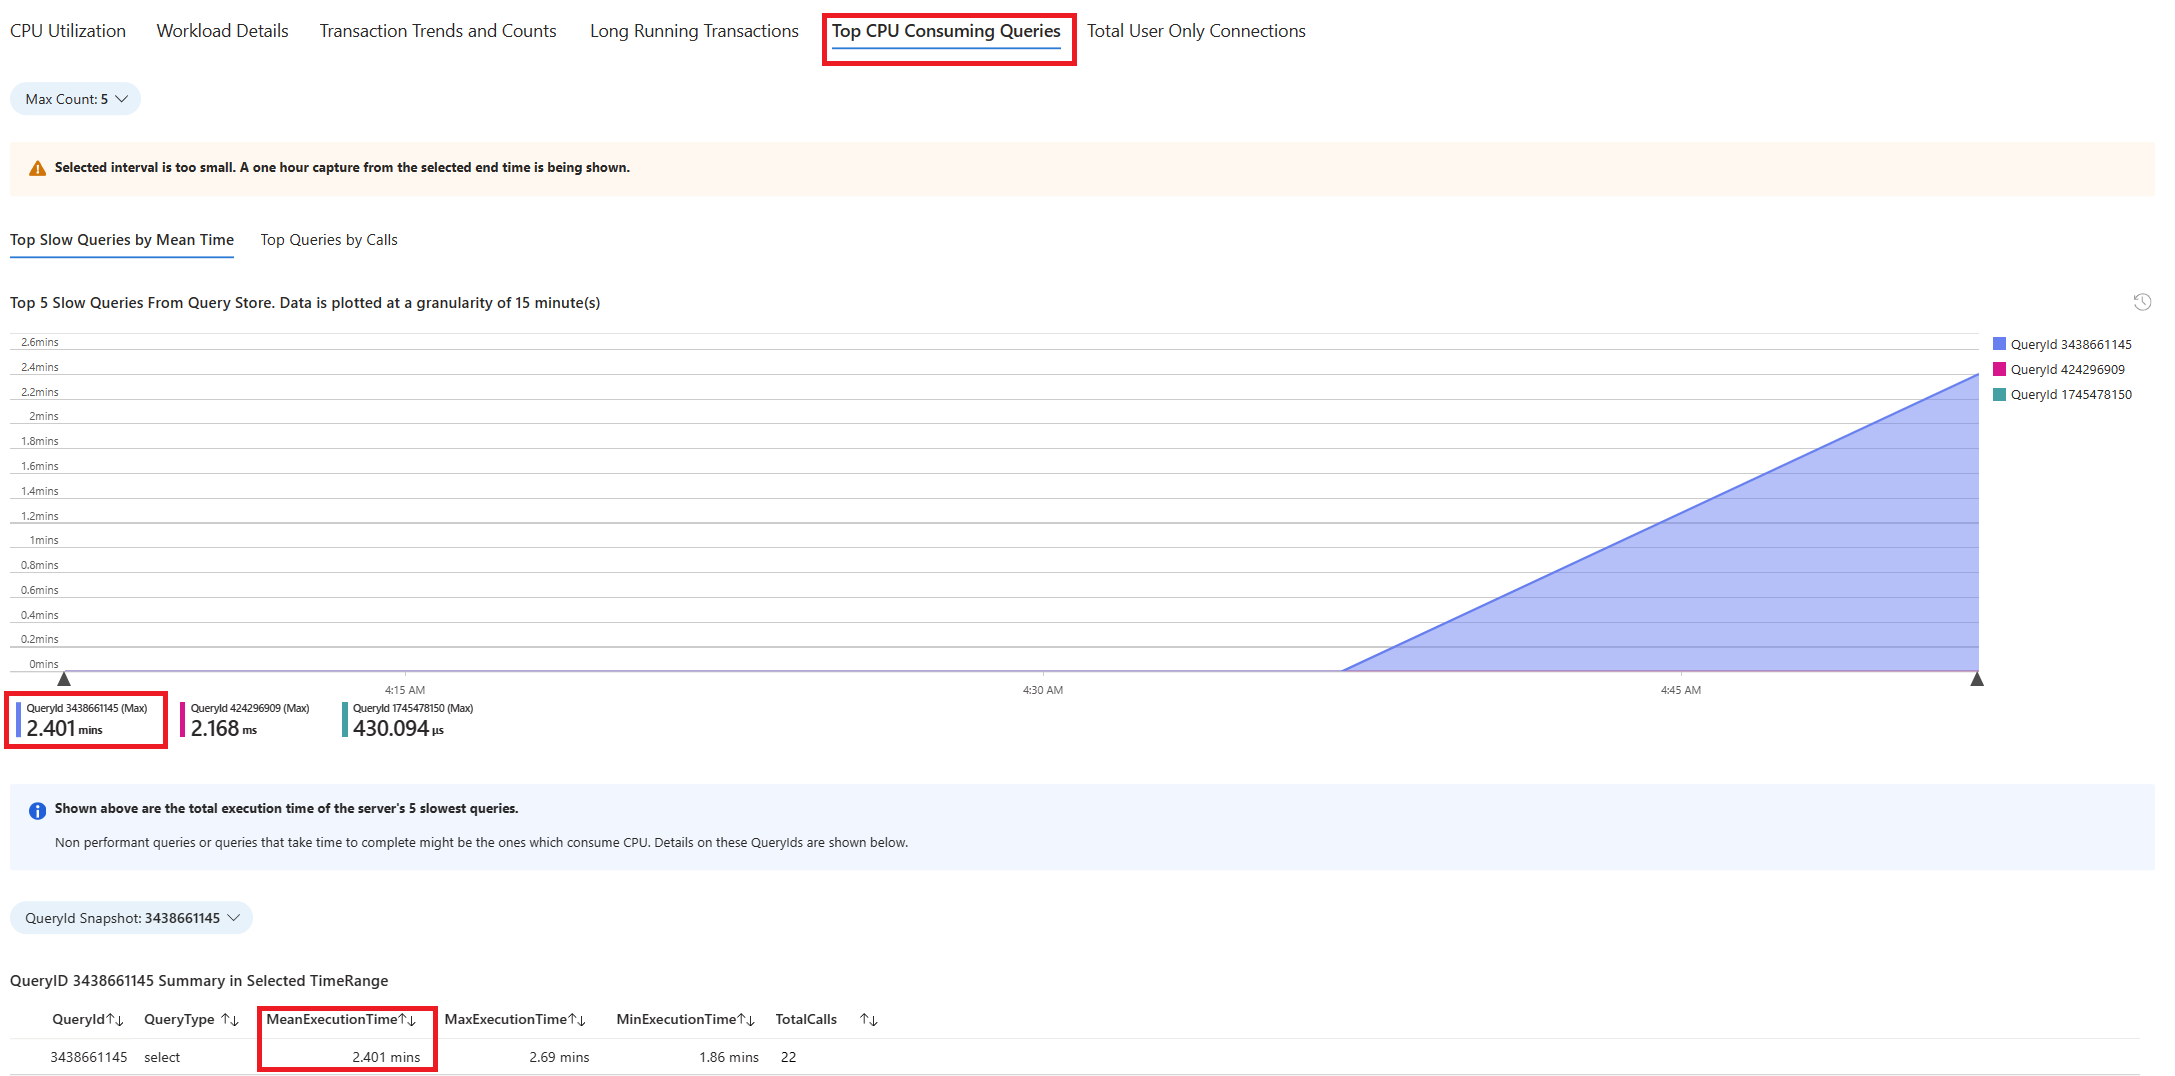
To retrieve the actual query text, connect to the
azure_sysdatabase and execute the following query.


    psql -h <server>.postgres.database.azure.com -U <user> -d azure_sys

     SELECT query_sql_text
     FROM query_store.query_texts_view
     WHERE query_text_id = <query_id>;
- In the example considered, the query that was found slow was:
SELECT  c_id, SUM(c_balance) AS total_balance
FROM customer
GROUP BY c_w_id, c_id
ORDER BY c_w_id;
To understand what exact explain plan was generated, use Azure Database for PostgreSQL logs. Every time the query completed execution during that time window, the
auto_explainextension should write an entry in the logs. In the resource menu, under the Monitoring section, select Logs.
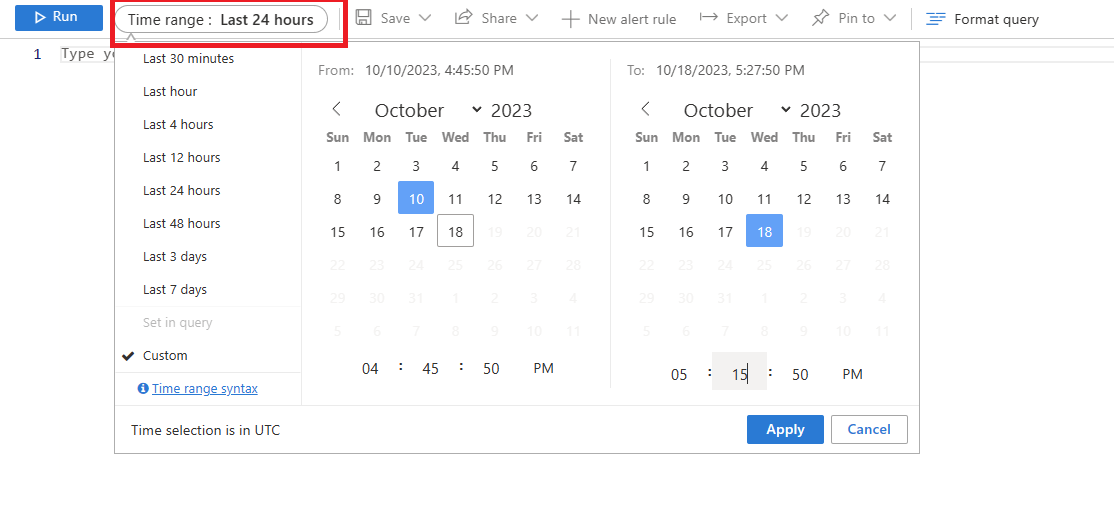
Select the time range where 90% CPU Utilization was found.
Execute the following query to retrieve the output of EXPLAIN ANALYZE for the query identified.

AzureDiagnostics
| where Category contains  'PostgreSQLLogs'
| where Message contains "<snippet of SQL text identified or name of any of the tables referenced in the query>"
| project TimeGenerated, Message
The message column stores the execution plan as shown in this output:
2024-11-10 19:56:46 UTC-6525a8e7.2e3d-LOG: duration: 150692.864 ms plan:

Query Text: SELECT c_id, SUM(c_balance) AS total_balance
FROM customer
GROUP BY c_w_id,c_id
order by c_w_id;
GroupAggregate (cost=1906820.83..2131820.83 rows=10000000 width=40) (actual time=70930.833..129231.950 rows=10000000 loops=1)
Output: c_id, sum(c_balance), c_w_id
Group Key: customer.c_w_id, customer.c_id
Buffers: shared hit=44639 read=355362, temp read=77521 written=77701
-> Sort (cost=1906820.83..1931820.83 rows=10000000 width=13) (actual time=70930.821..81898.430 rows=10000000 loops=1)
Output: c_id, c_w_id, c_balance
Sort Key: customer.c_w_id, customer.c_id
Sort Method: external merge Disk: 225104kB
Buffers: shared hit=44639 read=355362, temp read=77521 written=77701
-> Seq Scan on public.customer (cost=0.00..500001.00 rows=10000000 width=13) (actual time=0.021..22997.697 rows=10000000 loops=1)
Output: c_id, c_w_id, c_balance
The query ran for ~2.5 minutes, as shown in troubleshooting guide. The duration value of 150692.864 ms from the execution plan output fetched confirms it. Use the output of EXPLAIN ANALYZE to troubleshoot further and tune the query.
Note
Observe that the query ran 22 times during the interval, and the logs shown contain such entries captured during the interval.
Identify slow-running query in a stored procedure
With troubleshooting guides and auto_explain extension in place, we explain the scenario with the help of an example.
We have a scenario where CPU utilization spikes to 90% and want to determine the cause of the spike. To debug the scenario, follow these steps:
As soon as you're alerted by a CPU scenario, in the resource menu of the affected instance of Azure Database for PostgreSQL flexible server, under the Monitoring section, select Troubleshooting guides.
Select the CPU tab. The Optimizing high CPU utilization troubleshooting guide opens.
From the Analysis period (local time) dropdown, select the time range on which you want to focus the analysis.
Select Queries tab. It shows details of all the queries that ran in the interval where 90% CPU utilization was seen. From the snapshot, it looks like the query with the slowest average execution time during the time interval was ~2.6 minutes, and the query ran 22 times during the interval. That query is most likely the cause of the CPU spikes.
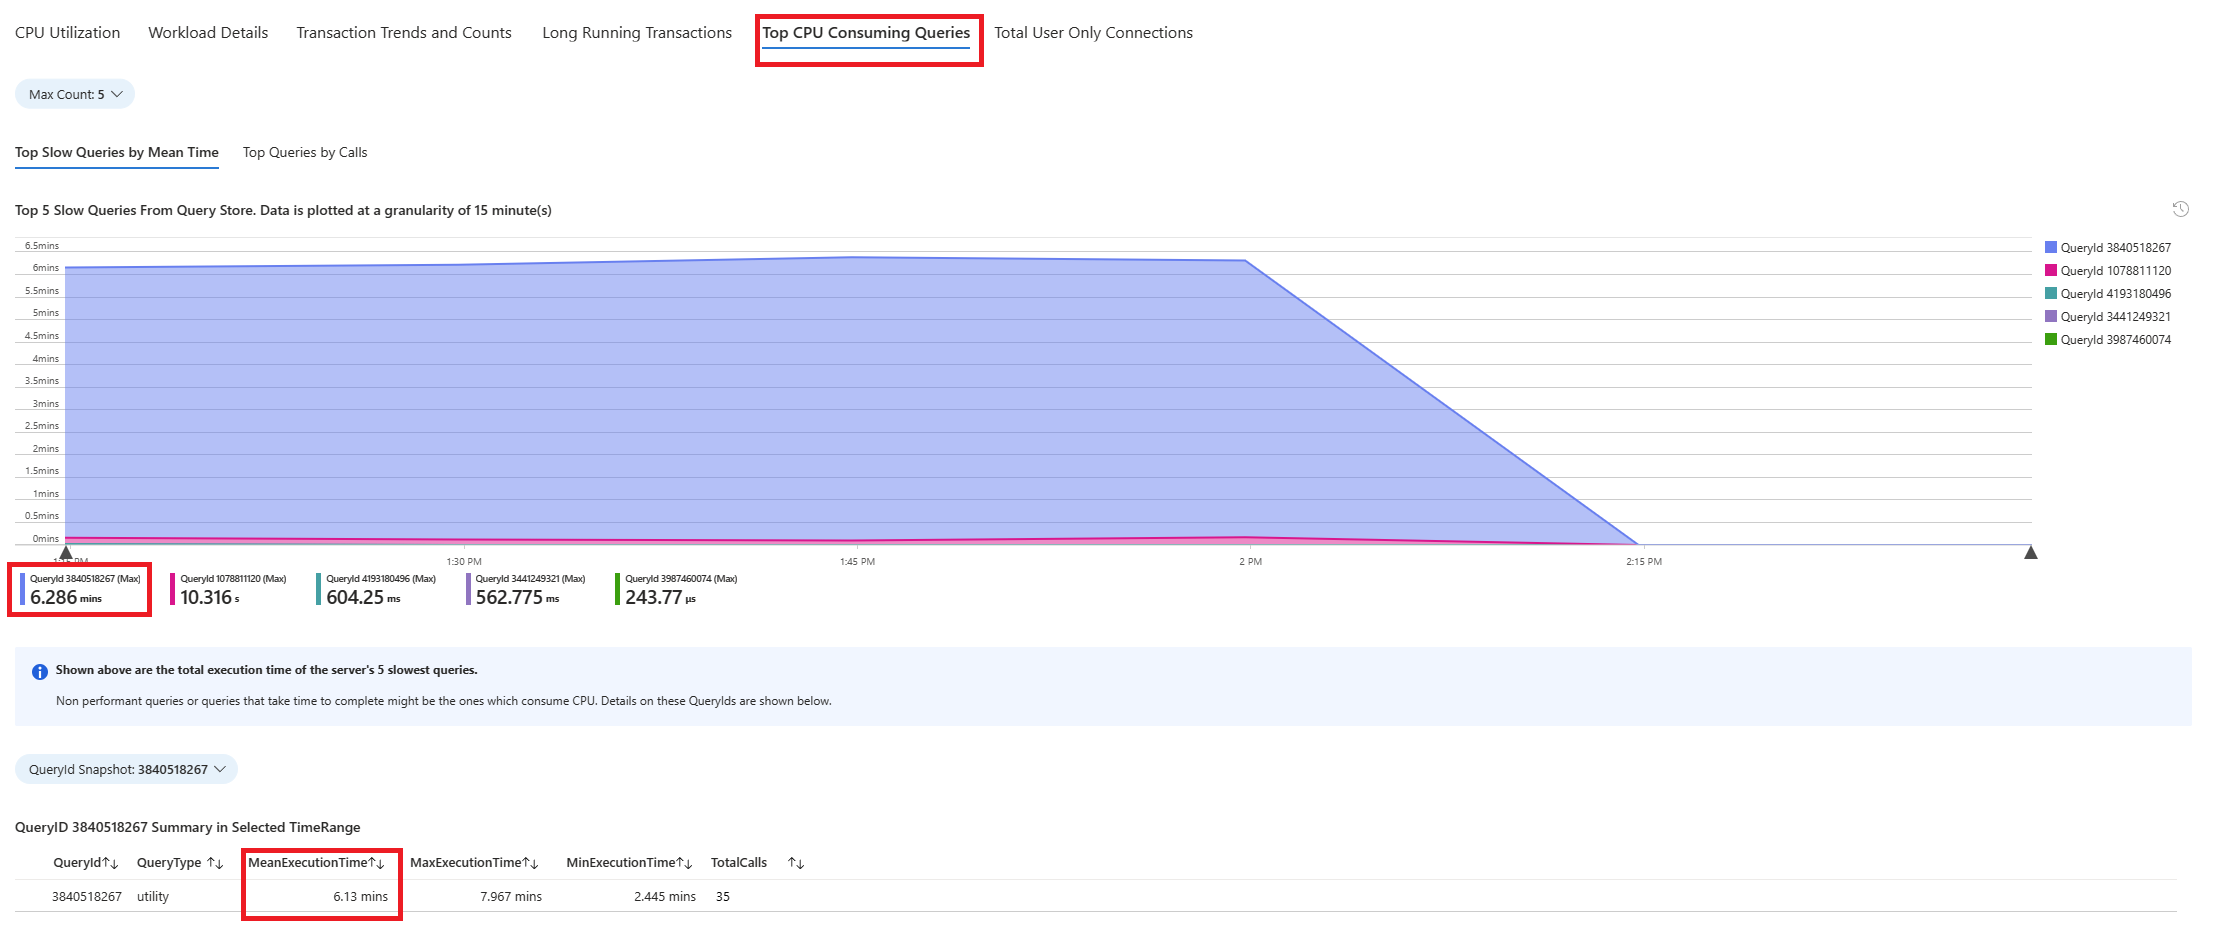
Connect to azure_sys database and execute the query to retrieve actual query text using the below script.


    psql -h <server>.postgres.database.azure.com -U <user> -d azure_sys

     SELECT query_sql_text
     FROM query_store.query_texts_view
     WHERE query_text_id = <query_id>;
- In the example considered, the query that was found slow was a stored procedure:
call autoexplain_test ();
- To understand what exact explain plan was generated, use Azure Database for PostgreSQL logs. Every time the query completed execution during that time window, the
auto_explainextension should write an entry in the logs. In the resource menu, under the Monitoring section, select Logs. Then, in Time range:, select the time window where you want to focus the analysis.

- Execute the following query to retrieve the explain analyze output of the query identified.
AzureDiagnostics
| where Category contains  'PostgreSQLLogs'
| where Message contains "<snippet of SQL text identified or name of any of the tables referenced in the query>"
| project TimeGenerated, Message
The procedure has multiple queries, which are highlighted below. The explain analyze output of every query used in the stored procedure is logged in to analyze further and troubleshoot. The execution time of the queries logged can be used to identify the slowest queries that are part of the stored procedure.
2024-11-10 17:52:45 UTC-6526d7f0.7f67-LOG: duration: 38459.176 ms plan:

Query Text: insert into customer_balance SELECT c_id, SUM(c_balance) AS total_balance FROM customer GROUP BY c_w_id,c_id order by c_w_id
Insert on public.customer_balance (cost=1906820.83..2231820.83 rows=0 width=0) (actual time=38459.173..38459.174 rows=0 loops=1)Buffers: shared hit=10108203 read=454055 dirtied=54058, temp read=77521 written=77701 WAL: records=10000000 fpi=1 bytes=640002197
    -> Subquery Scan on "*SELECT*" (cost=1906820.83..2231820.83 rows=10000000 width=36) (actual time=20415.738..29514.742 rows=10000000 loops=1)
        Output: "*SELECT*".c_id, "*SELECT*".total_balance Buffers: shared hit=1 read=400000, temp read=77521 written=77701
            -> GroupAggregate (cost=1906820.83..2131820.83 rows=10000000 width=40) (actual time=20415.737..28574.266 rows=10000000 loops=1)
                Output: customer.c_id, sum(customer.c_balance), customer.c_w_id Group Key: customer.c_w_id, customer.c_id Buffers: shared hit=1 read=400000, temp read=77521 written=77701
                -> Sort (cost=1906820.83..1931820.83 rows=10000000 width=13) (actual time=20415.723..22023.515 rows=10000000 loops=1)
                    Output: customer.c_id, customer.c_w_id, customer.c_balance Sort Key: customer.c_w_id, customer.c_id Sort Method: external merge Disk: 225104kB Buffers: shared hit=1 read=400000, temp read=77521 written=77701
                     -> Seq Scan on public.customer (cost=0.00..500001.00 rows=10000000 width=13) (actual time=0.310..15061.471 rows=10000000 loops=1) Output: customer.c_id, customer.c_w_id, customer.c_balance Buffers: shared hit=1 read=400000

2024-11-10 17:52:07 UTC-6526d7f0.7f67-LOG: duration: 61939.529 ms plan:
Query Text: delete from customer_balance
Delete on public.customer_balance (cost=0.00..799173.51 rows=0 width=0) (actual time=61939.525..61939.526 rows=0 loops=1) Buffers: shared hit=50027707 read=620942 dirtied=295462 written=71785 WAL: records=50026565 fpi=34 bytes=2711252160
    -> Seq Scan on public.customer_balance (cost=0.00..799173.51 rows=15052451 width=6) (actual time=3185.519..35234.061 rows=50000000 loops=1)
        Output: ctid Buffers: shared hit=27707 read=620942 dirtied=26565 written=71785 WAL: records=26565 fpi=34 bytes=11252160

2024-11-10 17:51:05 UTC-6526d7f0.7f67-LOG: duration: 10387.322 ms plan:
Query Text: select max(c_id) from customer
Finalize Aggregate (cost=180185.84..180185.85 rows=1 width=4) (actual time=10387.220..10387.319 rows=1 loops=1) Output: max(c_id) Buffers: shared hit=37148 read=1204 written=69
    -> Gather (cost=180185.63..180185.84 rows=2 width=4) (actual time=10387.214..10387.314 rows=1 loops=1)
        Output: (PARTIAL max(c_id)) Workers Planned: 2 Workers Launched: 0 Buffers: shared hit=37148 read=1204 written=69
        -> Partial Aggregate (cost=179185.63..179185.64 rows=1 width=4) (actual time=10387.012..10387.013 rows=1 loops=1) Output: PARTIAL max(c_id) Buffers: shared hit=37148 read=1204 written=69
            -> Parallel Index Only Scan using customer_i1 on public.customer (cost=0.43..168768.96 rows=4166667 width=4) (actual time=0.446..7676.356 rows=10000000 loops=1)
               Output: c_w_id, c_d_id, c_id Heap Fetches: 24 Buffers: shared hit=37148 read=1204 written=69
Note
For demonstration purposes the EXPLAIN ANALYZE output of only a few queries used in the procedure are shown. The idea is one can gather EXPLAIN ANALYZE output of all queries from the logs, and identify the slowest of those and try to tune them.
Related content
- Troubleshoot high CPU utilization in Azure Database for PostgreSQL.
- Troubleshoot high IOPS utilization in Azure Database for PostgreSQL.
- Troubleshoot high memory utilization in Azure Database for PostgreSQL.
- Server parameters in Azure Database for PostgreSQL.
- Autovacuum tuning in Azure Database for PostgreSQL.