Monitor data map population in Microsoft Purview
In Microsoft Purview, you can scan various types of data sources and view the scan status over time. You can also connect other services with Microsoft Purview and view the trends of the ingested assets/relationship. This article outlines how to monitor and get a bird's eye view of the data map population.
Monitor scan runs
Open the Microsoft Purview governance portal by:
- Browsing directly to https://web.purview.azure.com and selecting your Microsoft Purview account.
- Opening the Azure portal, searching for and selecting the Microsoft Purview account. Selecting the the Microsoft Purview governance portal button.
Open your Microsoft Purview account and select Data map -> Monitoring. You need to have Data source admin role on any collection to access this page. And you can see the scan runs that belong to the collections on which you have data source admin privilege.
The high-level KPIs show total scan runs within a period. The time period is defaulted at last 30 days, you can also choose to select last seven days. Based on the time filter selected, you can see the distribution of succeeded, completed with exceptions, failed, canceled, and in progress scan runs by week or by the day in the graph. It's the scan run end-to-end status including the discovery and ingestion phases. Learn more about the status details in scan run details section.
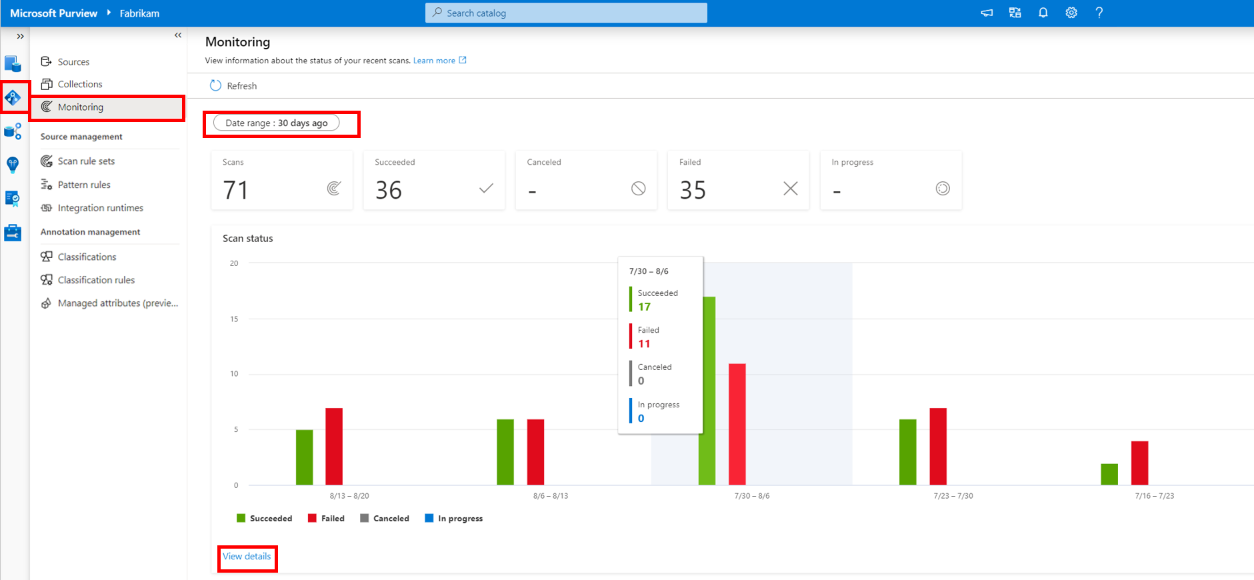
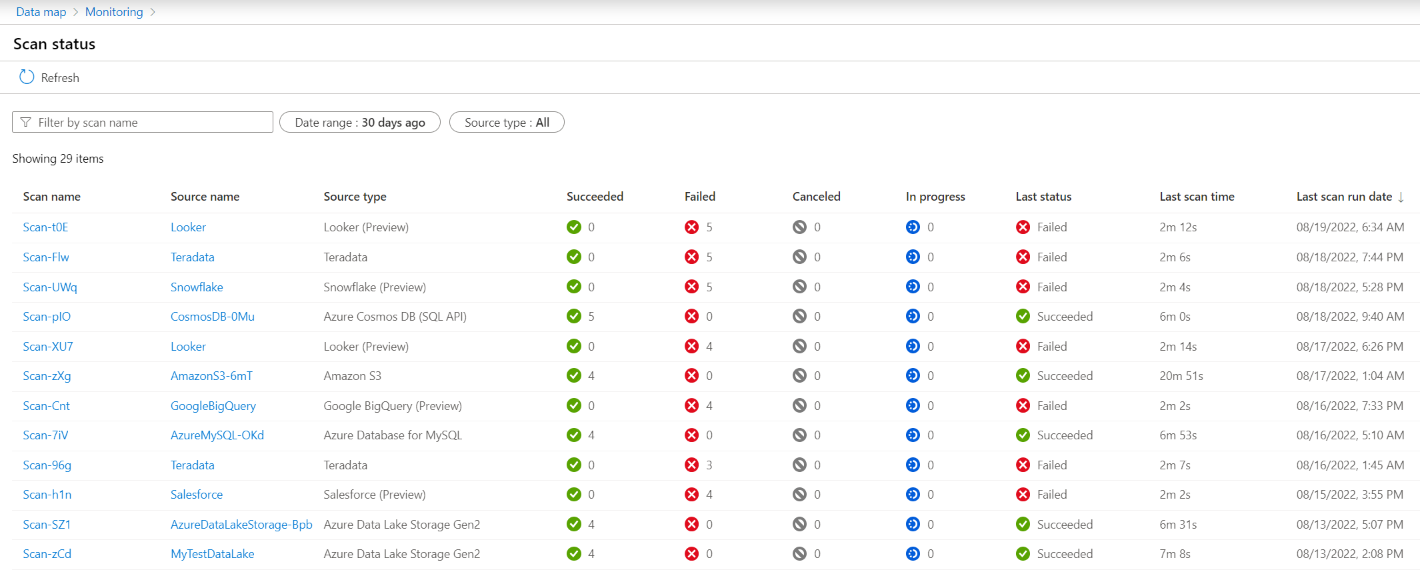
At the bottom of the graph, there's a View more link for you to explore further. The link opens the Scan status page. Here you can see a scan name and the number of times it has status of succeeded, completed with exceptions, failed, or canceled in the time period. You can also filter the list by source types.
You can explore a specific scan further by selecting the scan name. It connects you to the scan history page, where you can find the list of scan runs with more execution details.
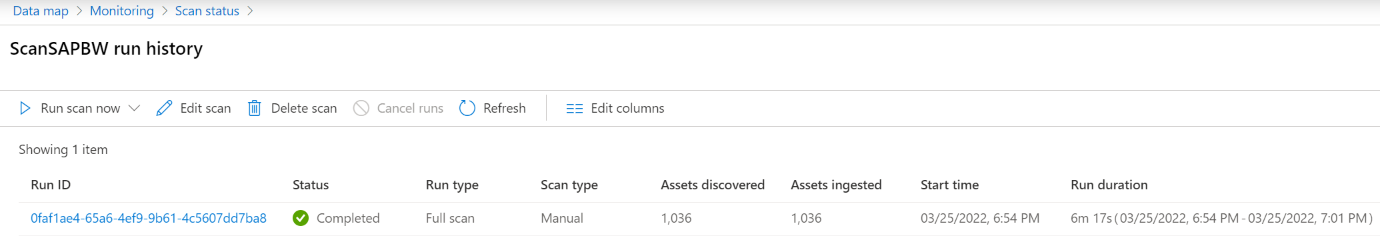
You can click into the run ID to check more about the scan run details.


Known limitations:
Currently, this monitoring experience doesn't include the following information. You can check the corresponding scan run details.
- Lineage extraction scan runs for Azure SQL Database aren't covered.
- For scans of Azure Synapse Analytics workspace, Azure subscription/resource group, and AWS account, it only captures the parent scan run's status/count but not child scan runs' per resource.
Scan run details
You can navigate to scan run history for a given scan from different places:
- Go to Data map -> Monitoring as described in Monitor scan runs section.
- Go to Data map -> Sources -> select the desired data source -> see Scans, Recent scans or Recent failed scans.
- Go to Data map -> Collections -> select the desired collection -> Scans -> select the scan name that you want to view more.
The retention of the scan run history is 90 days.
You can click the run ID to check more about the scan run details:

The section on top provides an overview of the scan run, including the following information:
- Run ID: A GUID used to identify this particular scan run.
- Scan type: Manual or scheduled scan.
- Run type: Full or incremental scan.
- Scan rule set: The scan rule set used in the run, if applicable.
- Scan run status: Overall scan status. It combines the metadata discovery and ingestion phases' status.
- Scan run duration: The end-to-end execution duration and the start/end time.
Metadata discovery section summarizes the metrics for discovery phase that Purview connects to the source, extracts the metadata/lineage and classifies the data.
Discovery status:
Status Description Completed The metadata discovery succeeds. Completed with exceptions The metadata discovery completes, while some underlying operation fails that may cause asset, metadata or classification missing in the scan result. You can view details in the exception logs. Failed The metadata discovery fails. You can check the error details by clicking the "More info" link next to it. Canceled The scan run is canceled by user. In Progress The metadata discovery is running in progress. Queued The metadata discovery is waiting for available integration runtime resource.
If you use self-hosted integration runtime, note each node can run a number of concurrent scans at the same time depending on your machine specification (CPU and memory). More scans are in Queued status.Throttled The metadata discovery is being throttled. It means this Microsoft Purview account at the moment has more ongoing scan runs than the allowed max concurrent count. Learn more about the limit here. This particular scan run is waiting and will be executed once your other ongoing scan(s) finishes. The scan run isn't charged during "Throttled" or "Queued" status.
Assets discovered: The number of assets enumerated from the source. For both full and incremental scans, it includes all assets in the configured scope, regardless of whether they're existing assets or newly created/updated assets since the last scan run. While for incremental scan, detailed metadata is extracted only for newly created or updated assets additionally.
Assets classified: The number of assets sampled to classify the data, regardless of whether the assets have any matching classification or not. It's a subset of the discovered assets based on the sampling mechanism. For incremental scan, only newly created or updated assets may be selected for classification.
Duration: The discovery phase duration and the start/end time.
Metadata ingestion section summarizes the metrics for ingestion phase that Purview populates the data map with the identified metadata and relationship.
Ingestion status:
Status Description Completed All of the assets and relationships are ingested into the data map successfully. Completed with exceptions (previous "Partially completed") Partial of the assets and relationships are ingested into the data map successfully, while some fail. You can view details in the exception logs. Failed The ingestion phase fails. Canceled The scan run is canceled by user, thus the ingestion is canceled along. In Progress The ingestion is running in progress. Queued The ingestion is waiting for available service resource or waiting for scan to discover metadata. Assets ingested: The number of assets ingested into the data map. For incremental scan, it only includes the newly created or updated assets, in which case may be less than the "assets discovered" count. When scanning file-based source, it's the raw assets count before resource set aggregation.
Relationships ingested: The number of relationships ingested into the data map. It includes lineage and other relationships like foreign key relationships.
Duration: The ingestion duration and the start/end time.
View the exception log (preview)
Important
This feature is currently in preview. The Supplemental Terms of Use for Microsoft Azure Previews include additional legal terms that apply to Azure features that are in beta, in preview, or otherwise not yet released into general availability.
When some assets or relationship fail to discover from source or fail to ingest into data map during scan run. For example, status ends up as completed with exceptions, you can:
- Select the scan.
- Select the run ID of a scan with failures or exceptions.
- Select Download log button in the scan run details panel. It provides you with the exception log files that capture the details of the failures.
Discovery phase log
The following table shows the schema of a discovery phase log file.
| Column | Description |
|---|---|
| TimeStamp | The UTC timestamp when the discovery operation happens. |
| ErrorCode | Error code of the exception. |
| OperationName | It contains the following values: - Enumerate: Indicates the operation of enumerating the child objects under a given scope, e.g. list the folders/files under a container, list the tables under a database. When there's a failure, the operation item's child objects aren't included in the scan result. - GetMetadata: Indicates the operation of extracting the metadata for an object, e.g. table, file, etc. When there's a failure, the asset of the operation item may not contain full metadata. - SampleResourceSet: Indicates the operation of sampling the latest file matching the resource set pattern when you scan file-based data sources. When there's a failure, the resource set that the operation item belongs to may miss classification/schema. - ReadData: Indicates the operation of retrieving sample data from the source. When there's a failure, the operation item is not classified. If it's a file-based source, it may also miss schema. - Classify: Indicates the operation of applying the classifications. When there's a failure, the operation item may miss classification. - GenerateAsset: Indicates the operation of converting the discovered metadata into Microsoft Purview asset. When there's a failure, usually due to system error, the asset of the operation item doesn't show up in the data map at last. |
| OperationItem | Identifier for the failed asset/relationship, usually using the fully qualified name. |
| Message | More information on which asset/relationship failed to discover due to what reason. |
Known limitations:
- The discovery phase log is supported when you use Azure integration runtime or Managed Virtual Network integration runtime for scan.
- The discovery phase log is supported when you scan Azure or Power BI data sources.
- Currently it may not capture all the exceptions happened during scan run.
Ingestion phase log
The following table shows the schema of an ingestion phase log file.
| Column | Description |
|---|---|
| TimeStamp | The UTC timestamp when the ingestion operation happens. |
| ErrorCode | Error code of the exception. |
| OperationItem | Identifier for the failed asset/relationship, usually using the fully qualified name. |
| Message | More information on which asset/relationship failed to ingest due to what reason. If there's ingestion failure for resource set, it may apply to multiple assets matching the same naming pattern, and the message includes the impacted count. |
Monitor links
You can connect other services with Microsoft Purview to establish a "link", which makes the metadata and lineage of that service's assets available to Microsoft Purview. Currently, link is supported for Azure Data Factory and Azure Synapse Analytics.
To monitor the assets and relationship ingested over the links:
Go to your Microsoft Purview account -> open Microsoft Purview governance portal -> Data map -> Monitoring -> Links. You need to have Data source admin role on any collection to access the Monitoring tab. And you can see the results that belong to the collections on which you have data source admin privilege. Permission on root collection is needed to monitor Azure Data Factory and Azure Synapse Analytics links.
You can see the high-level KPIs including total number of sources, number of ingested assets and relationship (lineage), followed by trending charts over time. You can apply more filters on the following to narrow down the results:
- Source type
- Source name
- Date range: Default is 30 days. You can also choose last seven days or a custom date range. The retention is 45 days.
The metrics are reported till the date time shown at the top right corner. And the aggregation happens hourly.
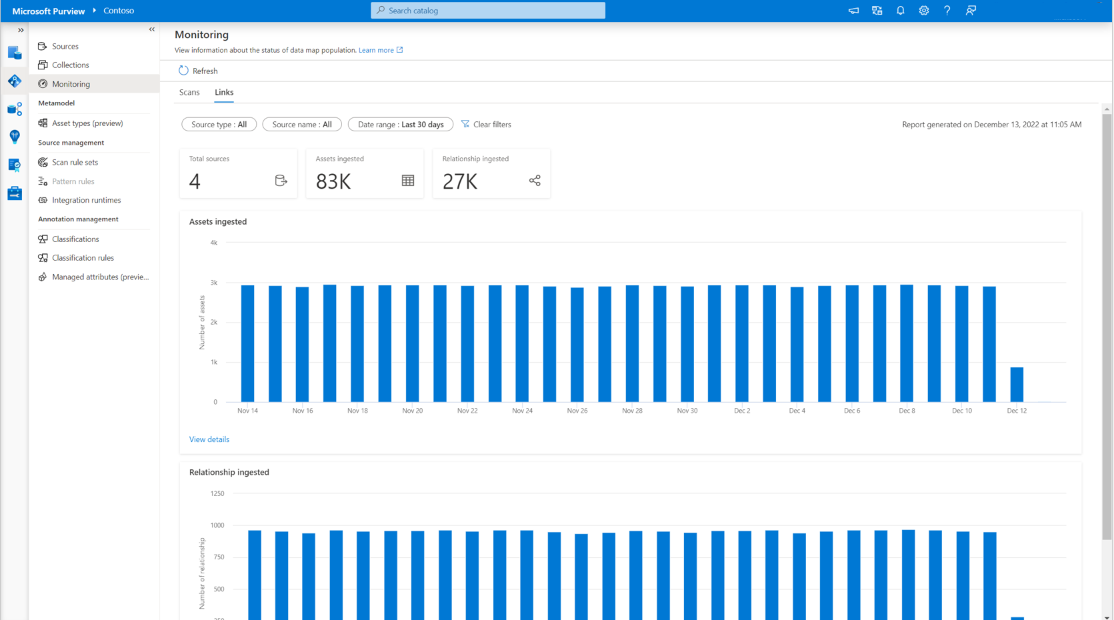
At the bottom of the graph, there's a View more link for you to explore further. In the Link status page, you can see a list of source names along with the source type, assets ingested, relationship ingested and the last run date time. The filters in the previous page are carried over, and you can further filter the list by source type, source name and date range.
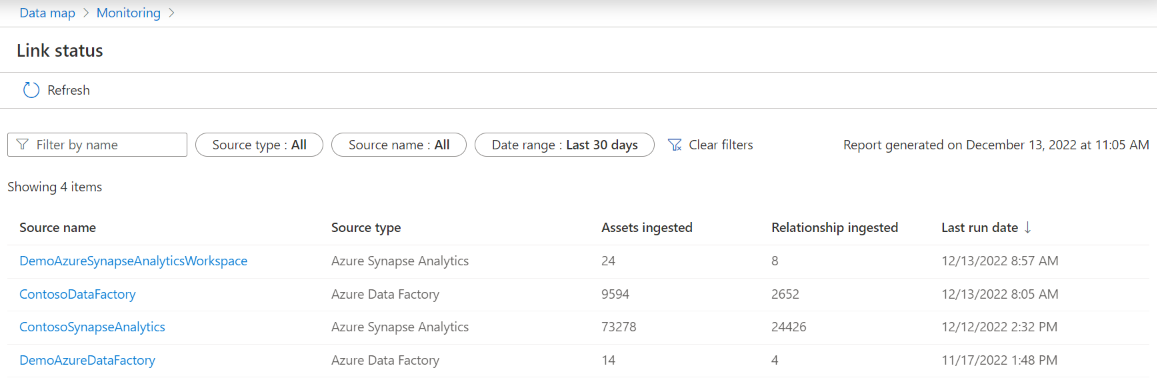
You can drill down to each source to see the next level details by clicking the source name. For example, for Azure Data Factory, it shows how each pipeline activity reports the assets and relationship to Microsoft Purview, with the name in the format of
<pipeline_name>/<activity_name>.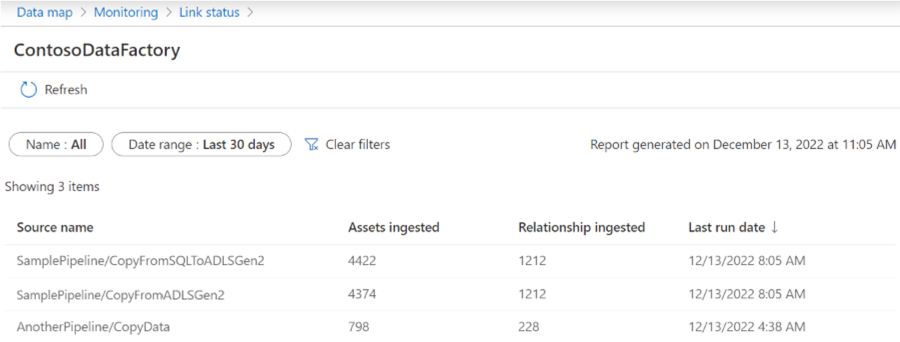


Known limitations
- For Azure Data Factory and Azure Synapse Analytics, currently this link monitoring captures the assets and relationship generated from copy activity, but not data flow and SSIS activities.
- The aggregation and date filter are in UTC time.
Scans no longer run
If your Microsoft Purview scan used to successfully run, but are now failing, check these things:
- Check the error message first to see the failure details.
- Have credentials to your resource changed or been rotated? If so, you need to update to make your scan use the correct credentials.
- Is an Azure Policy preventing updates to Storage accounts? If so follow the Microsoft Purview exception tag guide to create an exception for Microsoft Purview accounts.
- Are you using a self-hosted integration runtime? Check that it's up to date with the latest software and that it's connected to your network.