Note
Access to this page requires authorization. You can try signing in or changing directories.
Access to this page requires authorization. You can try changing directories.
Metrics are the resources that your services care about and which are provided by the nodes in the cluster. A metric is anything that you want to manage in order to improve or monitor the performance of your services. For example, you might watch memory consumption to know if your service is overloaded. Another use is to figure out whether the service could move elsewhere where memory is less constrained in order to get better performance.
Things like Memory, Disk, and CPU usage are examples of metrics. These metrics are physical metrics, resources that correspond to physical resources on the node that need to be managed. Metrics can also be (and commonly are) logical metrics. Logical metrics are things like “MyWorkQueueDepth” or "MessagesToProcess" or "TotalRecords". Logical metrics are application-defined and indirectly correspond to some physical resource consumption. Logical metrics are common because it can be hard to measure and report consumption of physical resources on a per-service basis. The complexity of measuring and reporting your own physical metrics is also why Service Fabric provides some default metrics.
Default metrics
Let’s say that you want to get started writing and deploying your service. At this point you don’t know what physical or logical resources it consumes. That’s fine! The Service Fabric Cluster Resource Manager uses some default metrics when no other metrics are specified. They are:
- PrimaryCount - count of Primary replicas on the node
- ReplicaCount - count of total stateful replicas on the node
- Count - count of all service objects (stateless and stateful) on the node
| Metric | Stateless Instance Load | Stateful Secondary Load | Stateful Primary Load | Weight |
|---|---|---|---|---|
| PrimaryCount | 0 | 0 | 1 | High |
| ReplicaCount | 0 | 1 | 1 | Medium |
| Count | 1 | 1 | 1 | Low |
For basic workloads, the default metrics provide a decent distribution of work in the cluster. In the following example, let’s see what happens when we create two services and rely on the default metrics for balancing. The first service is a stateful service with three partitions and a target replica set size of three. The second service is a stateless service with one partition and an instance count of three.
Here's what you get:
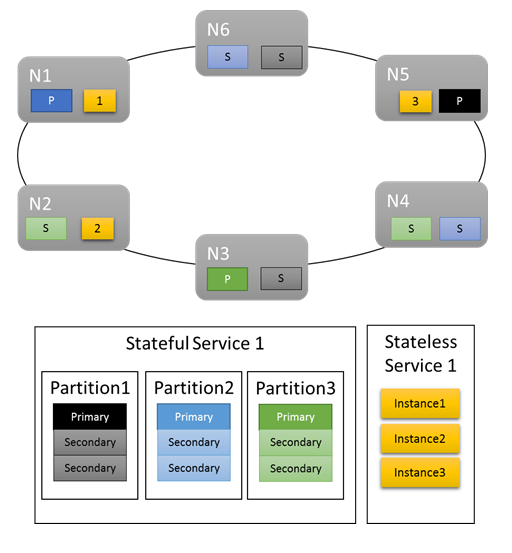
Some things to note:
- Primary replicas for the stateful service are distributed across several nodes
- Replicas for the same partition are on different nodes
- The total number of primaries and secondaries is distributed in the cluster
- The total number of service objects are evenly allocated on each node
Good!
The default metrics work great as a start. However, the default metrics will only carry you so far. For example: What's the likelihood that the partitioning scheme you picked results in perfectly even utilization by all partitions? What’s the chance that the load for a given service is constant over time, or even just the same across multiple partitions right now?
You could run with just the default metrics. However, doing so usually means that your cluster utilization is lower and more uneven than you’d like. This is because the default metrics aren't adaptive and presume everything is equivalent. For example, a Primary that is busy and one that is not both contribute "1" to the PrimaryCount metric. In the worst case, using only the default metrics can also result in overscheduled nodes resulting in performance issues. If you're interested in getting the most out of your cluster and avoiding performance issues, you need to use custom metrics and dynamic load reporting.
Custom metrics
Metrics are configured on a per-named-service-instance basis when you’re creating the service.
Any metric has some properties that describe it: a name, a weight, and a default load.
- Metric Name: The name of the metric. The metric name is a unique identifier for the metric within the cluster from the Resource Manager’s perspective.
Note
Custom metric Name should not be any of the system metric names i.e servicefabric:/_CpuCores or servicefabric:/_MemoryInMB as it can lead to undefined behavior. Starting with Service Fabric version 9.1, for existing services with these custom metric names, a health warning is issued to indicate that the metric name is incorrect.
- Weight: Metric weight defines how important this metric is relative to the other metrics for this service.
- Default Load: The default load is represented differently depending on whether the service is stateless or stateful.
- For stateless services, each metric has a single property named DefaultLoad
- For stateful services you define:
- PrimaryDefaultLoad: The default amount of this metric this service consumes when it is a Primary
- SecondaryDefaultLoad: The default amount of this metric this service consumes when it is a Secondary
Note
If you define custom metrics and you want to also use the default metrics, you need to explicitly add the default metrics back and define weights and values for them. This is because you must define the relationship between the default metrics and your custom metrics. For example, maybe you care about ConnectionCount or WorkQueueDepth more than Primary distribution. By default the weight of the PrimaryCount metric is High, so you want to reduce it to Medium when you add your other metrics to ensure they take precedence.
Defining metrics for your service - an example
Let’s say you want the following configuration:
- Your service reports a metric named "ConnectionCount”
- You also want to use the default metrics
- You’ve done some measurements and know that normally a Primary replica of that service takes up 20 units of "ConnectionCount"
- Secondaries use 5 units of "ConnectionCount"
- You know that "ConnectionCount" is the most important metric in terms of managing the performance of this particular service
- You still want Primary replicas balanced. Balancing primary replicas is generally a good idea no matter what. This helps prevent the loss of some node or fault domain from impacting a majority of primary replicas along with it.
- Otherwise, the default metrics are fine
Here’s the code that you would write to create a service with that metric configuration:
Code:
StatefulServiceDescription serviceDescription = new StatefulServiceDescription();
StatefulServiceLoadMetricDescription connectionMetric = new StatefulServiceLoadMetricDescription();
connectionMetric.Name = "ConnectionCount";
connectionMetric.PrimaryDefaultLoad = 20;
connectionMetric.SecondaryDefaultLoad = 5;
connectionMetric.Weight = ServiceLoadMetricWeight.High;

StatefulServiceLoadMetricDescription primaryCountMetric = new StatefulServiceLoadMetricDescription();
primaryCountMetric.Name = "PrimaryCount";
primaryCountMetric.PrimaryDefaultLoad = 1;
primaryCountMetric.SecondaryDefaultLoad = 0;
primaryCountMetric.Weight = ServiceLoadMetricWeight.Medium;

StatefulServiceLoadMetricDescription replicaCountMetric = new StatefulServiceLoadMetricDescription();
replicaCountMetric.Name = "ReplicaCount";
replicaCountMetric.PrimaryDefaultLoad = 1;
replicaCountMetric.SecondaryDefaultLoad = 1;
replicaCountMetric.Weight = ServiceLoadMetricWeight.Low;

StatefulServiceLoadMetricDescription totalCountMetric = new StatefulServiceLoadMetricDescription();
totalCountMetric.Name = "Count";
totalCountMetric.PrimaryDefaultLoad = 1;
totalCountMetric.SecondaryDefaultLoad = 1;
totalCountMetric.Weight = ServiceLoadMetricWeight.Low;

serviceDescription.Metrics.Add(connectionMetric);
serviceDescription.Metrics.Add(primaryCountMetric);
serviceDescription.Metrics.Add(replicaCountMetric);
serviceDescription.Metrics.Add(totalCountMetric);

await fabricClient.ServiceManager.CreateServiceAsync(serviceDescription);
PowerShell:
New-ServiceFabricService -ApplicationName $applicationName -ServiceName $serviceName -ServiceTypeName $serviceTypeName –Stateful -MinReplicaSetSize 3 -TargetReplicaSetSize 3 -PartitionSchemeSingleton –Metric @("ConnectionCount,High,20,5”,"PrimaryCount,Medium,1,0”,"ReplicaCount,Low,1,1”,"Count,Low,1,1”)
Note
The above examples and the rest of this document describe managing metrics on a per-named-service basis. It is also possible to define metrics for your services at the service type level. This is accomplished by specifying them in your service manifests. Defining type level metrics is not recommended for several reasons. The first reason is that metric names are frequently environment-specific. Unless there is a firm contract in place, you cannot be sure that the metric "Cores" in one environment isn't "MiliCores" or "CoReS" in others. If your metrics are defined in your manifest you need to create new manifests per environment. This usually leads to a proliferation of different manifests with only minor differences, which can lead to management difficulties.
Metric loads are commonly assigned on a per-named-service-instance basis. For example, let's say you create one instance of the service for CustomerA who plans to use it only lightly. Let's also say you create another for CustomerB who has a larger workload. In this case, you'd probably want to tweak the default loads for those services. If you have metrics and loads defined via manifests and you want to support this scenario, it requires different application and service types for each customer. The values defined at service creation time override those defined in the manifest, so you could use that to set the specific defaults. However, doing that causes the values declared in the manifests to not match those the service actually runs with. This can lead to confusion.
As a reminder: if you just want to use the default metrics, you don’t need to touch the metrics collection at all or do anything special when creating your service. The default metrics get used automatically when no others are defined.
Now, let's go through each of these settings in more detail and talk about the behavior that it influences.
Load
The whole point of defining metrics is to represent some load. Load is how much of a given metric is consumed by some service instance or replica on a given node. Load can be configured at almost any point. For example:
- Load can be defined when a service is created. This type of load configuration is called default load.
- The metric information, including default loads, for a service can be updated after the service is created. This metric update is done by updating a service.
- The loads for a given partition can be reset to the default values for that service. This metric update is called resetting partition load.
- Load can be reported on a per service object basis, dynamically during runtime. This metric update is called reporting load.
- Load for partition's replicas or instances can also be updated by reporting load values through a Fabric API call. This metric update is called reporting load for a partition.
All of these strategies can be used within the same service over its lifetime.
Default load
Default load is how much of the metric each service object (stateless instance or stateful replica) of this service consumes. The Cluster Resource Manager uses this number for the load of the service object until it receives other information, such as a dynamic load report. For simpler services, the default load is a static definition. The default load is never updated and is used for the lifetime of the service. Default loads work great for simple capacity planning scenarios where certain amounts of resources are dedicated to different workloads and do not change.
Note
For more information on capacity management and defining capacities for the nodes in your cluster, please see this article.
The Cluster Resource Manager allows stateful services to specify a different default load for their Primaries and Secondaries. Stateless services can only specify one value that applies to all instances. For stateful services, the default load for Primary and Secondary replicas are typically different since replicas do different kinds of work in each role. For example, Primaries usually serve both reads and writes, and handle most of the computational burden, while secondaries do not. Usually the default load for a primary replica is higher than the default load for secondary replicas. The real numbers should depend on your own measurements.
Dynamic load
Let’s say that you’ve been running your service for a while. With some monitoring, you’ve noticed that:
- Some partitions or instances of a given service consume more resources than others
- Some services have load that varies over time.
There's lots of things that could cause these types of load fluctuations. For example, different services or partitions are associated with different customers with different requirements. Load could also change because the amount of work the service does varies over the course of the day. Regardless of the reason, there’s usually no single number that you can use for default. This is especially true if you want to get the most utilization out of the cluster. Any value you pick for default load is wrong some of the time. Incorrect default loads result in the Cluster Resource Manager either over or under allocating resources. As a result, you have nodes that are over or under utilized even though the Cluster Resource Manager thinks the cluster is balanced. Default loads are still good since they provide some information for initial placement, but they're not a complete story for real workloads. To accurately capture changing resource requirements, the Cluster Resource Manager allows each service object to update its own load during runtime. This is called dynamic load reporting.
Dynamic load reports allow replicas or instances to adjust their allocation/reported load of metrics over their lifetime. A service replica or instance that was cold and not doing any work would usually report that it was using low amounts of a given metric. A busy replica or instance would report that they are using more.
Reporting load per replica or instance allows the Cluster Resource Manager to reorganize the individual service objects in the cluster. Reorganizing the services helps ensure that they get the resources they require. Busy services effectively get to "reclaim" resources from other replicas or instances that are currently cold or doing less work.
Within Reliable Services, the code to report load dynamically looks like this:
Code:
this.Partition.ReportLoad(new List<LoadMetric> { new LoadMetric("CurrentConnectionCount", 1234), new LoadMetric("metric1", 42) });
A service can report on any of the metrics defined for it at creation time. If a service reports load for a metric that it is not configured to use, Service Fabric ignores that report. If there are other metrics reported at the same time that are valid, those reports are accepted. Service code can measure and report all the metrics it knows how to, and operators can specify the metric configuration to use without having to change the service code.
Reporting load for a partition
The previous section describes how service replicas or instances report load themselves. There is an additional option to dynamically report load for a partition's replicas or instances through Service Fabric API. When reporting load for a partition, you may report for multiple partitions at once.
Those reports will be used in the exactly same way as load reports that are coming from the replicas or instances themselves. Reported values will be valid until new load values are reported, either by the replica or instance or by reporting a new load value for a partition.
With this API, there are multiple ways to update load in the cluster:
- A stateful service partition can update its primary replica load.
- Both stateless and stateful services can update the load of all its secondary replicas or instances.
- Both stateless and stateful services can update the load of a specific replica or instance on a node.
It is also possible to combine any of those updates per partition at the same time. Combination of load updates for a particular partition should be specified through the object PartitionMetricLoadDescription, which can contain corresponding list of load updates as it is shown in the example below. Load updates are represented through the object MetricLoadDescription, which can contain current or predicted load value for a metric, specified with a metric name.
Note
Predicted metric load values is currently a preview feature. It allows predicted load values to be reported and used at the Service Fabric side, but that feature is currently not enabled.
Updating loads for multiple partitions is possible with a single API call, in which case the output will contain a response per partition. In case partition update is not successfully applied for any reason, updates for that partition will be skipped, and corresponding error code for a targeted partition will be provided:
- PartitionNotFound - Specified partition ID doesn't exist.
- ReconfigurationPending - Partition is currently reconfiguring.
- InvalidForStatelessServices - An attempt was made to change the load of a primary replica for a partition belonging to a stateless service.
- ReplicaDoesNotExist - Secondary replica or instance does not exist on a specified node.
- InvalidOperation - Could happen in two cases: updating load for a partition that belongs to the System application or updating predicted load is not enabled.
If some of those errors are returned, you can update the input for a specific partition and retry the update for it.
Code:
Guid partitionId = Guid.Parse("53df3d7f-5471-403b-b736-bde6ad584f42");
string metricName0 = "CustomMetricName0";
List<MetricLoadDescription> newPrimaryReplicaLoads = new List<MetricLoadDescription>()
{
    new MetricLoadDescription(metricName0, 100)
};

string nodeName0 = "NodeName0";
List<MetricLoadDescription> newSpecificSecondaryReplicaLoads = new List<MetricLoadDescription>()
{
    new MetricLoadDescription(metricName0, 200)
};

OperationResult<UpdatePartitionLoadResultList> updatePartitionLoadResults =
    await this.FabricClient.UpdatePartitionLoadAsync(
        new UpdatePartitionLoadQueryDescription
        {
            PartitionMetricLoadDescriptionList = new List<PartitionMetricLoadDescription>()
            {
                new PartitionMetricLoadDescription(
                    partitionId,
                    newPrimaryReplicaLoads,
                    new List<MetricLoadDescription>(),
                    new List<ReplicaMetricLoadDescription>()
                    {
                        new ReplicaMetricLoadDescription(nodeName0, newSpecificSecondaryReplicaLoads)
                    })
            }
        },
        this.Timeout,
        cancellationToken);
With this example, you will perform an update of the last reported load for a partition 53df3d7f-5471-403b-b736-bde6ad584f42. Primary replica load for a metric CustomMetricName0 will be updated with value 100. At the same time, load for the same metric for a specific secondary replica located at the node NodeName0, will be updated with value 200.
Updating a service's metric configuration
The list of metrics associated with the service, and the properties of those metrics can be updated dynamically while the service is live. This allows for experimentation and flexibility. Some examples of when this is useful are:
- disabling a metric with a buggy report for a particular service
- reconfiguring the weights of metrics based on desired behavior
- enabling a new metric only after the code has already been deployed and validated via other mechanisms
- changing the default load for a service based on observed behavior and consumption
The main APIs for changing metric configuration are FabricClient.ServiceManagementClient.UpdateServiceAsync in C# and Update-ServiceFabricService in PowerShell. Whatever information you specify with these APIs replaces the existing metric information for the service immediately.
Mixing default load values and dynamic load reports
Default load and dynamic loads can be used for the same service. When a service utilizes both default load and dynamic load reports, default load serves as an estimate until dynamic reports show up. Default load is good because it gives the Cluster Resource Manager something to work with. The default load allows the Cluster Resource Manager to place the service objects in good locations when they are created. If no default load information is provided, placement of services is effectively random. When load reports arrive later the initial random placement is often wrong and the Cluster Resource Manager has to move services.
Let’s take our previous example and see what happens when we add some custom metrics and dynamic load reporting. In this example, we use “MemoryInMb” as an example metric.
Note
Memory is one of the system metrics that Service Fabric can resource govern, and reporting it yourself is typically difficult. We don't actually expect you to report on Memory consumption; Memory is used here as an aid to learning about the capabilities of the Cluster Resource Manager.
Let’s presume that we initially created the stateful service with the following command:
PowerShell:
New-ServiceFabricService -ApplicationName $applicationName -ServiceName $serviceName -ServiceTypeName $serviceTypeName –Stateful -MinReplicaSetSize 3 -TargetReplicaSetSize 3 -PartitionSchemeSingleton –Metric @("MemoryInMb,High,21,11”,"PrimaryCount,Medium,1,0”,"ReplicaCount,Low,1,1”,"Count,Low,1,1”)
As a reminder, this syntax is ("MetricName, MetricWeight, PrimaryDefaultLoad, SecondaryDefaultLoad").
Let's see what one possible cluster layout could look like:
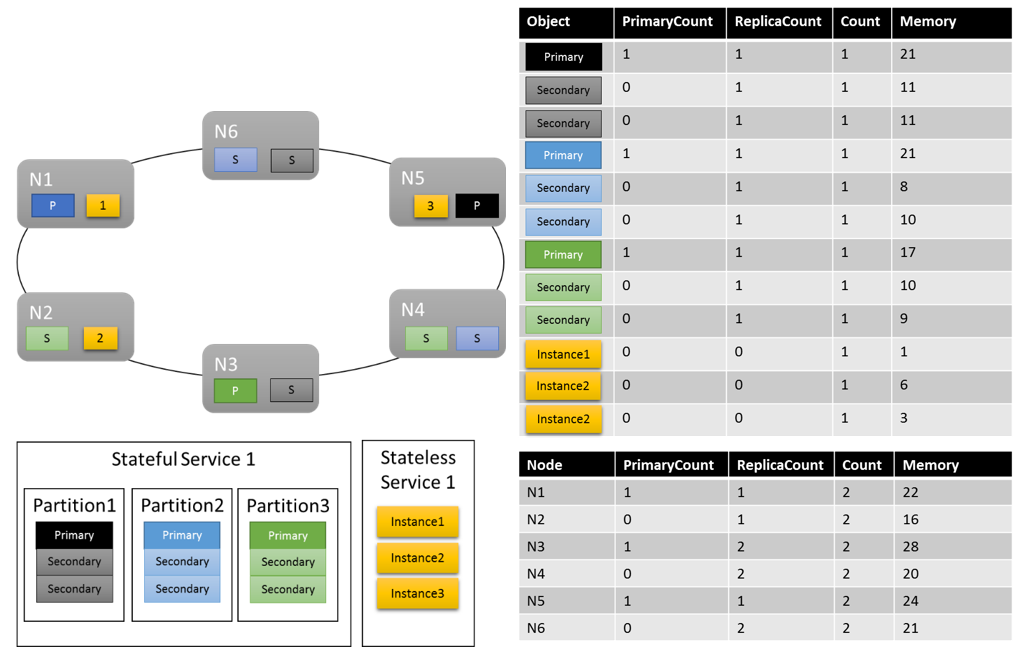
Some things that are worth noting:
- Secondary replicas within a partition can each have their own load
- Overall the metrics look balanced. For Memory, the ratio between the maximum and minimum load is 1.75 (the node with the most load is N3, the least is N2, and 28/16 = 1.75).
There are some things that we still need to explain:
- What determined whether a ratio of 1.75 was reasonable or not? How does the Cluster Resource Manager know if that’s good enough or if there is more work to do?
- When does balancing happen?
- What does it mean that Memory was weighted “High”?
Metric weights
Tracking the same metrics across different services is important. That global view is what allows the Cluster Resource Manager to track consumption in the cluster, balance consumption across nodes, and ensure that nodes don’t go over capacity. However, services may have different views as to the importance of the same metric. Also, in a cluster with many metrics and lots of services, perfectly balanced solutions may not exist for all metrics. How should the Cluster Resource Manager handle these situations?
Metric weights allow the Cluster Resource Manager to decide how to balance the cluster when there’s no perfect answer. Metric weights also allow the Cluster Resource Manager to balance specific services differently. Metrics can have four different weight levels: Zero, Low, Medium, and High. A metric with a weight of Zero contributes nothing when considering whether things are balanced or not. However, its load does still contribute to capacity management. Metrics with Zero weight are still useful and are frequently used as a part of service behavior and performance monitoring. This article provides more information on the use of metrics for monitoring and diagnostics of your services.
The real impact of different metric weights in the cluster is that the Cluster Resource Manager generates different solutions. Metric weights tell the Cluster Resource Manager that certain metrics are more important than others. When there's no perfect solution the Cluster Resource Manager can prefer solutions which balance the higher weighted metrics better. If a service thinks a particular metric is unimportant, it may find their use of that metric imbalanced. This allows another service to get an even distribution of some metric that is important to it.
Let’s look at an example of some load reports and how different metric weights results in different allocations in the cluster. In this example, we see that switching the relative weight of the metrics causes the Cluster Resource Manager to create different arrangements of services.
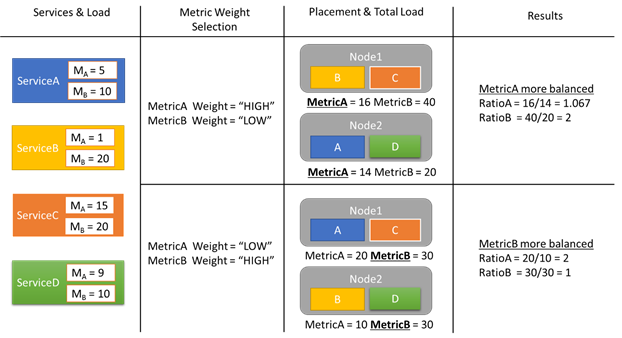
In this example, there are four different services, all reporting different values for two different metrics, MetricA and MetricB. In one case, all the services define MetricA is the most important one (Weight = High) and MetricB as unimportant (Weight = Low). As a result, we see that the Cluster Resource Manager places the services so that MetricA is better balanced than MetricB. "Better balanced" means that MetricA has a lower has a lower standard deviation than MetricB. In the second case, we reverse the metric weights. As a result, the Cluster Resource Manager swaps services A and B to come up with an allocation where MetricB is better balanced than MetricA.
Note
Metric weights determine how the Cluster Resource Manager should balance, but not when balancing should happen. For more information on balancing, check out this article
Global metric weights
Let's say ServiceA defines MetricA as weight High, and ServiceB sets the weight for MetricA to Low or Zero. What’s the actual weight that ends up getting used?
There are multiple weights that are tracked for every metric. The first weight is the one defined for the metric when the service is created. The other weight is a global weight, which is computed automatically. The Cluster Resource Manager uses both these weights when scoring solutions. Taking both weights into account is important. This allows the Cluster Resource Manager to balance each service according to its own priorities, and also ensure that the cluster as a whole is allocated correctly.
What would happen if the Cluster Resource Manager didn’t care about both global and local balance? Well, it’s easy to construct solutions that are globally balanced, but which result in poor resource balance for individual services. In the following example, let’s look at a service configured with just the default metrics, and see what happens when only global balance is considered:
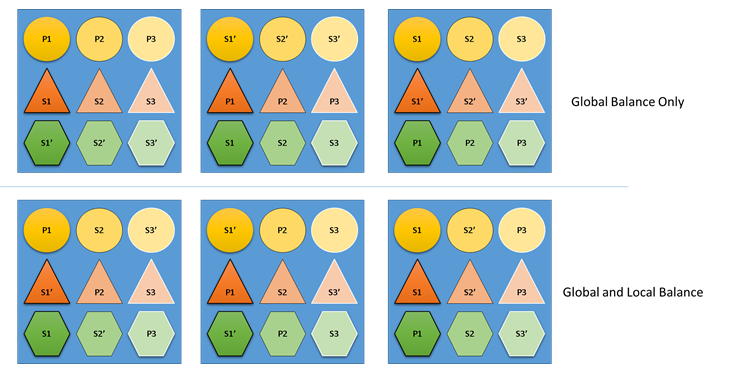
In the top example based only on global balance, the cluster as a whole is indeed balanced. All nodes have the same count of primaries and the same number total replicas. However, if you look at the actual impact of this allocation it’s not so good: the loss of any node impacts a particular workload disproportionately, because it takes out all of its primaries. For example, if the first node fails the three primaries for the three different partitions of the Circle service would all be lost. Conversely, the Triangle and Hexagon services have their partitions lose a replica. This causes no disruption, other than having to recover the down replica.
In the bottom example, the Cluster Resource Manager has distributed the replicas based on both the global and per-service balance. When calculating the score of the solution it gives most of the weight to the global solution, and a (configurable) portion to individual services. Global balance for a metric is calculated based on the average of the metric weights from each service. Each service is balanced according to its own defined metric weights. This ensures that the services are balanced within themselves according to their own needs. As a result, if the same first node fails the failure is distributed across all partitions of all services. The impact to each is the same.
Next steps
- For more information on configuring services, Learn about configuring Services(service-fabric-cluster-resource-manager-configure-services.md)
- Defining Defragmentation Metrics is one way to consolidate load on nodes instead of spreading it out. To learn how to configure defragmentation, refer to this article
- To find out about how the Cluster Resource Manager manages and balances load in the cluster, check out the article on balancing load
- Start from the beginning and get an Introduction to the Service Fabric Cluster Resource Manager
- Movement Cost is one way of signaling to the Cluster Resource Manager that certain services are more expensive to move than others. To learn more about movement cost, refer to this article