Tutorial: Monitor a Service Fabric cluster in Azure
Monitoring and diagnostics are critical to developing, testing, and deploying workloads in any cloud environment. This tutorial is part two of a series, and shows you how to monitor and diagnose a Service Fabric cluster using events, performance counters, and health reports. For more information, read the overview about cluster monitoring and infrastructure monitoring.
In this tutorial, you learn how to:
- View Service Fabric events
- Query EventStore APIs for cluster events
- Monitor infrastructure/collect perf counters
- View cluster health reports
In this tutorial series you learn how to:
- Create a secure Windows cluster on Azure using a template
- Monitor a cluster
- Scale a cluster in or out
- Upgrade the runtime of a cluster
- Delete a cluster
Note
We recommend that you use the Azure Az PowerShell module to interact with Azure. To get started, see Install Azure PowerShell. To learn how to migrate to the Az PowerShell module, see Migrate Azure PowerShell from AzureRM to Az.
Prerequisites
Before you begin this tutorial:
- If you don't have an Azure subscription, create a free account
- Install Azure PowerShell or Azure CLI.
- Create a secure Windows cluster
- Set up diagnostics collection for the cluster
- Enable the EventStore service in the cluster
- Configure Azure Monitor logs and the Log Analytics agent for the cluster
View Service Fabric events using Azure Monitor logs
Azure Monitor logs collects and analyzes telemetry from applications and services hosted in the cloud and provides analysis tools to help you maximize their availability and performance. You can run queries in Azure Monitor logs to gain insights and troubleshoot what is happening in your cluster.
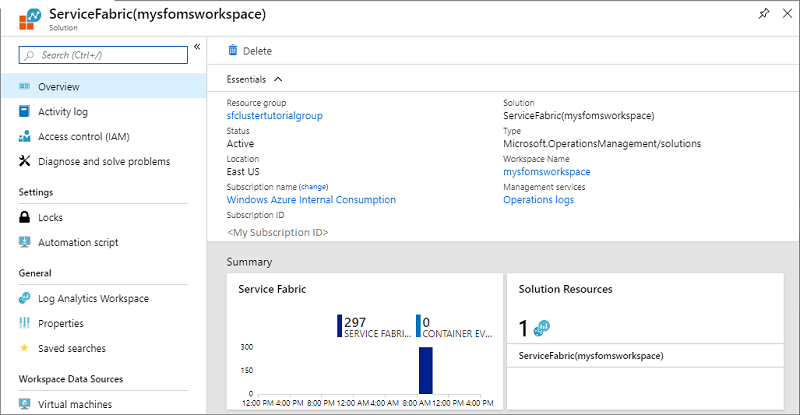
To access the Service Fabric Analytics solution, go to the Azure portal and select the resource group in which you created the Service Fabric Analytics solution.
Select the resource ServiceFabric(mysfomsworkspace).
In Overview you see tiles in the form of a graph for each of the solutions enabled, including one for Service Fabric. Select the Service Fabric graph to continue to the Service Fabric Analytics solution.
The following image shows the home page of the Service Fabric Analytics solution. This home page provides a snapshot view of what's happening in your cluster.
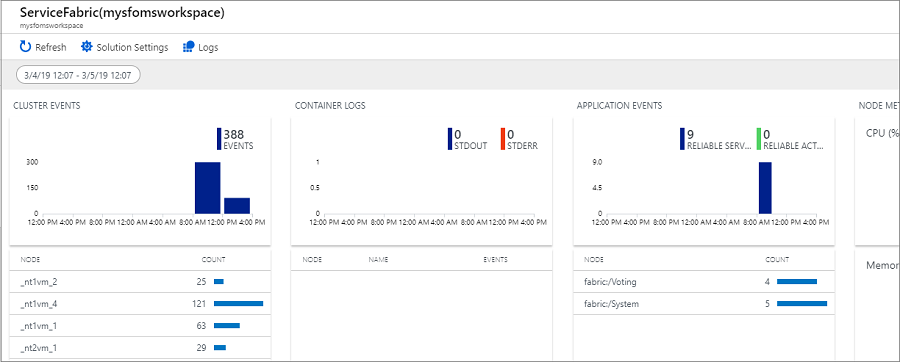
If you enabled diagnostics upon cluster creation, you can see events for
- Service Fabric cluster events
- Reliable Actors programming model events
- Reliable Services programming model events
Note
In addition to the Service Fabric events out of the box, more detailed system events can be collected by updating the config of your diagnostics extension.
View Service Fabric Events, including actions on nodes
On the Service Fabric Analytics page, click on the graph for Cluster Events. The logs for all the system events that have been collected appear. For reference, these are from the WADServiceFabricSystemEventsTable in the Azure Storage account, and similarly the reliable services and actors events you see next are from those respective tables.
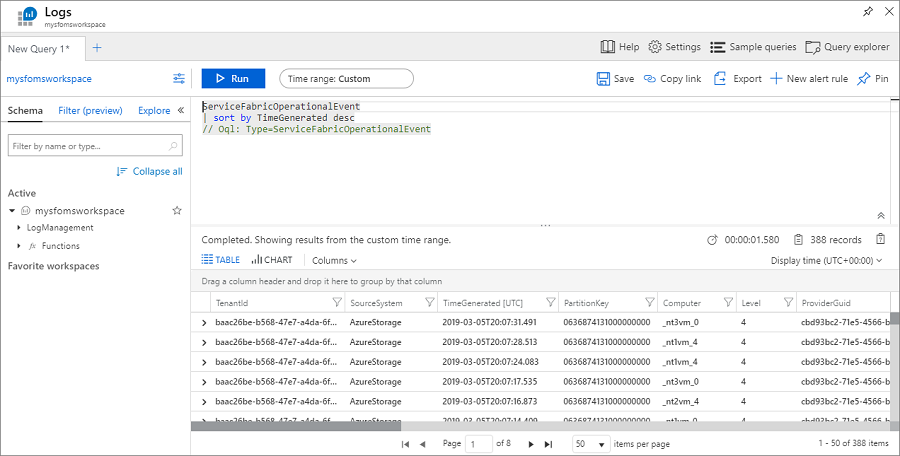
The query uses the Kusto query language, which you can modify to refine what you're looking for. For example, to find all actions taken on nodes in the cluster, you can use the following query. The event IDs used below are found in the operational channel events reference.
ServiceFabricOperationalEvent
| where EventId < 25627 and EventId > 25619
The Kusto query language is powerful. Here are some other useful queries.
Create a ServiceFabricEvent lookup table as user-defined function by saving the query as a function with alias ServiceFabricEvent:
let ServiceFabricEvent = datatable(EventId: int, EventName: string)
[
    ...
    18603, 'NodeUpOperational',
    18604, 'NodeDownOperational',
    ...
];
ServiceFabricEvent
Return operational events recorded in the last hour:
ServiceFabricOperationalEvent
| where TimeGenerated > ago(1h)
| join kind=leftouter ServiceFabricEvent on EventId
| project EventId, EventName, TaskName, Computer, ApplicationName, EventMessage, TimeGenerated
| sort by TimeGenerated
Return operational events with EventId == 18604 and EventName == 'NodeDownOperational':
ServiceFabricOperationalEvent
| where EventId == 18604
| project EventId, EventName = 'NodeDownOperational', TaskName, Computer, EventMessage, TimeGenerated
| sort by TimeGenerated
Return operational events with EventId == 18604 and EventName == 'NodeUpOperational':
ServiceFabricOperationalEvent
| where EventId == 18603
| project EventId, EventName = 'NodeUpOperational', TaskName, Computer, EventMessage, TimeGenerated
| sort by TimeGenerated
Returns Health Reports with HealthState == 3 (Error) and extract more properties from the EventMessage field:
ServiceFabricOperationalEvent
| join kind=leftouter ServiceFabricEvent on EventId
| extend HealthStateId = extract(@"HealthState=(\S+) ", 1, EventMessage, typeof(int))
| where TaskName == 'HM' and HealthStateId == 3
| extend SourceId = extract(@"SourceId=(\S+) ", 1, EventMessage, typeof(string)),
         Property = extract(@"Property=(\S+) ", 1, EventMessage, typeof(string)),
         HealthState = case(HealthStateId == 0, 'Invalid', HealthStateId == 1, 'Ok', HealthStateId == 2, 'Warning', HealthStateId == 3, 'Error', 'Unknown'),
         TTL = extract(@"TTL=(\S+) ", 1, EventMessage, typeof(string)),
         SequenceNumber = extract(@"SequenceNumber=(\S+) ", 1, EventMessage, typeof(string)),
         Description = extract(@"Description='([\S\s, ^']+)' ", 1, EventMessage, typeof(string)),
         RemoveWhenExpired = extract(@"RemoveWhenExpired=(\S+) ", 1, EventMessage, typeof(bool)),
         SourceUTCTimestamp = extract(@"SourceUTCTimestamp=(\S+)", 1, EventMessage, typeof(datetime)),
         ApplicationName = extract(@"ApplicationName=(\S+) ", 1, EventMessage, typeof(string)),
         ServiceManifest = extract(@"ServiceManifest=(\S+) ", 1, EventMessage, typeof(string)),
         InstanceId = extract(@"InstanceId=(\S+) ", 1, EventMessage, typeof(string)),
         ServicePackageActivationId = extract(@"ServicePackageActivationId=(\S+) ", 1, EventMessage, typeof(string)),
         NodeName = extract(@"NodeName=(\S+) ", 1, EventMessage, typeof(string)),
         Partition = extract(@"Partition=(\S+) ", 1, EventMessage, typeof(string)),
         StatelessInstance = extract(@"StatelessInstance=(\S+) ", 1, EventMessage, typeof(string)),
         StatefulReplica = extract(@"StatefulReplica=(\S+) ", 1, EventMessage, typeof(string))
Return a time chart of events with EventId != 17523:
ServiceFabricOperationalEvent
| join kind=leftouter ServiceFabricEvent on EventId
| where EventId != 17523
| summarize Count = count() by Timestamp = bin(TimeGenerated, 1h), strcat(tostring(EventId), " - ", case(EventName != "", EventName, "Unknown"))
| render timechart
Get Service Fabric operational events aggregated with the specific service and node:
ServiceFabricOperationalEvent
| where ApplicationName  != "" and ServiceName != ""
| summarize AggregatedValue = count() by ApplicationName, ServiceName, Computer
Render the count of Service Fabric events by EventId / EventName using a cross-resource query:
app('PlunkoServiceFabricCluster').traces
| where customDimensions.ProviderName == 'Microsoft-ServiceFabric'
| extend EventId = toint(customDimensions.EventId), TaskName = tostring(customDimensions.TaskName)
| where EventId != 17523
| join kind=leftouter ServiceFabricEvent on EventId
| extend EventName = case(EventName != '', EventName, 'Undocumented')
| summarize ["Event Count"]= count() by bin(timestamp, 30m), EventName = strcat(tostring(EventId), " - ", EventName)
| render timechart
View Service Fabric application events
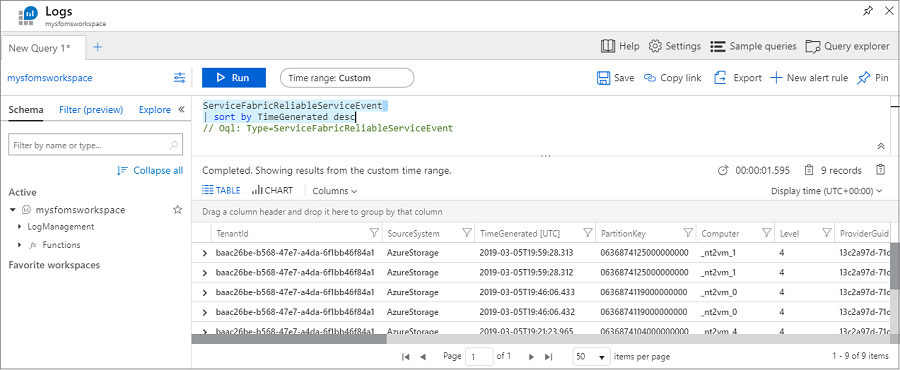
You can view events for the reliable services and reliable actors applications deployed on the cluster. On the Service Fabric Analytics page, select the graph for Application Events.
Run the following query to view events from your reliable services applications:
ServiceFabricReliableServiceEvent
| sort by TimeGenerated desc
You can see different events for when the service runasync is started and completed which typically happens on deployments and upgrades.
You can also find events for the reliable service with ServiceName == "fabric:/Watchdog/WatchdogService":
ServiceFabricReliableServiceEvent
| where ServiceName == "fabric:/Watchdog/WatchdogService"
| project TimeGenerated, EventMessage
| order by TimeGenerated desc
Reliable actor events can be viewed in a similar fashion:
ServiceFabricReliableActorEvent
| sort by TimeGenerated desc
To configure more detailed events for reliable actors, you can change the scheduledTransferKeywordFilter in the config for the diagnostic extension in the cluster template. Details on the values for these are in the reliable actors events reference.
"EtwEventSourceProviderConfiguration": [
                {
                    "provider": "Microsoft-ServiceFabric-Actors",
                    "scheduledTransferKeywordFilter": "1",
                    "scheduledTransferPeriod": "PT5M",
                    "DefaultEvents": {
                    "eventDestination": "ServiceFabricReliableActorEventTable"
                    }
                },
View performance counters with Azure Monitor logs
To view performance counters, go to the Azure portal and the resource group in which you created the Service Fabric Analytics solution.
Select the resource ServiceFabric(mysfomsworkspace), then Log Analytics Workspace, and then Advanced Settings.
Select Data, then choose Windows Performance Counters. There's a list of default counters you can choose to enable and you can set the interval for collection too. You can also add additional performance counters to collect. The proper format is referenced in this article. Click Save, then select OK.
Close the Advanced Settings blade and select Workspace summary under the General heading. For each of the solutions enabled there's a graphical tile, including one for Service Fabric. Select the Service Fabric graph to continue to the Service Fabric Analytics solution.
There are graphical tiles for operational channel and reliable services events. The graphical representation of the data flowing in for the counters you selected appear under Node Metrics.
Select the Container Metric graph to see more details. You can also query on performance counter data similarly to cluster events and filter on the nodes, perf counter name, and values using the Kusto query language.
Query the EventStore service
The EventStore service provides a way to understand the state of your cluster or workloads at a given point in time. The EventStore is a stateful Service Fabric service that maintains events from the cluster. The events are exposed through the Service Fabric Explorer, REST, and APIs. EventStore queries the cluster directly to get diagnostics data on any entity in your cluster To see a full list of events available in the EventStore, see Service Fabric events.
The EventStore APIs can be queried programmatically using the Service Fabric client library.
Here is an example request for all cluster events between 2018-04-03T18:00:00Z and 2018-04-04T18:00:00Z, via the GetClusterEventListAsync function.
var sfhttpClient = ServiceFabricClientFactory.Create(clusterUrl, settings);

var clstrEvents = sfhttpClient.EventsStore.GetClusterEventListAsync(
    "2018-04-03T18:00:00Z",
    "2018-04-04T18:00:00Z")
    .GetAwaiter()
    .GetResult()
    .ToList();
Here is another example that queries for the cluster health and all node events in September 2018 and prints them out.
const int timeoutSecs = 60;
var clusterUrl = new Uri(@"http://localhost:19080"); // This example is for a Local cluster
var sfhttpClient = ServiceFabricClientFactory.Create(clusterUrl);

var clusterHealth = sfhttpClient.Cluster.GetClusterHealthAsync().GetAwaiter().GetResult();
Console.WriteLine("Cluster Health: {0}", clusterHealth.AggregatedHealthState.Value.ToString());


Console.WriteLine("Querying for node events...");
var nodesEvents = sfhttpClient.EventsStore.GetNodesEventListAsync(
    "2018-09-01T00:00:00Z",
    "2018-09-30T23:59:59Z",
    timeoutSecs,
    "NodeDown,NodeUp")
    .GetAwaiter()
    .GetResult()
    .ToList();
Console.WriteLine("Result Count: {0}", nodesEvents.Count());

foreach (var nodeEvent in nodesEvents)
{
    Console.Write("Node event happened at {0}, Node name: {1} ", nodeEvent.TimeStamp, nodeEvent.NodeName);
    if (nodeEvent is NodeDownEvent)
    {
        var nodeDownEvent = nodeEvent as NodeDownEvent;
        Console.WriteLine("(Node is down, and it was last up at {0})", nodeDownEvent.LastNodeUpAt);
    }
    else if (nodeEvent is NodeUpEvent)
    {
        var nodeUpEvent = nodeEvent as NodeUpEvent;
        Console.WriteLine("(Node is up, and it was last down at {0})", nodeUpEvent.LastNodeDownAt);
    }
}
Monitor cluster health
Service Fabric introduces a health model with health entities on which system components and watchdogs can report local conditions that they are monitoring. The health store aggregates all health data to determine whether entities are healthy.
The cluster is automatically populated with health reports sent by the system components. Read more at Use system health reports to troubleshoot.
Service Fabric exposes health queries for each of the supported entity types. They can be accessed through the API, using methods on FabricClient.HealthManager, PowerShell cmdlets, and REST. These queries return complete health information about the entity: the aggregated health state, entity health events, child health states (when applicable), unhealthy evaluations (when the entity is not healthy), and children health statistics (when applicable).
Get cluster health
The Get-ServiceFabricClusterHealth cmdlet returns the health of the cluster entity and contains the health states of applications and nodes (children of the cluster). First, connect to the cluster using the Connect-ServiceFabricCluster cmdlet.
The state of the cluster is 11 nodes, the system application, and fabric:/Voting configured as described.
The following example gets cluster health by using default health policies. The 11 nodes are healthy but the cluster aggregated health state is Error because the fabric:/Voting application is in Error. Note how the unhealthy evaluations provide details on the conditions that triggered the aggregated health.
Get-ServiceFabricClusterHealth

AggregatedHealthState   : Error
UnhealthyEvaluations    :
                          100% (1/1) applications are unhealthy. The evaluation tolerates 0% unhealthy applications.

                          Application 'fabric:/Voting' is in Error.

                          	33% (1/3) deployed applications are unhealthy. The evaluation tolerates 0% unhealthy deployed applications.

                          	Deployed application on node '_nt2vm_3' is in Error.

                          		50% (1/2) deployed service packages are unhealthy.

                          		Service package for manifest 'VotingWebPkg' and service package activation ID '8723eb73-9b83-406b-9de3-172142ba15f3' is in Error.

                          			'System.Hosting' reported Error for property 'CodePackageActivation:Code:SetupEntryPoint:131959376195593305'.
                          			There was an error during CodePackage activation.The service host terminated with exit code:1


NodeHealthStates        :
                          NodeName              : _nt2vm_3
                          AggregatedHealthState : Ok

                          NodeName              : _nt1vm_4
                          AggregatedHealthState : Ok

                          NodeName              : _nt2vm_2
                          AggregatedHealthState : Ok

                          NodeName              : _nt1vm_3
                          AggregatedHealthState : Ok

                          NodeName              : _nt2vm_1
                          AggregatedHealthState : Ok

                          NodeName              : _nt1vm_2
                          AggregatedHealthState : Ok

                          NodeName              : _nt2vm_0
                          AggregatedHealthState : Ok

                          NodeName              : _nt1vm_1
                          AggregatedHealthState : Ok

                          NodeName              : _nt1vm_0
                          AggregatedHealthState : Ok

                          NodeName              : _nt3vm_0
                          AggregatedHealthState : Ok

                          NodeName              : _nt2vm_4
                          AggregatedHealthState : Ok

ApplicationHealthStates :
                          ApplicationName       : fabric:/System
                          AggregatedHealthState : Ok

                          ApplicationName       : fabric:/Voting
                          AggregatedHealthState : Error

HealthEvents            : None
HealthStatistics        :
                          Node                  : 11 Ok, 0 Warning, 0 Error
                          Replica               : 4 Ok, 0 Warning, 0 Error
                          Partition             : 2 Ok, 0 Warning, 0 Error
                          Service               : 2 Ok, 0 Warning, 0 Error
                          DeployedServicePackage : 3 Ok, 1 Warning, 1 Error
                          DeployedApplication   : 1 Ok, 1 Warning, 1 Error
                          Application           : 0 Ok, 0 Warning, 1 Error
The following example gets the health of the cluster by using a custom application policy. It filters results to get only applications and nodes in error or warning. In this example no nodes are returned, as they are all healthy. Only the fabric:/Voting application respects the applications filter. Because the custom policy specifies to consider warnings as errors for the fabric:/Voting application, the application is evaluated as in error and so is the cluster.
$appHealthPolicy = New-Object -TypeName System.Fabric.Health.ApplicationHealthPolicy
$appHealthPolicy.ConsiderWarningAsError = $true
$appHealthPolicyMap = New-Object -TypeName System.Fabric.Health.ApplicationHealthPolicyMap
$appUri1 = New-Object -TypeName System.Uri -ArgumentList "fabric:/Voting"
$appHealthPolicyMap.Add($appUri1, $appHealthPolicy)
Get-ServiceFabricClusterHealth -ApplicationHealthPolicyMap $appHealthPolicyMap -ApplicationsFilter "Warning,Error" -NodesFilter "Warning,Error" -ExcludeHealthStatistics

AggregatedHealthState   : Error
UnhealthyEvaluations    :
                          100% (1/1) applications are unhealthy. The evaluation tolerates 0% unhealthy applications.

                          Application 'fabric:/Voting' is in Error.

                          	100% (5/5) deployed applications are unhealthy. The evaluation tolerates 0% unhealthy deployed applications.

                          	Deployed application on node '_nt2vm_3' is in Error.

                          		50% (1/2) deployed service packages are unhealthy.

                          		Service package for manifest 'VotingWebPkg' and service package activation ID '8723eb73-9b83-406b-9de3-172142ba15f3' is in Error.

                          			'System.Hosting' reported Error for property 'CodePackageActivation:Code:SetupEntryPoint:131959376195593305'.
                          			There was an error during CodePackage activation.The service host terminated with exit code:1

                          	Deployed application on node '_nt2vm_2' is in Error.

                          		50% (1/2) deployed service packages are unhealthy.

                          		Service package for manifest 'VotingWebPkg' and service package activation ID '2466f2f9-d5fd-410c-a6a4-5b1e00630cca' is in Error.

                          			'System.Hosting' reported Error for property 'CodePackageActivation:Code:SetupEntryPoint:131959376486201388'.
                          			There was an error during CodePackage activation.The service host terminated with exit code:1

                          	Deployed application on node '_nt2vm_4' is in Error.

                          		100% (1/1) deployed service packages are unhealthy.

                          		Service package for manifest 'VotingWebPkg' and service package activation ID '5faa5201-eede-400a-865f-07f7f886aa32' is in Error.

                          			'System.Hosting' reported Warning for property 'CodePackageActivation:Code:SetupEntryPoint:131959376207396204'. The evaluation treats
                          Warning as Error.
                          			There was an error during CodePackage activation.The service host terminated with exit code:1

                          	Deployed application on node '_nt2vm_0' is in Error.

                          		100% (1/1) deployed service packages are unhealthy.

                          		Service package for manifest 'VotingWebPkg' and service package activation ID '204f1783-f774-4f3a-b371-d9983afaf059' is in Error.

                          			'System.Hosting' reported Error for property 'CodePackageActivation:Code:SetupEntryPoint:131959375885791093'.
                          			There was an error during CodePackage activation.The service host terminated with exit code:1

                          	Deployed application on node '_nt3vm_0' is in Error.

                          		50% (1/2) deployed service packages are unhealthy.

                          		Service package for manifest 'VotingWebPkg' and service package activation ID '2533ae95-2d2a-4f8b-beef-41e13e4c0081' is in Error.

                          			'System.Hosting' reported Error for property 'CodePackageActivation:Code:SetupEntryPoint:131959376108346272'.
                          			There was an error during CodePackage activation.The service host terminated with exit code:1

NodeHealthStates        : None
ApplicationHealthStates :
                          ApplicationName       : fabric:/Voting
                          AggregatedHealthState : Error

HealthEvents            : None
Get node health
The Get-ServiceFabricNodeHealth cmdlet returns the health of a node entity and contains the health events reported on the node. First, connect to the cluster by using the Connect-ServiceFabricCluster cmdlet. The following example gets the health of a specific node by using default health policies:
Get-ServiceFabricNodeHealth _nt1vm_3
The following example gets the health of all nodes in the cluster:
Get-ServiceFabricNode | Get-ServiceFabricNodeHealth | select NodeName, AggregatedHealthState | ft -AutoSize
Get system service health
Get the aggregated health of the system services:
Get-ServiceFabricService -ApplicationName fabric:/System | Get-ServiceFabricServiceHealth | select ServiceName, AggregatedHealthState | ft -AutoSize
Next steps
In this tutorial, you learned how to:
- View Service Fabric events
- Query EventStore APIs for cluster events
- Monitor infrastructure/collect perf counters
- View cluster health reports
Next, advance to the following tutorial to learn how to scale a cluster.
Feedback
Coming soon: Throughout 2024 we will be phasing out GitHub Issues as the feedback mechanism for content and replacing it with a new feedback system. For more information see: https://aka.ms/ContentUserFeedback.
Submit and view feedback for