Note
Access to this page requires authorization. You can try signing in or changing directories.
Access to this page requires authorization. You can try changing directories.
This is part three of a tutorial, and walks you through configuring Azure Monitor logs to monitor your Windows containers orchestrated on Service Fabric.
In this tutorial, you learn how to:
- Configure Azure Monitor logs for your Service Fabric cluster
- Use a Log Analytics workspace to view and query logs from your containers and nodes
- Configure the Log Analytics agent to pick up container and node metrics
Prerequisites
Before you begin this tutorial, you should:
- Have a cluster on Azure, or create one with this tutorial
- Deploy a containerized application to it
Setting up Azure Monitor logs with your cluster in the Resource Manager template
In the case that you used the template provided in the first part of this tutorial, it should include the following additions to a generic Service Fabric Azure Resource Manager template. In case you have a cluster of your own that you're looking to set up for monitoring containers with Azure Monitor logs:
- Make the following changes to your Resource Manager template.
- Deploy it using PowerShell to upgrade your cluster by deploying the template. Azure Resource Manager realizes that the resource exists, so will roll it out as an upgrade.
Adding Azure Monitor logs to your cluster template
Make the following changes in your template.json:
Add the Log Analytics workspace location and name to your parameters section:
"omsWorkspacename": {
  "type": "string",
  "defaultValue": "[toLower(concat('sf',uniqueString(resourceGroup().id)))]",
  "metadata": {
    "description": "Name of your Log Analytics Workspace"
  }
},
"omsRegion": {
  "type": "string",
  "defaultValue": "East US",
  "allowedValues": [
    "West Europe",
    "East US",
    "Southeast Asia"
  ],
  "metadata": {
    "description": "Specify the Azure Region for your Log Analytics workspace"
  }
}
To change the value used for either add the same parameters to your template.parameters.json and change the values used there.
Add the solution name and the solution to your variables:
"omsSolutionName": "[Concat('ServiceFabric', '(', parameters('omsWorkspacename'), ')')]",
"omsSolution": "ServiceFabric"
Add the Microsoft Monitoring Agent as a virtual machine extension. Find virtual machine scale sets resource: resources > "apiVersion": "[variables('vmssApiVersion')]". Under the properties > virtualMachineProfile > extensionProfile > extensions, add the following extension description under the ServiceFabricNode extension:
{
    "name": "[concat(variables('vmNodeType0Name'),'OMS')]",
    "properties": {
        "publisher": "Microsoft.EnterpriseCloud.Monitoring",
        "type": "MicrosoftMonitoringAgent",
        "typeHandlerVersion": "1.0",
        "autoUpgradeMinorVersion": true,
        "settings": {
            "workspaceId": "[reference(resourceId('Microsoft.OperationalInsights/workspaces/', parameters('omsWorkspacename')), '2015-11-01-preview').customerId]"
        },
        "protectedSettings": {
            "workspaceKey": "[listKeys(resourceId('Microsoft.OperationalInsights/workspaces/', parameters('omsWorkspacename')),'2015-11-01-preview').primarySharedKey]"
        }
    }
},
Add the Log Analytics workspace as an individual resource. In resources, after the virtual machine scale sets resource, add the following:
{
    "apiVersion": "2015-11-01-preview",
    "location": "[parameters('omsRegion')]",
    "name": "[parameters('omsWorkspacename')]",
    "type": "Microsoft.OperationalInsights/workspaces",
    "properties": {
        "sku": {
            "name": "Free"
        }
    },
    "resources": [
        {
            "apiVersion": "2015-11-01-preview",
            "name": "[concat(variables('applicationDiagnosticsStorageAccountName'),parameters('omsWorkspacename'))]",
            "type": "storageinsightconfigs",
            "dependsOn": [
                "[concat('Microsoft.OperationalInsights/workspaces/', parameters('omsWorkspacename'))]",
                "[concat('Microsoft.Storage/storageAccounts/', variables('applicationDiagnosticsStorageAccountName'))]"
            ],
            "properties": {
                "containers": [ ],
                "tables": [
                    "WADServiceFabric*EventTable",
                    "WADWindowsEventLogsTable",
                    "WADETWEventTable"
                ],
                "storageAccount": {
                    "id": "[resourceId('Microsoft.Storage/storageaccounts/', variables('applicationDiagnosticsStorageAccountName'))]",
                    "key": "[listKeys(resourceId('Microsoft.Storage/storageAccounts', variables('applicationDiagnosticsStorageAccountName')),'2015-06-15').key1]"
                }
            }
        },
        {
            "apiVersion": "2015-11-01-preview",
            "name": "System",
            "type": "datasources",
            "dependsOn": [
                "[concat('Microsoft.OperationalInsights/workspaces/', parameters('omsWorkspacename'))]"
            ],
            "kind": "WindowsEvent",
            "properties": {
                "eventLogName": "System",
                "eventTypes": [
                    {
                        "eventType": "Error"
                    },
                    {
                        "eventType": "Warning"
                    },
                    {
                        "eventType": "Information"
                    }
                ]
            }
        }
    ]
},
{
    "apiVersion": "2015-11-01-preview",
    "location": "[parameters('omsRegion')]",
    "name": "[variables('omsSolutionName')]",
    "type": "Microsoft.OperationsManagement/solutions",
    "dependsOn": [
        "[concat('Microsoft.OperationalInsights/workspaces/', parameters('OMSWorkspacename'))]"
    ],
    "properties": {
        "workspaceResourceId": "[resourceId('Microsoft.OperationalInsights/workspaces/', parameters('omsWorkspacename'))]"
    },
    "plan": {
        "name": "[variables('omsSolutionName')]",
        "publisher": "Microsoft",
        "product": "[Concat('OMSGallery/', variables('omsSolution'))]",
        "promotionCode": ""
    }
},
Here is a sample template (used in part one of this tutorial) that has all of these changes that you can reference as needed. These changes add a Log Analytics workspace to your resource group. The workspace is configured to pick up Service Fabric platform events from the storage tables configured with the Windows Azure Diagnostics agent. The Log Analytics agent (Microsoft Monitoring Agent) has also been added to each node in your cluster as a virtual machine extension - this means that as you scale your cluster, the agent is automatically configured on each machine and hooked up to the same workspace.
Deploy the template with your new changes to upgrade your current cluster. You should see the log analytics resources in your resource group once this has completed. When the cluster is ready, deploy your containerized application to it. In the next step, we set up monitoring the containers.
Add the Container Monitoring Solution to your Log Analytics workspace
To set up the Container solution in your workspace, search for Container Monitoring Solution and create a Containers resource (under the Monitoring + Management category).
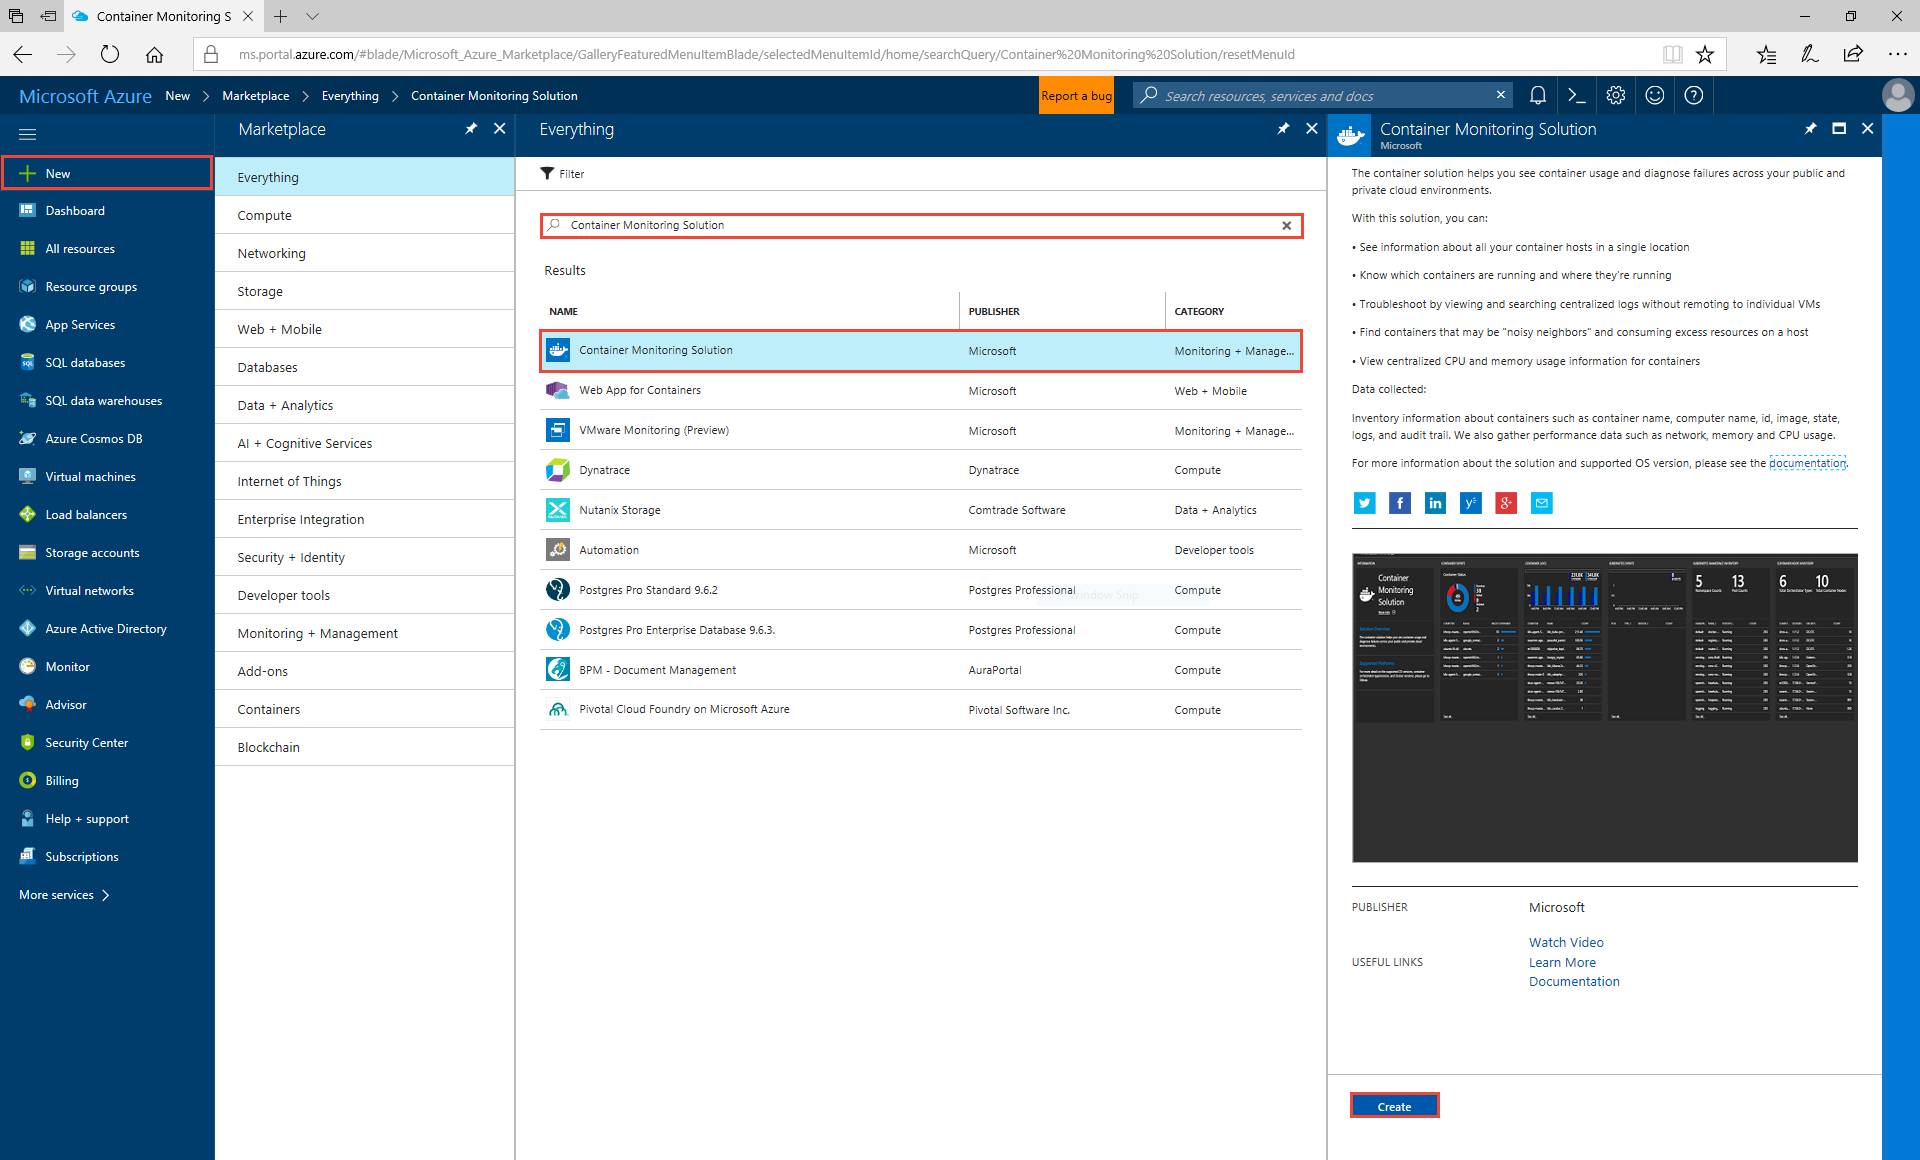
When prompted for the Log Analytics workspace, select the workspace that was created in your resource group, and select Create. This adds a Container Monitoring Solution to your workspace, initiating the Log Analytics agent deployed by the template to start collecting docker logs and stats.
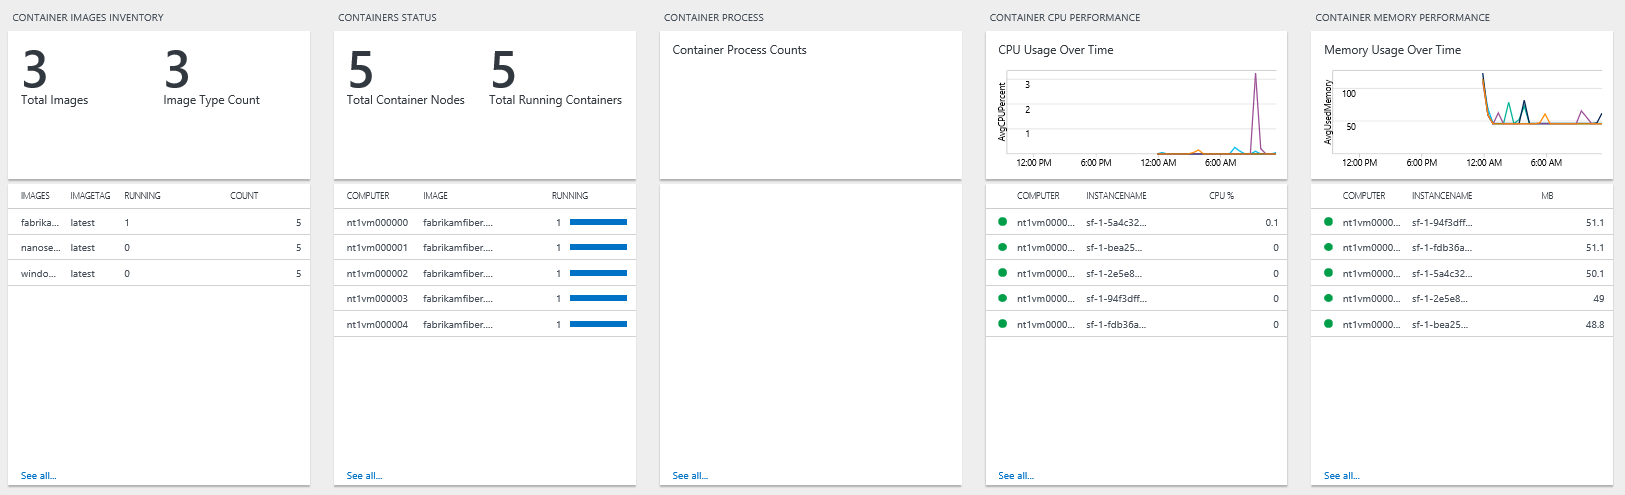
Navigate back to your resource group, where you should now see the newly added monitoring solution. If you select it, the landing page should show you the number of container images you have running.
Note that we ran five instances of the fabrikam container from part two of the tutorial
Selecting the Container Monitor Solution takes you to a more detailed dashboard, which allows you to scroll through multiple panels as well as run queries in Azure Monitor logs.
Since the agent is picking up docker logs, it defaults to showing stdout and stderr. If you scroll horizontally, you'll see container image inventory, status, metrics, and sample queries that you could run to get more helpful data.
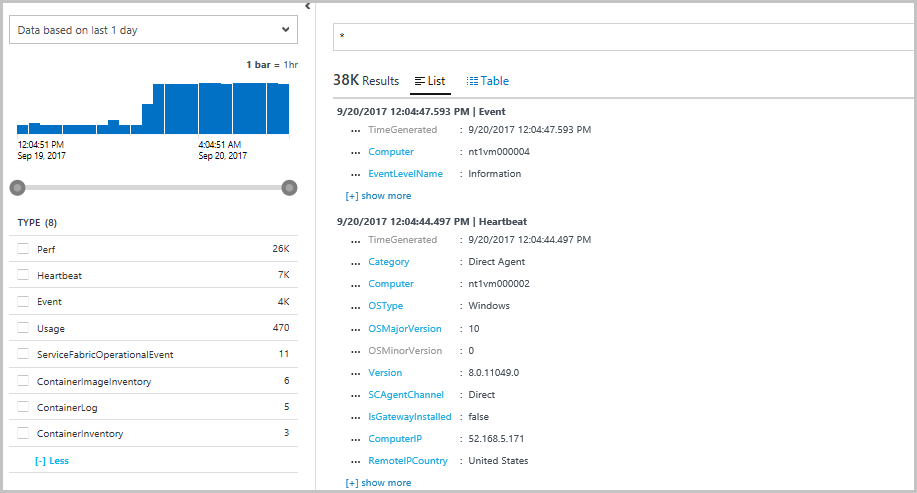
Selecting any of these panels takes you to the Kusto query that is generating the displayed value. Change the query to * to see all the different kinds of logs that are being picked up. From here, you can query or filter for container performance, logs, or look at Service Fabric platform events. Your agents are also constantly emitting a heartbeat from each node, that you can look at to make sure data is still being gathered from all your machines if your cluster configuration changes.
Configure Log Analytics agent to pick up performance counters
Another benefit of using the Log Analytics agent is the ability to change the performance counters you want to pick up through the log analytics UI experience, rather than having to configure the Azure diagnostics agent and do a Resource Manager template based upgrade each time. To do this, select on OMS Workspace on the landing page of your Container Monitoring (or Service Fabric) solution.
This takes you to your Log Analytics workspace, where you can view your solutions, create custom dashboards, as well as configure the Log Analytics agent.
- Select Advanced Settings to open the Advanced Settings menu.
- Select Connected Sources > Windows Servers to verify that you have 5 Windows Computers Connected.
- Select Data > Windows Performance Counters to search for and add new performance counters. Here you'll see a list of recommendations from Azure Monitor logs for performance counters you can collect as well as the option to search for other counters. Verify that Processor(_Total)% Processor Time and Memory(*)\Available MBytes counters are being collected.
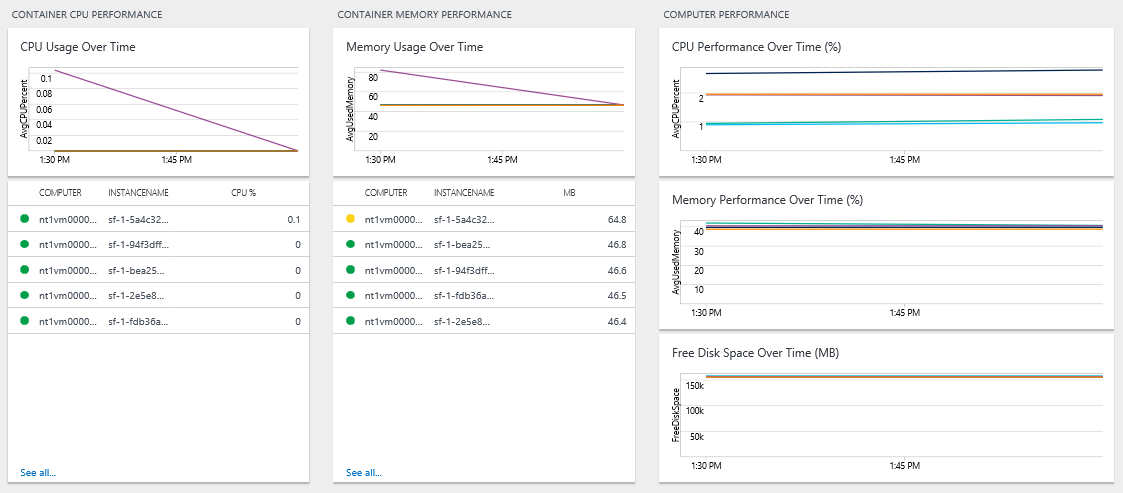
Refresh your Container Monitoring Solution in a few minutes, and you should start to see Computer Performance data coming in. This helps you understand how your resources are being used. You can also use these metrics to make appropriate decisions about scaling your cluster, or to confirm if a cluster is balancing your load as expected.
Note: Make sure your time filters are set appropriately for you to consume these metrics.
Next steps
In this tutorial, you learned how to:
- Configure Azure Monitor logs for your Service Fabric cluster
- Use a Log Analytics workspace to view and query logs from your containers and nodes
- Configure the Log Analytics agent to pick up container and node metrics
Now that you have configured monitoring for your containerized application, try:
- Configuring Azure Monitor logs for a Linux cluster, following similar steps as this tutorial. Reference this template to make changes in your Resource Manager template.
- Configure Azure Monitor logs to set up automated alerting to aid in detecting and diagnostics.
- Explore Service Fabric's list of recommended performance counters to configure for your clusters.
- Get familiarized with the log search and querying features offered as part of Azure Monitor logs.