Note
Access to this page requires authorization. You can try signing in or changing directories.
Access to this page requires authorization. You can try changing directories.
To support of the experience of viewing Impacted Resources, Service Health has features to:
- Display resources that are impacted due to a planned maintenance event.
- Provide impacted resources information for planned maintenance through the Service Health Portal.
This article details what is communicated to users and where they can view information about their impacted resources.
Viewing impacted resources for planned maintenance events in the Service Health portal
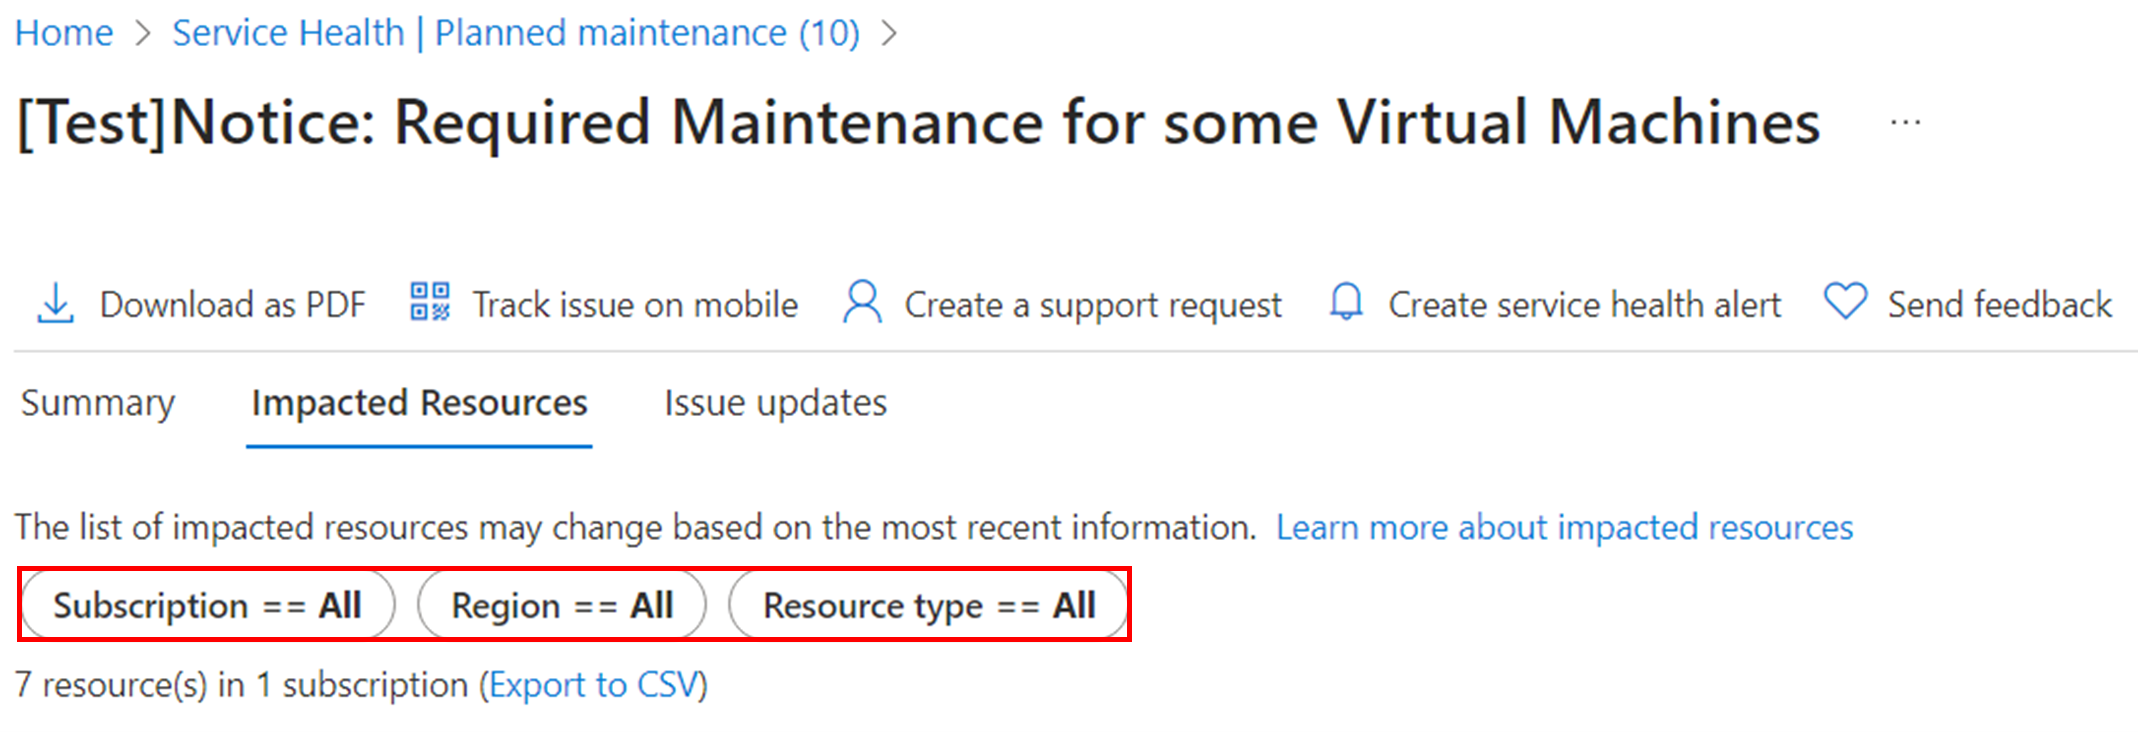
In the Azure portal, the Impacted Resources tab under Service Health > Planned Maintenance displays resources affected by a planned maintenance event. The following example of the Impacted Resources tab shows a planned maintenance event with impacted resources.
Service Health provides the following information on resources impacted by a planned maintenance event:
| Fields | Description |
|---|---|
| Resource Name | The name of the resource impacted by the planned maintenance event. |
| Resource Type | The type of resource impacted by the planned maintenance event. |
| Resource Group | The Resource group which contains the impacted resource. |
| Region | The Region which contains the impacted resource. |
| Subscription ID | The Unique ID for the subscription that contains the impacted resource. |
| Action(*) | A link to the applied update page during Self-Service window (only for rebootful updates on compute resources). |
| Self-serve Maintenance Due Date(*) | The due date for the Self-Service window when the the user applies the update (only for rebootful updates on compute resources). |
Note
Fields with an asterisk * are optional fields that are available depending on the resource type.
Filter the results
Customers can filter the results using these filters:
- Region: The region where the impacted resource is located.
- Subscription ID: All the subscription IDs the user has access to.
- Resource Type: All the resource types under the user subscriptions.
Export to a CSV file
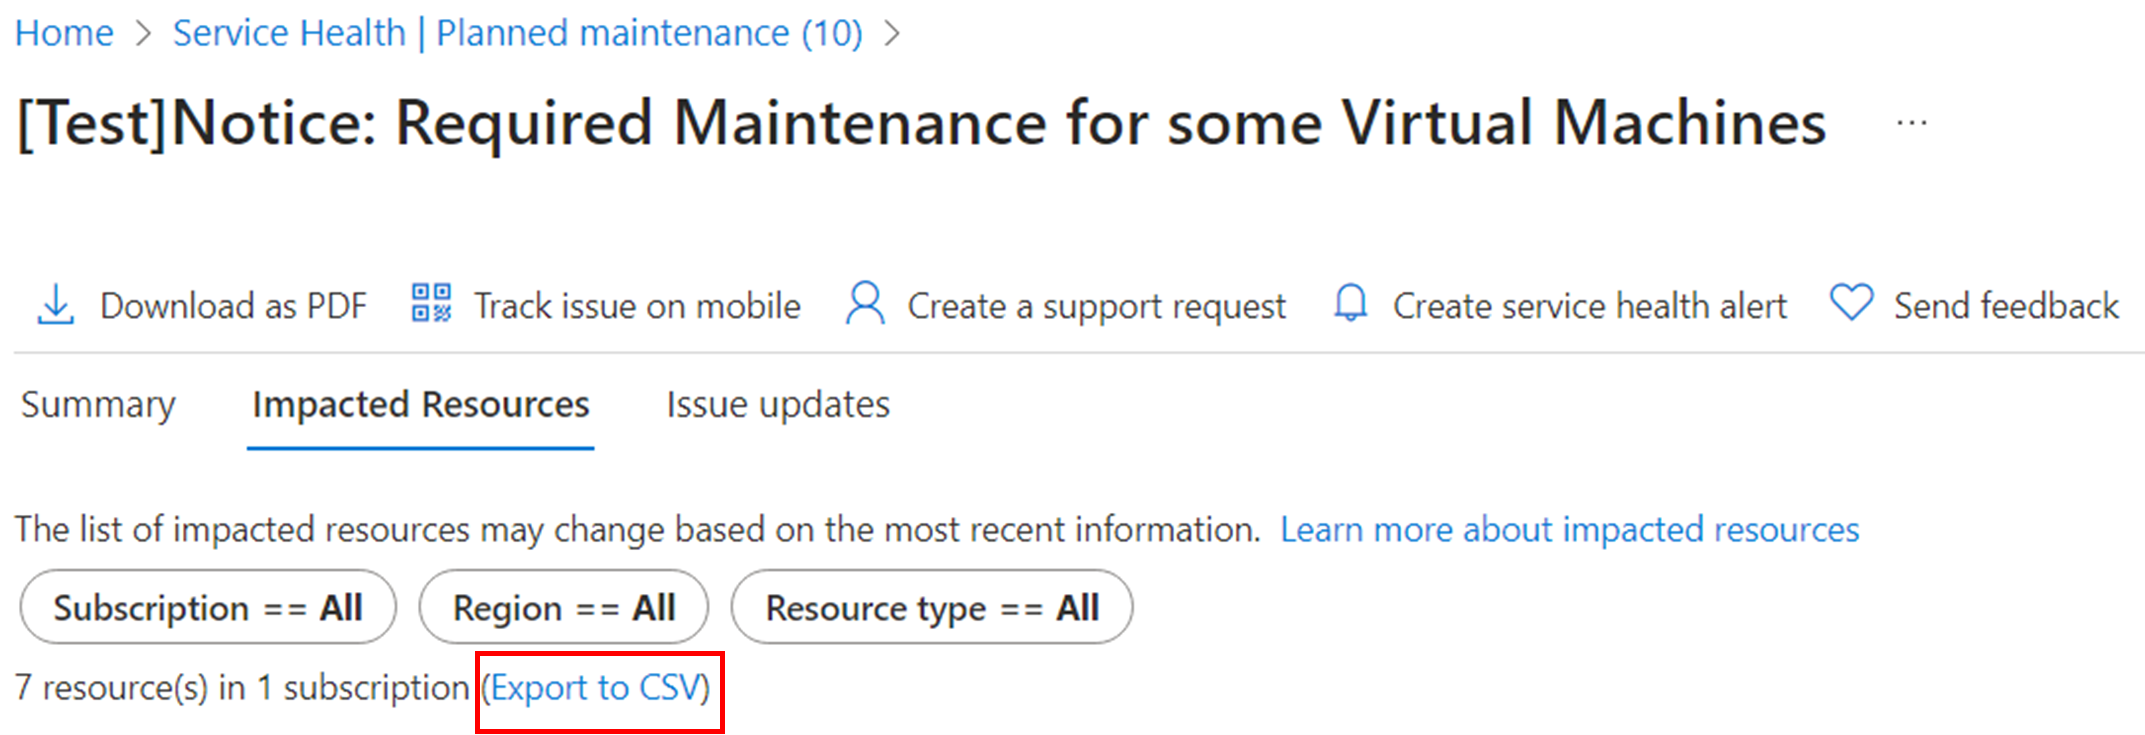
The list of impacted resources can be exported as an Excel file by clicking on this option.
The CSV file includes the properties associated with each event and more details per event level. This file could be used as a static point in time snapshot for all the active events under the Service Health > Planned maintenance view.
These details are a subset of more event level information available through Service Health API, which could be integrated with Event Grid or other event automation solutions.
This table contains a short description of each of the column properties.
| Column Property | Description |
|---|---|
| Title | The Title of the published event. |
| TrackingId | A unique identifier for each event, across different Service Health categories. |
| Impacted Services | One or more services applicable to the published maintenance event. |
| Impact Start Time | The Start Time in UTC for the event. There could be smaller work windows or timeframe within each event shared through update communications. |
| Impact End Time | The End Time in UTC for the event. There could be smaller work windows or timeframe within each event shared through update communications. |
| Subscription(s) | Any SubscriptionId's which are in the scope of the published event. |
| Estimated Impact Duration* | Estimated time in seconds for resource level impact. An event window could be for a broader timeframe (for example, several hours or sometimes even days). However, this field shows the estimated impact duration within the scheduled window. |
| Impact Type* | Predefined Impact types which are helpful in categorizing events based on how the service or resource level impact would be observed, during the event window. See more details on categories in the following section. |
| Recommendation* | Steps or recommended actions for users, based on the Impact Type. |
Note
Fields with an asterisk * are newly introduced properties which might be empty for some services, since they have yet to adopt the new layout.
Maintenance Impact Type and Duration fields
In our continuous quest to make the Planned maintenance notifications more reliable and predictable for customers, we recently added 3 new properties, specifically on the impact aspect for the published event. These properties are currently available through CSV export option or through Service Health API call.
Note
We're enabling more services to include these fields as part of event publishing, however there's a subset of services which are in process of onboarding and these fields might show no value for their events.
The impact on hosted services and end users
The Impact Type property is the key to answering this common concern. The Azure Service Health portal includes a new "Impact Type" field for maintenance events, which quickly shows the expected impact during the scheduled time.
We have a predefined set of categories which cover or represent different impact symptoms across Azure Services. There's a likelihood of minor overlap, as each service has its unique criteria on Impact, as per product design.
This table provides more insight into possible values for the Impact Type property. The description columns show the mapping with industry standard terms like blackout, brownout, and grayout.
| Impact Type Category | Description | Examples |
|---|---|---|
| Service Availability | #Blackout, #Impactful, #ServicePaused, #TempStorageLoss Resource or service is in paused state for a short duration. Events under this category might temporarily affect overall resource availability and/or user connections. |
Networking: The Virtual Machine (VM) might lose network connectivity and/or existing connections might be terminated. Compute (VMs): Temporary pause or freeze on virtual cores (CPU) affecting VM response times and connectivity. Service-heal process during forced update or Host health degradation is another common scenario. Storage: Complete or temporary pause on Disk IOs (for example, driver updates, or storage agent updates). SQL: Temporary impact to SQL databases from maintenance reconfigurations affecting query response times and brief loss of database connection. Long-running queries might be interrupted and might need to be restarted. |
| Performance Degradation | #Brownout, #ModerateImpact, #Latency, #IntermittentTimeouts, #Slowness, #VMStatePreserved The symptoms could vary for each service or product. For some like SQL Apps, latency or slower response times might be more evident to users or queries being executed. Resource is usually up and running but with degraded or limited functionality. More prominent for sensitive workloads. |
Networking: Visible degradation in connectivity leading to intermittent timeouts or disconnections. Slow response times while accessing disk drives (for example, during update the Accelerated Networking capability might be paused). Intermittent packet loss. Compute (VMs): Live Migration activity. Applications or users might observe slower processing. Another scenario is NIC reset where degraded connectivity could be observed for up to 9 seconds. Storage: Possibility of degraded disk IOPSs. SQL: DB latency request might experience delay or failure in read or write operations. |
| Network Connectivity | #Grayout, #ModerateImpact, #ConnectionTimeouts, #RetriesSucceed Moderate user impact as the events relate to the network stack. The impact duration is shorter as there are redundant layers built in per architecture design, which minimizes the overall impact. These timeouts could be for events related to T0, T1, NIC, or NMAgent upgrades and/or regional or zonal network cables and switches. |
Networking: Existing connections continue to operate, but new connections can't be established (which can happen during VFP updates, for example). Some of the ToR (Top of Rack) device related maintenance falls in this category. |
| Resource Unavailable | #Impactful, #Reboot, #Restart, #Redeploy, #Shutdown, #NoConnectivity, #Downtime An event with a relatively longer duration of resource downtime (for example, for VMs > 30 seconds). The service or resource could be unavailable for users and/or application. With newer platform design innovations, the frequency of events in this category is drastically reduced. |
Compute: VM's restart or reboot. Data on temporary storage could be lost. Operations like Reboot, Redeploy, Stop-Start a VM are common examples of this scenario. Initiating controlled maintenance for VMs falls in this category as it constitutes a redeployment. |
| Data Availability | #Grayout, #Failover #ModerateImpact, #ConnectionTimeouts, #QueryTimeouts, #RetriesSucceed Applicable for SQL suite of Apps. Impact to users is minimal and only seen while failover happens. |
SQL: Maintenance events can produce single or multiple reconfigurations or failovers, depending on constellation of the primary and secondary replicas at the beginning of the maintenance event. The average impact duration is few seconds. If already connected, your application must reconnect and long-running queries could be interrupted and might need to be restarted. |
| No Impact Expected | #NoImpact, #Impactless | No noticeable impact. Network: For example, fiber cable maintenance events usually don’t cause major issues—except during the brief moment when traffic is rerouted, which can then cause a minor, temporary packet loss. However, those packets are typically retried successfully. |
| Other (refer to message for details) | If none of these categories directly apply or if there are more than one of above categories applicable, then we would provide more details within the message content. | More than one of the Impact Categories is applicable. |
Impact duration
The Impact Duration field would show a numeric value representing the time in seconds the event would affect the listed resource. Depending on the service resiliency and implementation design, this Duration field combined with Impact Type field should help in overall level of Impact users might expect.
One key aspect to call out is the difference between the event StartTime/EndTime and the duration. While the event level fields like Start/End times represent the scheduled work window, the Impact duration field represents the actual downtime within that scheduled work window.


