Stream Azure Spring Apps managed component logs in real time
Note
Azure Spring Apps is the new name for the Azure Spring Cloud service. Although the service has a new name, you'll see the old name in some places for a while as we work to update assets such as screenshots, videos, and diagrams.
This article applies to: ❌ Basic/Standard ✔️ Enterprise
This article describes how to use the Azure CLI to get real-time logs of managed components for troubleshooting. You can also use diagnostics settings to analyze diagnostics data in Azure Spring Apps. For more information, see Analyze logs and metrics with diagnostics settings.
For streaming logs of applications in Azure Spring Apps, see Stream Azure Spring Apps application console logs in real time.
Prerequisites
- Azure CLI with the Azure Spring Apps extension, version 1.19.0 or higher. You can install the extension by using the following command:
az extension add --name spring.
Supported managed components
The following table lists the managed components that are currently supported, along with their subcomponents:
| Managed component | Subcomponents |
|---|---|
| Application Configuration Service | application-configuration-service flux-source-controller (Supported in ACS Gen2 version) |
| Spring Cloud Gateway | spring-cloud-gateway spring-cloud-gateway-operator |
You can use the following command to list all subcomponents:
az spring component list
    --resource-group <resource-group-name> \
    --service <Azure-Spring-Apps-instance-name>
Assign an Azure role
To stream logs of managed components, you must have the relevant Azure roles assigned to you. The following table lists the required roles and the operations for which these roles are granted permissions:
| Managed component | Required role | Operations |
|---|---|---|
| Application Configuration Service | Azure Spring Apps Application Configuration Service Log Reader Role | Microsoft.AppPlatform/Spring/ApplicationConfigurationService/logstream/action |
| Spring Cloud Gateway | Azure Spring Apps Spring Cloud Gateway Log Reader Role | Microsoft.AppPlatform/Spring/SpringCloudGateway/logstream/action |
Use the following steps to assign an Azure role using the Azure portal:
Open the Azure portal.
Open your Azure Spring Apps service instance.
In the navigation pane, select Access Control (IAM).
On the Access Control (IAM) page, select Add and then select Add role assignment.

On the Add role assignment page, in the Name list, search for and select the target role and then select Next.

Select Members and then search for and select your username.
Select Review + assign.


List all instances in a component
Use the following command to list all instances in a component:
az spring component instance list \
    --resource-group <resource-group-name> \
    --service <Azure-Spring-Apps-instance-name> \
    --component <component-name>
For example, to list all instances for flux-source-controller in ACS Gen2 version, use the following command:
az spring component instance list \
    --resource-group <resource-group-name> \
    --service <Azure-Spring-Apps-instance-name> \
    --component flux-source-controller
View tail logs
This section provides examples of using the Azure CLI to produce tail logs.
View tail logs for a specific instance
To view the tail logs for a specific instance, use the az spring component logs command with the -i/--instance argument, as shown in the next section.
View tail logs for an instance of application-configuration-service
Use the following command to view the tail logs for application-configuration-service:
az spring component logs \
    --resource-group <resource-group-name> \
    --service <Azure-Spring-Apps-instance-name> \
    --name application-configuration-service \
    --instance <instance-name>
For ACS Gen2, the command returns logs similar to the following example:
...
2023-12-18T07:09:54.020Z  INFO  16715 --- [main] o.s.b.w.embedded.tomcat.TomcatWebServer  : Tomcat initialized with port(s): 8090 (https)
2023-12-18T07:09:54.116Z  INFO  16715 --- [main] org.apache.juli.logging.DirectJDKLog     : Starting service [Tomcat]
2023-12-18T07:09:54.117Z  INFO  16715 --- [main] org.apache.juli.logging.DirectJDKLog     : Starting Servlet engine: [Apache Tomcat/10.1.12]
2023-12-18T07:09:54.522Z  INFO  16715 --- [main] org.apache.juli.logging.DirectJDKLog     : Initializing Spring embedded WebApplicationContext
2023-12-18T07:09:54.524Z  INFO  16715 --- [main] w.s.c.ServletWebServerApplicationContext : Root WebApplicationContext: initialization completed in 14100 ms
2023-12-18T07:09:56.920Z  INFO  16715 --- [main] o.s.b.w.embedded.tomcat.TomcatWebServer  : Tomcat started on port(s): 8090 (https) with context path ''
2023-12-18T07:09:57.528Z  INFO  16715 --- [main] o.s.b.w.embedded.tomcat.TomcatWebServer  : Tomcat initialized with port(s): 8081 (http)
2023-12-18T07:09:57.529Z  INFO  16715 --- [main] org.apache.juli.logging.DirectJDKLog     : Starting service [Tomcat]
2023-12-18T07:09:57.529Z  INFO  16715 --- [main] org.apache.juli.logging.DirectJDKLog     : Starting Servlet engine: [Apache Tomcat/10.1.12]
2023-12-18T07:09:57.629Z  INFO  16715 --- [main] org.apache.juli.logging.DirectJDKLog     : Initializing Spring embedded WebApplicationContext
2023-12-18T07:09:57.629Z  INFO  16715 --- [main] w.s.c.ServletWebServerApplicationContext : Root WebApplicationContext: initialization completed in 603 ms
2023-12-18T07:09:57.824Z  INFO  16715 --- [main] o.s.b.w.embedded.tomcat.TomcatWebServer  : Tomcat started on port(s): 8081 (http) with context path ''
2023-12-18T07:09:58.127Z  INFO  16715 --- [main] o.springframework.boot.StartupInfoLogger : Started ReconcilerApplication in 21.005 seconds (process running for 22.875)
...
View tail logs for an instance of flux-source-controller
Use the following command to view the tail logs for flux-source-controller:
az spring component logs \
    --resource-group <resource-group-name> \
    --service <Azure-Spring-Apps-instance-name> \
    --name flux-source-controller \
    --instance <instance-name>
The command returns logs similar to the following example:
...
{"level":"info","ts":"2023-12-18T07:07:54.615Z","logger":"controller-runtime.metrics","msg":"Metrics server is starting to listen","addr":":8080"}
{"level":"info","ts":"2023-12-18T07:07:54.615Z","logger":"setup","msg":"starting manager"}
{"level":"info","ts":"2023-12-18T07:07:54.615Z","msg":"Starting server","path":"/metrics","kind":"metrics","addr":"[::]:8080"}
{"level":"info","ts":"2023-12-18T07:07:54.615Z","msg":"Starting server","kind":"health probe","addr":"[::]:9440"}
{"level":"info","ts":"2023-12-18T07:07:54.817Z","logger":"runtime","msg":"attempting to acquire leader lease flux-system/source-controller-leader-election...\n"}
{"level":"info","ts":"2023-12-18T07:07:54.830Z","logger":"runtime","msg":"successfully acquired lease flux-system/source-controller-leader-election\n"}
...
View tail logs for an instance of spring-cloud-gateway
Use the following command to view the tail logs for spring-cloud-gateway:
az spring component logs \
    --resource-group <resource-group-name> \
    --service <Azure-Spring-Apps-instance-name> \
    --name spring-cloud-gateway \
    --instance <instance-name>
The command returns logs similar to the following example:
...
2023-12-11T14:13:40.310Z  INFO 1 --- [           main] i.p.s.c.g.s.SsoDeactivatedConfiguration  : SSO is deactivated, setting up default security filters
2023-12-11T14:13:40.506Z  INFO 1 --- [           main] .h.HazelcastReactiveSessionConfiguration : Configuring Hazelcast as a session management storage
2023-12-11T14:13:51.008Z  INFO 1 --- [           main] o.s.b.web.embedded.netty.NettyWebServer  : Netty started on port 8443
2023-12-11T14:13:51.810Z  INFO 1 --- [           main] o.s.b.a.e.web.EndpointLinksResolver      : Exposing 7 endpoint(s) beneath base path '/actuator'
2023-12-11T14:13:52.410Z  INFO 1 --- [           main] o.s.b.web.embedded.netty.NettyWebServer  : Netty started on port 8090
2023-12-11T14:13:52.907Z  INFO 1 --- [           main] i.p.s.c.g.r.h.HazelcastRateLimitsRemover : Removing Hazelcast map 'GLOBAL_RATE_LIMIT' with rate limit information
2023-12-11T14:13:52.912Z  INFO 1 --- [           main] i.p.s.cloud.gateway.GatewayApplication   : Started GatewayApplication in 36.084 seconds (process running for 38.651)
...
View tail logs for an instance of spring-cloud-gateway-operator
Use the following command to view the tail logs for spring-cloud-gateway-operator:
az spring component logs \
    --resource-group <resource-group-name> \
    --service <Azure-Spring-Apps-instance-name> \
    --name spring-cloud-gateway-operator \
    --instance <instance-name>
The command returns logs similar to the following example:
...
2023-12-01T08:37:05.080Z  INFO 1 --- [           main] c.v.t.s.OperatorApplication              : Starting OperatorApplication v2.0.6 using Java 17.0.7 with PID 1 (/workspace/BOOT-INF/classes started by cnb in /workspace)
2023-12-01T08:37:05.157Z  INFO 1 --- [           main] c.v.t.s.OperatorApplication              : No active profile set, falling back to 1 default profile: "default"
2023-12-01T08:37:14.379Z  INFO 1 --- [           main] o.s.b.a.e.web.EndpointLinksResolver      : Exposing 1 endpoint(s) beneath base path '/actuator'
2023-12-01T08:37:15.274Z  INFO 1 --- [           main] o.s.b.web.embedded.netty.NettyWebServer  : Netty started on port 8080
2023-12-01T08:37:15.366Z  INFO 1 --- [           main] c.v.t.s.OperatorApplication              : Started OperatorApplication in 11.489 seconds (process running for 12.467)
...
View tail logs for all instances in one command
To view the tail logs for all instances, use the --all-instances argument, as shown in the following command. The instance name is the prefix of each log line. When there are multiple instances, logs are printed in batch for each instance, so logs of one instance aren't interleaved with the logs of another instance.
az spring component logs \
    --resource-group <resource-group-name> \
    --service <Azure-Spring-Apps-instance-name> \
    --name <component-name> \
    --all-instances
Stream new logs continuously
By default, az spring component logs prints only existing logs streamed to the console and then exits. If you want to stream new logs, add the -f/--follow argument.
When you use the -f/--follow option to tail instant logs, the Azure Spring Apps log streaming service sends heartbeat logs to the client every minute unless the component is writing logs constantly. Heartbeat log messages use the following format: 2023-12-18 09:12:17.745: No log from server.
Stream logs for a specific instance
Use the following command to stream logs for a specific instance:
az spring component logs \
    --resource-group <resource-group-name> \
    --service <Azure-Spring-Apps-instance-name> \
    --name <component-name> \
    --instance <instance-name> \
    --follow
Stream logs for all instances
Use the following command to stream logs for all instances:
az spring component logs \
    --resource-group <resource-group-name> \
    --service <Azure-Spring-Apps-instance-name> \
    --name <component-name> \
    --all-instances \
    --follow
When you stream logs for multiple instances in a component, the logs of one instance interleave with logs of others.
Stream logs in a virtual network injection instance
For an Azure Spring Apps instance deployed in a custom virtual network, you can access log streaming by default from a private network. For more information, see Deploy Azure Spring Apps in a virtual network
Azure Spring Apps also enables you to access real-time managed component logs from a public network.
Note
Enabling the log streaming endpoint on the public network adds a public inbound IP to your virtual network. Be sure to use caution if this is a concern for you.
Use the following steps to enable a log streaming endpoint on the public network:
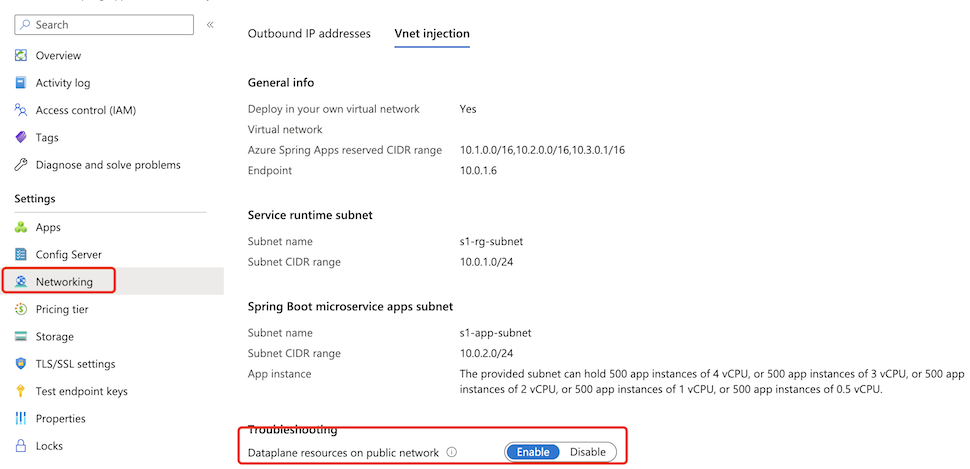
Select the Azure Spring Apps service instance deployed in your virtual network and then select Networking in the navigation menu.
Select the Vnet injection tab.
Switch the status of Dataplane resources on public network to Enable to enable a log streaming endpoint on the public network. This process takes a few minutes.

After you enable the log stream public endpoint, you can access the managed component logs from a public network just like you would access a normal instance.
Secure traffic to the log streaming public endpoint
Log streaming for managed components uses Azure RBAC to authenticate the connections to the components. As a result, only users who have the proper roles can access the logs.
To ensure the security of your managed components when you expose a public endpoint for them, secure the endpoint by filtering network traffic to your service with a network security group. For more information, see Tutorial: Filter network traffic with a network security group using the Azure portal. A network security group contains security rules that allow or deny inbound network traffic to, or outbound network traffic from, several types of Azure resources. For each rule, you can specify source and destination, port, and protocol.
Note
If you can't access managed component logs in the virtual network injection instance from the internet after you enable a log stream public endpoint, check your network security group to see whether you've allowed such inbound traffic.
The following table shows an example of a basic rule that we recommend. You can use commands like nslookup with the endpoint <service-name>.private.azuremicroservices.io to get the target IP address of a service.
| Priority | Name | Port | Protocol | Source | Destination | Action |
|---|---|---|---|---|---|---|
| 100 | Rule name | 80 | TCP | Internet | Service IP address | Allow |
| 110 | Rule name | 443 | TCP | Internet | Service IP address | Allow |
Next steps
Feedback
Coming soon: Throughout 2024 we will be phasing out GitHub Issues as the feedback mechanism for content and replacing it with a new feedback system. For more information see: https://aka.ms/ContentUserFeedback.
Submit and view feedback for