How to enable Azure Storage Mover copy and job logs
When you use a migration tool to move your critical data from on-premises sources to Azure destination targets, you want to be able to monitor operations for potential issues. The data relating to the operations performed during your migration can be stored as either logs entries or metrics. When configured, Azure Storage Mover can provide Copy logs and Job run logs. These logs are especially useful because they allow you to trace the migration result of job runs and of individual files.
Both the copy and job run logs can be sent to an Azure Analytics Workspace. Analytics workspaces are storage units where Azure services store the log data they generate. Log Analytics is integrated into the Storage Mover portal experience. This integration allows you to see the relevant logs for your copy jobs within the same surface you use to manage them. More importantly, the integration also allows you to create and run log queries from multiple logs and interactively analyze their results.
Important
Before you can access your migration's log data, you need to ensure that you've created an Azure Analytics Workspace and configured your Storage Mover instance to use it. Any logs generated prior to this configuration will be lost. You may be able to retrieve limited log information directly from the agent.
This article describes the steps involved in creating an analytics workspace and to configure a diagnostic setting within a storage mover resource.
Configuring Azure Log Analytics and Storage Mover
This section briefly describes how to configure an Azure Monitor Log Analytics Workspace and Storage Mover diagnostic settings. After completing the following steps, you'll be able to query the data provided by your Storage Mover resource.
Create a Log Analytics workspace
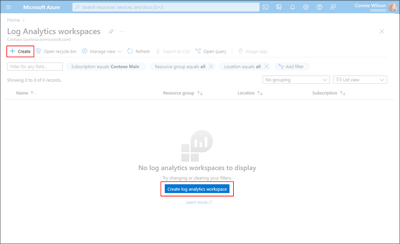
Storage Mover collects copy and job logs, and stores the information in an Azure Log Analytics workspace. After you've created a workspace, you can configure Storage Mover to save its data there. If you don't have an existing workspace, you can create one in the Azure portal.
Enter Log Analytics in the search box and select Log Analytics workspace. In the content pane, select either Create or Create log analytics workspace to create a workspace. Provide values for the Subscription, Resource Group, Name, and Region fields, and select Review + Create.
You can get more detailed information about Log Analytics and its features by visiting the Log Analytics overview article. If you prefer to view a tutorial, you can visit the Log Analytics tutorial instead.
Configure Storage Mover diagnostic settings
After an analytics workspace has been created, you can specify it as the destination in which Storage Mover logs and metrics can be displayed.
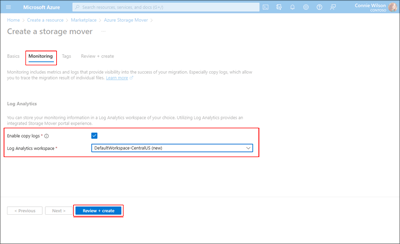
There are two options for configuring Storage Mover to send logs to your analytics workspace. First, you can configure diagnostic settings during the initial deployment of your top-level Storage Mover resource. The following example shows how to specify diagnostic settings in the Azure portal during Storage Mover resource creation.
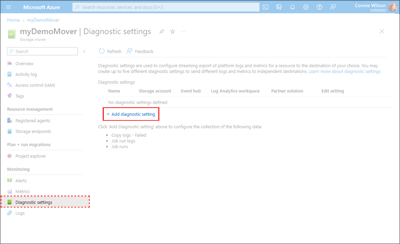
You may also choose to add a diagnostic setting to a Storage Mover resource after it's been deployed. To add the diagnostic setting, navigate to the Storage Mover resource. In the menu pane, select Diagnostic settings and then select Add diagnostic setting as shown in the following example.
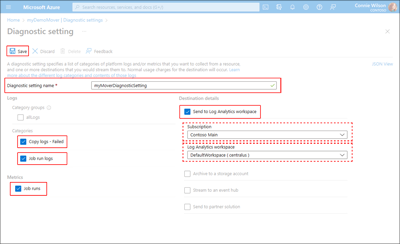
In the Diagnostic setting pane, provide a value for the Diagnostic setting name. Within the Logs group, select one or more log categories to be collected. You may also select the Job runs option within the Metrics group to view the results of your individual job runs. Within the Destination details group, select Send to Log Analytics workspace, the name of your subscription, and the name of the Log Analytics workspace to collect your log data. Finally, select Save to add your new diagnostic setting. You can view the image provided as a reference.
After your Storage Mover diagnostic setting has been saved, it will be reflected on the Diagnostic settings screen within the Diagnostic settings table.
Analyzing logs
All resource logs in Azure Monitor have the same fields, and are followed by service-specific fields. The common schema is outlined in Azure Monitor resource log schema.
Storage Mover generates two tables, StorageMoverCopyLogsFailed and StorageMoverJobRunLogs. The schema for StorageMoverCopyLogsFailed is found in the Azure Storage Copy log data reference, and the schema for StorageMoverJobRunLogs is found in the Azure Storage Job run log data reference.
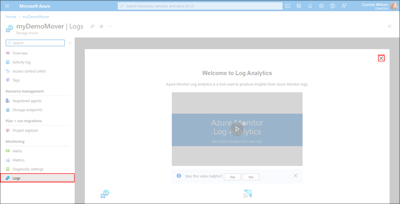
Your log data is integrated into Storage Mover's Azure portal user interface (UI) experience. To access your log data, migrate to your top-level storage mover resource and select Logs from within the Monitoring group in the navigation pane. Close the initial Welcome to Log Analytics window displayed in the main content pane as shown in the following example.
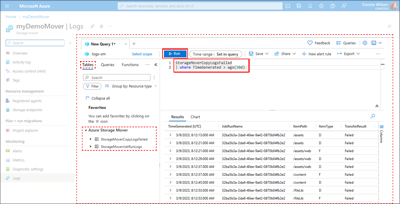
After the Welcome window is closed within the main content pane, the New Query window is displayed. In the schema and filter pane, ensure that the Tables object is selected and that the StorageMoverCopyLogsFailed and StorageMoverJobRunLogs tables are visible. Using Kusto Query Language (KQL) queries, you can begin extracting log data from the tables displayed within the schema and filter pane. Enter your query into the query editing field and select Run as shown in the following screen capture. A simple query example is also provided used to retrieve details on any failed copy operations from the previous 60 days.
    StorageMoverCopyLogsFailed
    | top 1000 by timeGenerated desc
Sample Kusto queries
After you send logs to Log Analytics, you can access those logs by using Azure Monitor log queries. For more information, see the Log Analytics tutorial.
The following sample queries provided can be entered in the Log search bar to help you monitor your migration. These queries work with the new language.
To list all the files that failed to copy from a specific job run within the last 30 days.
    StorageMoverCopyLogsFailed
    | where TimeGenerated > ago(30d) and JobRunName == "[job run ID]"
To list the 10 most common copy log error codes over the last seven days.
StorageMoverCopyLogsFailed
| where TimeGenerated > ago(7d)
| summarize count() by StatusCode
| top 10 by count_ desc
To list the 10 most recent job failure error codes over the last three days.
StorageMoverJobRunLogs
| where TimeGenerated > ago(3d) and StatusCode != "AZSM0000"
| summarize count() by StatusCode
| top 10 by count_ desc
To create a pie chart of failed copy operations grouped by job run over the last 30 days.
StorageMoverCopyLogsFailed
| where TimeGenerated > ago(30d)
| summarize count() by JobRunName
| sort by count_ desc
| render piechart
Next steps
Get started with any of these guides.
