Note
Access to this page requires authorization. You can try signing in or changing directories.
Access to this page requires authorization. You can try changing directories.
Use Azure File Sync to centralize your organization's file shares in Azure Files, while keeping the flexibility, performance, and compatibility of an on-premises file server. Azure File Sync transforms Windows Server into a quick cache of your Azure file share. You can use any protocol that's available on Windows Server to access your data locally, including SMB, NFS, and FTPS. You can have as many caches as you need across the world.
Built in monitoring for Azure File Sync
This article describes how to monitor your Azure File Sync deployment by using Azure Monitor, Storage Sync Service, and Windows Server. It covers the following scenarios:
- View Azure File Sync metrics in Azure Monitor.
- Create alerts in Azure Monitor to proactively notify you of critical conditions.
- View health of your Azure File Sync deployment using the Azure portal.
- Use the event logs and performance counters on Windows Server to monitor the health of your Azure File Sync deployment.
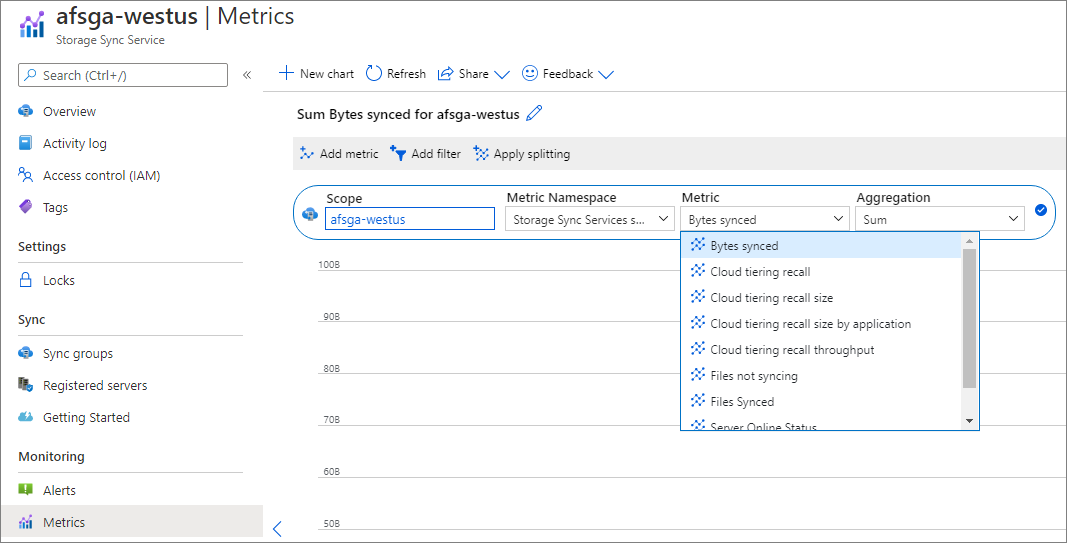
View Azure File Sync metrics
Metrics for Azure File Sync are enabled by default and are sent to Azure Monitor every 15 minutes.
To view Azure File Sync metrics in Azure Monitor:
- Go to your Storage Sync Service in the Azure portal and select Metrics.
- Select the Metric drop-down and select the metric you want to view.
Alerts proactively notify you when important conditions are found in your monitoring data. To learn more about configuring alerts in Azure Monitor, see Overview of alerts in Microsoft Azure.
Alerts
To create alerts for Azure File Sync:
- Go to your Storage Sync Service in the Azure portal.
- Select Alerts in the Monitoring section and then select + New alert rule.
- Select Select condition and provide the following information for the alert:
- Metric
- Dimension name
- Alert logic
- Select Select action group and add an action group (email, SMS, etc.) to the alert either by selecting an existing action group or creating a new action group.
- Fill in the Alert details like Alert rule name, Description, and Severity.
- Select Create alert rule to create the alert.
Note
If you configure an alert using the Server Name dimension and the server is renamed, the alert will need to be updated to monitor the new server name.
Storage Sync Service
To view the health of your Azure File Sync deployment in the Azure portal, navigate to the Storage Sync Service. The following information is available:
Registered server health
Server endpoint health
- Persistent sync errors
- Transient sync errors
- Sync activity (Upload to cloud, Download to server)
- Cloud tiering space savings
- Tiering errors
- Recall errors
Metrics
Registered server health
To view the registered server health in the portal, navigate to the Registered servers section of the Storage Sync Service.
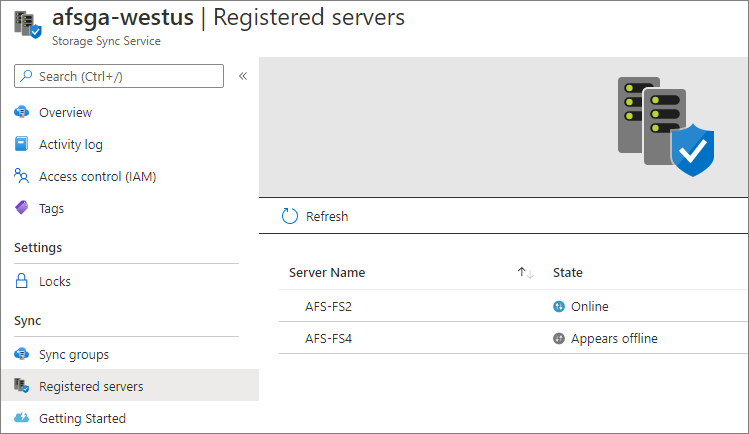
- If the Registered server state is Online, the server is successfully communicating with the service.
- If the Registered server state is Appears Offline, the Storage Sync Monitor process (AzureStorageSyncMonitor.exe) isn't running or the server is unable to access the Azure File Sync service. For more information, see the troubleshooting documentation.
Server endpoint health
To view the health of a server endpoint in the portal, navigate to the Sync groups section of the Storage Sync Service and select a sync group.
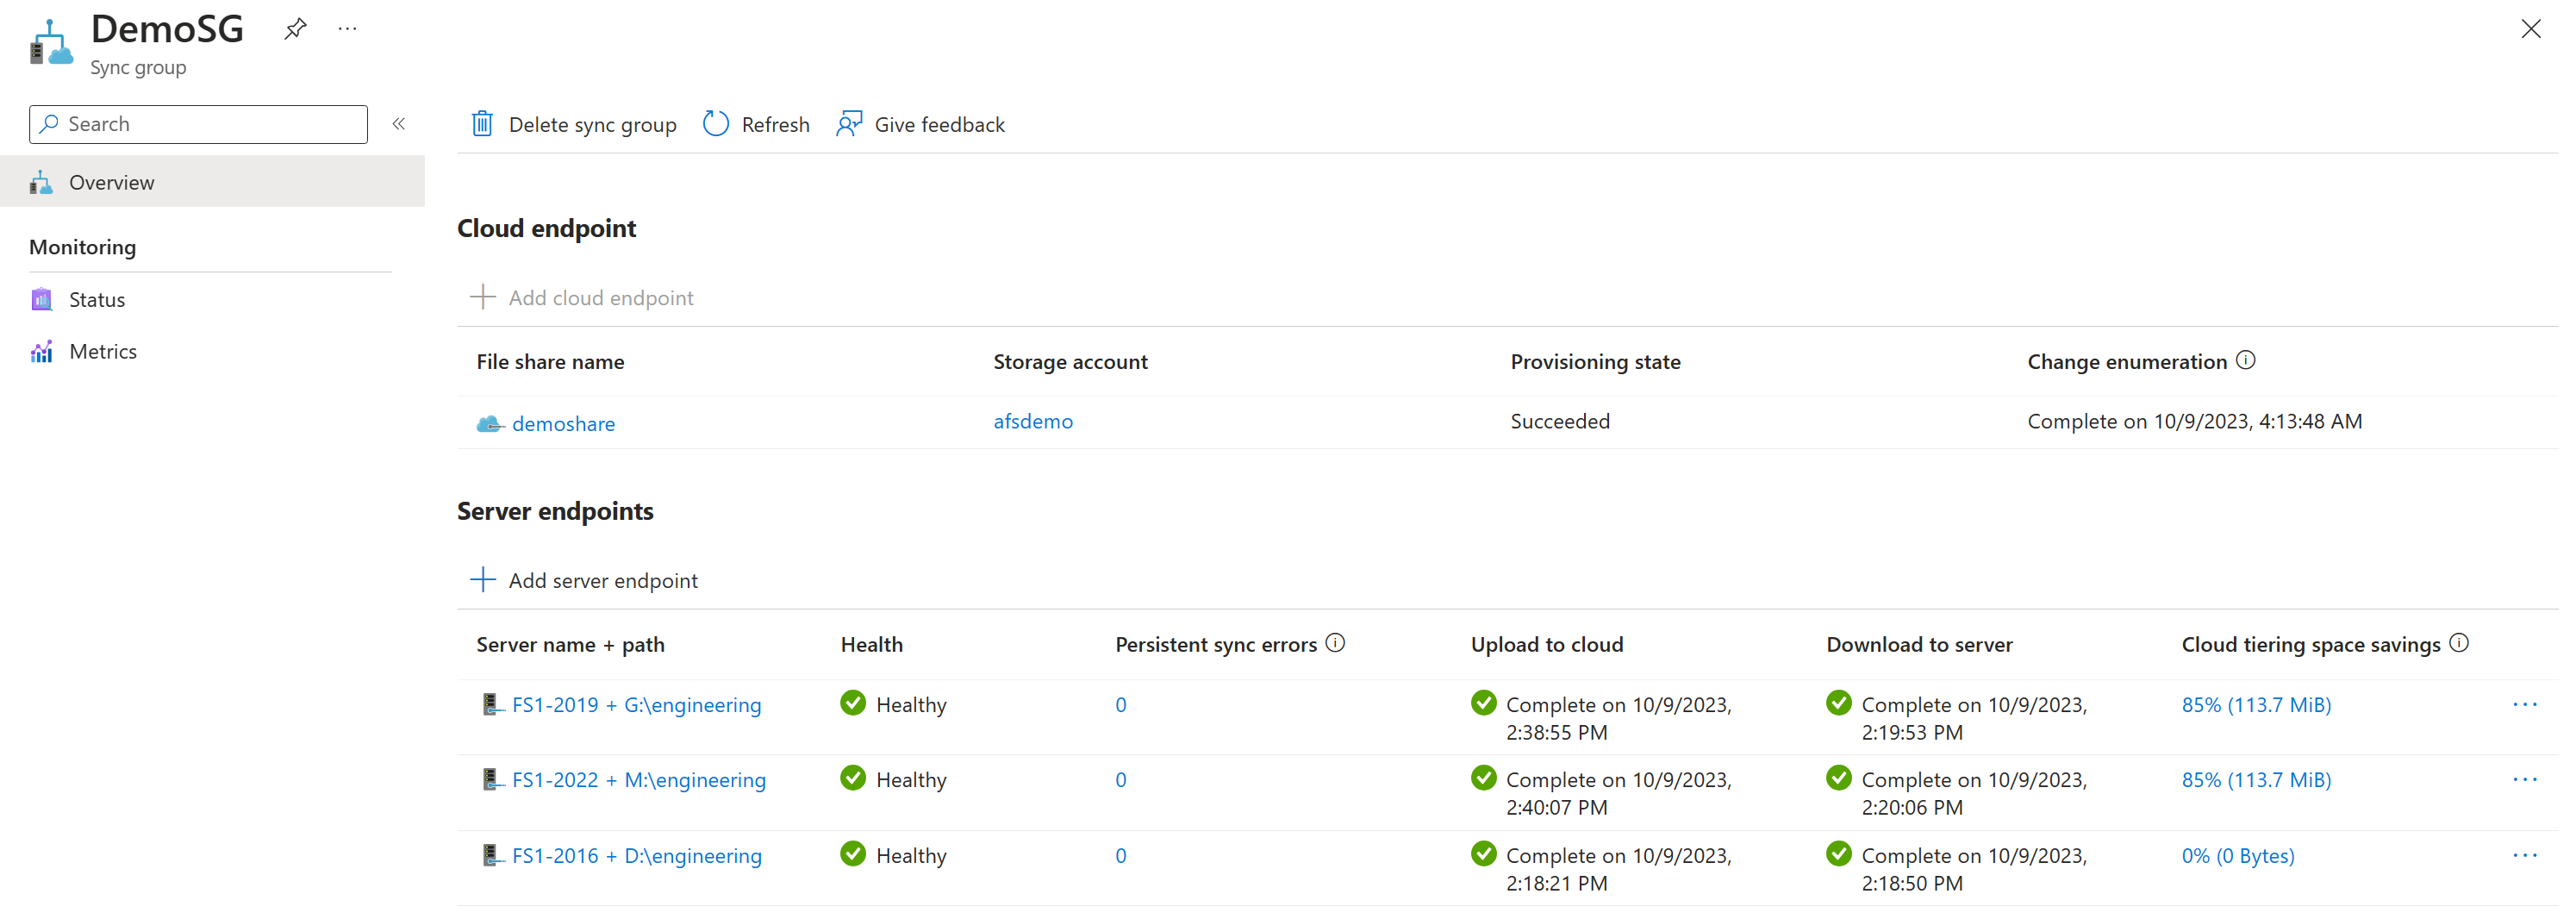
- The server endpoint health and sync activity (Upload to cloud, Download to server) in the portal is based on the sync events that are logged in the Telemetry event log at the server (ID 9102 and 9302). If a sync session fails because of a transient error, such as error canceled, the server endpoint still shows as Healthy in the portal as long as the current sync session is making progress (files are applied). Event ID 9302 is the sync progress event and Event ID 9102 is logged once a sync session completes. For more information, see sync health and sync progress. If the server endpoint health shows a status other than Healthy, see the troubleshooting documentation for guidance.
- The Persistent sync errors and Transient sync errors count in the portal is based on the Event ID 9121 that is logged in the Telemetry event log at the server. This event is logged for each per-item error once the sync session completes. To view the errors in the portal, go to the Server Endpoint Properties and navigate to the Errors + troubleshooting section. To resolve per-item errors, see How do I see if there are specific files or folders that aren't syncing?.
- The Cloud tiering space savings provides the amount of disk space saved by cloud tiering. The data provided for Cloud tiering space savings is based on Event ID 9071 that is logged in the Telemetry event log at the server. To view other cloud tiering information and metrics, go to the Server Endpoint Properties and navigate to the Cloud tiering status section. To learn more, see Monitor cloud tiering.
- To view Tiering errors and Recall errors in the portal, go to the Server Endpoint Properties and navigate to the Errors + troubleshooting section. Tiering errors is based on Event ID 9003 that is logged in the Telemetry event log at the server and Recall errors is based on Event ID 9006. For more information about files that fail to tier or recall, see How to troubleshoot files that fail to tier and How to troubleshoot files that fail to be recalled.
Metric charts
The following metric charts are viewable in the Storage Sync Service portal:
| Metric name | Description | Page name |
|---|---|---|
| Agent Version Expiration Information | Number of days until the agent version expires | Storage Sync Service - Metrics |
| Bytes synced | Size of data transferred (upload and download) | Sync Group - Status, Server endpoint - Sync status, Storage Sync Service - Metrics |
| Cache data size by last access time | Size of data by last access time | Server Endpoint - Cloud Tiering Status, Storage Sync Service - Metrics |
| Cloud tiering cache hit rate | Percentage of bytes that have been served from the cache vs. recalled from the cloud | Sync Group - Status, Server Endpoint - Cloud Tiering Status, Storage Sync Service - Metrics |
| Cloud tiering low disk space mode | Status of disk space on server | Storage Sync Service - Metrics |
| Cloud tiering recall success rate | Success status of cloud tiering recall | Storage Sync Service - Metrics |
| Cloud tiering size of data tiered | Size of data tiered | Storage Sync Service - Metrics |
| Cloud tiering size of data tiered by last maintenance job | Size of data tiered during last maintenance job. | Storage Sync Service - Metrics |
| Cloud tiering recall size | Size of data recalled | Sync Group – Status, Registered Servers, Storage Sync Service - Metrics |
| Cloud tiering recall size by application | Size of data recalled by application | Server Endpoint - Cloud Tiering Status, Storage Sync Service - Metrics |
| Cloud tiering recall throughput | Throughput of data recalled | Storage Sync Service - Metrics |
| Egress Breakdown | Egress breakdown by user recalls of tiered files, background recalls, and sync downloads | Server Endpoint - Cloud Tiering Status |
| Files synced | Count of files transferred (upload and download) | Sync Group - Status, Server endpoint - Sync status, Storage Sync Service - Metrics |
| Files not syncing | Count of files that are failing to sync | Sync Group - Status, Server endpoint - Sync status, Storage Sync Service - Metrics |
| Server cache size | Size of data cached on server | Storage Sync Service - Metrics |
| Server online status | Count of heartbeats received from the server. | Registered Servers, Storage Sync Service - Metrics |
| Space Savings | Space savings breakdown for local cache versus cloud-tiered data | Server Endpoint - Cloud Tiering Status |
| Sync Session Result | Success status of sync session | Sync Group - Status, Storage Sync Service - Metrics |
| Tiered Data by Tiering Policies | Number of Files Tiered with reason for tiering | Server Endpoint - Cloud Tiering Status |
Note
The charts in the Storage Sync Service portal have a time range of 24 hours. To view different time ranges or dimensions, use Azure Monitor.
Windows Server
On the Windows Server that has the Azure File Sync agent installed, you can view the health of the server endpoints on that server using the event logs and performance counters.
Event logs
To monitor registered server, sync, and cloud tiering health, use the Telemetry event server log. The Telemetry event log is located in Event Viewer under Applications and Services\Microsoft\FileSync\Agent.
Sync health
Event ID 9102 is logged once a sync session completes. Use this event to determine if sync sessions are successful (HResult = 0) and if there are per-item sync errors (PerItemErrorCount). For more information, see the sync health and per-item errors documentation.
Note
Sometimes sync sessions fail overall or have a non-zero PerItemErrorCount. However, they still make forward progress, and some files sync successfully. You can see this in the Applied fields such as AppliedFileCount, AppliedDirCount, AppliedTombstoneCount, and AppliedSizeBytes. These fields tell you how much of the session succeeded. If you see multiple sync sessions fail in a row, and they have an increasing Applied count, give sync time to try again before you open a support ticket.
Event ID 9121 is logged for each per-item error once the sync session completes. Use this event to determine the number of files that are failing to sync with this error (PersistentCount and TransientCount). You should investigate persistent per-item errors. For more information, see How do I see if there are specific files or folders that aren't syncing?.
Event ID 9302 is logged every 5 to 10 minutes if there's an active sync session. Use this event to determine how many items are to be synced (TotalItemCount), number of items that synced so far (AppliedItemCount) and number of items that failed to sync due to a per-item error (PerItemErrorCount). If sync isn't making progress (AppliedItemCount=0), the sync session eventually fails and an Event ID 9102 is logged with the error. For more information, see the sync progress documentation.
Registered server health
- Event ID 9301 is logged every 30 seconds when a server queries the service for jobs. If GetNextJob finishes with status = 0, the server is able to communicate with the service. If GetNextJob finishes with an error, check the troubleshooting documentation for guidance.
Cloud tiering health
To monitor tiering activity on a server, use Event ID 9003, 9016 and 9029 in the Telemetry event log, which is located in Event Viewer under Applications and Services\Microsoft\FileSync\Agent.
- Event ID 9003 provides error distribution for a server endpoint. For example: Total Error Count and ErrorCode. One event is logged per error code.
- Event ID 9016 provides ghosting results for a volume. For example: Free space percent is, Number of files ghosted in session, and Number of files failed to ghost.
- Event ID 9029 provides ghosting session information for a server endpoint. For example: Number of files attempted in the session, Number of files tiered in the session, and Number of files already tiered.
To monitor recall activity on a server, use Event ID 9005, 9006, 9009, 9059 and 9071 in the Telemetry event log, which is located in Event Viewer under Applications and Services\Microsoft\FileSync\Agent.
- Event ID 9005 provides recall reliability for a server endpoint. For example: Total unique files accessed, and Total unique files with failed access.
- Event ID 9006 provides recall error distribution for a server endpoint. For example: Total Failed Requests, and ErrorCode. One event is logged per error code.
- Event ID 9009 provides recall session information for a server endpoint. For example: DurationSeconds, CountFilesRecallSucceeded, and CountFilesRecallFailed.
- Event ID 9059 provides application recall distribution for a server endpoint. For example: ShareId, Application Name, and TotalEgressNetworkBytes.
- Event ID 9071 provides cloud tiering efficiency for a server endpoint. For example: TotalDistinctFileCountCacheHit, TotalDistinctFileCountCacheMiss, TotalCacheHitBytes, and TotalCacheMissBytes.
Performance counters
Use the Azure File Sync performance counters on the server to monitor sync activity.
To view Azure File Sync performance counters on the server, open Performance Monitor (Perfmon.exe). You can find the counters under the AFS Bytes Transferred and AFS Sync Operations objects.
The following performance counters for Azure File Sync are available in Performance Monitor:
| Performance Object\Counter Name | Description |
|---|---|
| AFS Bytes Transferred\Downloaded Bytes/sec | Number of bytes downloaded per second. |
| AFS Bytes Transferred\Uploaded Bytes/sec | Number of bytes uploaded per second. |
| AFS Bytes Transferred\Total Bytes/sec | Total bytes per second (upload and download). |
| AFS Sync Operations\Downloaded Sync Files/sec | Number of files downloaded per second. |
| AFS Sync Operations\Uploaded Sync Files/sec | Number of files uploaded per second. |
| AFS Sync Operations\Total Sync File Operations/sec | Total number of files synced (upload and download). |
Collect data with Azure Monitor
This table describes how you can collect data to monitor your service, and what you can do with the data once collected:
| Data to collect | Description | How to collect and route the data | Where to view the data | Supported data |
|---|---|---|---|---|
| Metric data | Metrics are numerical values that describe an aspect of a system at a particular point in time. Metrics can be aggregated using algorithms, compared to other metrics, and analyzed for trends over time. | Collected automatically at regular intervals. | Metrics explorer | Azure File Sync metrics supported by Azure Monitor |
| Activity log data | The Azure Monitor activity log provides insight into subscription-level events. The activity log includes information like when a resource is modified or a virtual machine is started. | Collected automatically. | Activity log |
For the list of all of the metrics data supported by Azure Monitor, see Azure Monitor supported metrics.
Use Azure Monitor tools to analyze the data
These Azure Monitor tools are available in the Azure portal to help you analyze monitoring data:
Some Azure services have a built-in monitoring dashboard in the Azure portal. These dashboards are called insights, and you can find them in the Insights section of Azure Monitor in the Azure portal.
Metrics explorer allows you to view and analyze metrics for Azure resources. For more information, see Analyze metrics with Azure Monitor metrics explorer.
Log Analytics allows you to query and analyze log data using the Kusto query language (KQL). For more information, see Get started with log queries in Azure Monitor.
The Azure portal has a user interface for viewing and basic searches of the activity log. To do more in-depth analysis, route the data to Azure Monitor logs and run more complex queries in Log Analytics.
Application Insights monitors the availability, performance, and usage of your web applications, so you can identify and diagnose errors without waiting for a user to report them.
Application Insights includes connection points to various development tools and integrates with Visual Studio to support your DevOps processes. For more information, see Application monitoring for App Service.
Tools that allow more complex visualization include:
- Dashboards that let you combine different kinds of data into a single pane in the Azure portal.
- Workbooks, customizable reports that you can create in the Azure portal. Workbooks can include text, metrics, and log queries.
- Grafana, an open platform tool that excels in operational dashboards. You can use Grafana to create dashboards that include data from multiple sources other than Azure Monitor.
- Power BI, a business analytics service that provides interactive visualizations across various data sources. You can configure Power BI to automatically import log data from Azure Monitor to take advantage of these visualizations.
Export Azure Monitor data
You can export data out of Azure Monitor into other tools using:
Metrics: Use the REST API for metrics to extract metric data from the Azure Monitor metrics database. For more information, see Azure Monitor REST API reference.
Logs: Use the REST API or the associated client libraries.
To get started with the Azure Monitor REST API, see Azure monitoring REST API walkthrough.
Use Azure Monitor alerts to notify you of issues
Azure Monitor alerts allow you to identify and address issues in your system, and proactively notify you when specific conditions are found in your monitoring data before your customers notice them. You can alert on any metric or log data source in the Azure Monitor data platform. There are different types of Azure Monitor alerts depending on the services you're monitoring and the monitoring data you're collecting. See Choosing the right type of alert rule.
Recommended Azure Monitor alert rules for Azure File Sync
The following table lists common and recommended alert rules for Azure File Sync.
| Scenario | Metric to use for alert |
|---|---|
| Server endpoint health shows an error in the portal | Sync session result |
| Files are failing to sync to a server or cloud endpoint | Files not syncing |
| Registered server is failing to communicate with the Storage Sync Service | Server online status |
| Cloud tiering recall size exceeded 500 GiB in a day | Cloud tiering recall size |
For examples of common alerts for Azure resources, see Sample log alert queries.
Implementing alerts at scale
For some services, you can monitor at scale by applying the same metric alert rule to multiple resources of the same type that exist in the same Azure region. Azure Monitor Baseline Alerts (AMBA) provides a semi-automated method of implementing important platform metric alerts, dashboards, and guidelines at scale.
Alert Examples
This section provides some example alerts for Azure File Sync.
Note
If you create an alert and it's too noisy, adjust the threshold value and alert logic.
To create an alert if the server endpoint health shows an error in the portal:
- In the Azure portal, navigate to respective Storage Sync Service.
- Go to the Monitoring section and select Alerts.
- Select + New alert rule to create a new alert rule.
- Configure condition by clicking Select condition.
- Within Configure signal logic section, select Sync session result under signal name.
- Select the following dimension configuration:
- Dimension name: Server Endpoint Name
- Operator: =
- Dimension values: All current and future values
- Navigate to Alert Logic and complete the following:
- Threshold set to Static
- Operator: Less than
- Aggregation type: Maximum
- Threshold value: 1
- Evaluated based on: Aggregation granularity = 24 hours | Frequency of evaluation = Every hour
- Select Done.
- Select Select action group to add an action group (email, SMS, etc.) to the alert either by selecting an existing action group or creating a new action group.
- Fill in the Alert details like Alert rule name, Description, and Severity.
- Select Create alert rule.
To create an alert if files are failing to sync to a server or cloud endpoint:
- In the Azure portal, navigate to respective Storage Sync Service.
- Go to the Monitoring section and select Alerts.
- Select + New alert rule to create a new alert rule.
- Configure condition by selecting Select condition.
- Within Configure signal logic section, select Files not syncing under signal name.
- Select the following dimension configuration:
- Dimension name: Server Endpoint Name
- Operator: =
- Dimension values: All current and future values
- Navigate to Alert Logic and complete the following:
- Threshold set to Static
- Operator: Greater than
- Aggregation type: Average
- Threshold value: 100
- Evaluated based on: Aggregation granularity = 5 minutes | Frequency of evaluation = Every 5 minutes
- Select Done.
- Select Select action group to add an action group (email, SMS, etc.) to the alert either by selecting an existing action group or creating a new action group.
- Fill in the Alert details like Alert rule name, Description, and Severity.
- Select Create alert rule.
To create an alert if a registered server is failing to communicate with the Storage Sync Service:
- In the Azure portal, navigate to respective Storage Sync Service.
- Go to the Monitoring section and select Alerts.
- Select + New alert rule to create a new alert rule.
- Configure condition by selecting Select condition.
- Within Configure signal logic section, select Server online status under signal name.
- Select the following dimension configuration:
- Dimension name: Server name
- Operator: =
- Dimension values: All current and future values
- Navigate to Alert Logic and complete the following:
- Threshold set to Static
- Operator: Less than
- Aggregation type: Maximum
- Threshold value (in bytes): 1
- Evaluated based on: Aggregation granularity = 1 hour | Frequency of evaluation = Every 30 minutes
- The metrics are sent to Azure Monitor every 15 to 20 minutes. Don't set the Frequency of evaluation to less than 30 minutes, because doing so generates false alerts.
- Select Done.
- Select Select action group to add an action group (email, SMS, etc.) to the alert either by selecting an existing action group or creating a new action group.
- Fill in the Alert details like Alert rule name, Description, and Severity.
- Select Create alert rule.
To create an alert if the cloud tiering recall size exceeds 500 GiB in a day:
- In the Azure portal, navigate to respective Storage Sync Service.
- Go to the Monitoring section and select Alerts.
- Select + New alert rule to create a new alert rule.
- Configure condition by selecting Select condition.
- Within Configure signal logic section, select Cloud tiering recall size under signal name.
- Select the following dimension configuration:
- Dimension name: Server name
- Operator: =
- Dimension values: All current and future values
- Navigate to Alert Logic and complete the following:
- Threshold set to Static
- Operator: Greater than
- Aggregation type: Total
- Threshold value (in bytes): 67108864000
- Evaluated based on: Aggregation granularity = 24 hours | Frequency of evaluation = Every hour
- Select Done.
- Select Select action group to add an action group (email, SMS, etc.) to the alert either by selecting an existing action group or creating a new action group.
- Fill in the Alert details like Alert rule name, Description, and Severity.
- Select Create alert rule.