Note
Access to this page requires authorization. You can try signing in or changing directories.
Access to this page requires authorization. You can try changing directories.
This article describes how you can use the no code editor to easily create a Stream Analytics job, which continuously reads data from an Event Hubs instance (event hub), transforms the data, and then writes results to an Azure SQL database.
Prerequisites
Your Azure Event Hubs and Azure SQL Database resources must be publicly accessible and not be behind a firewall or secured in an Azure Virtual Network. The data in your Event Hubs must be serialized in either JSON, CSV, or Avro format.
If you want to try steps in this article, follow these steps.
Create an event hub if you don't have one already. Generate data in the event hub. On the Event Hubs Instance page, select Generate data (preview) on the left menu, select Stock data for Dataset, and then select Send to send some sample data to the event hub. This step is required if you want to test steps in this article.

Create an Azure SQL database. Here are a few important points to note while creating the database.
On the Basics page, select Create new for Server. Then, on the Create SQL Database server page, select Use SQL authentication, and specify admin user ID and password.
On the Networking page, follow these steps:
- Enable Public endpoint.
- Select Yes for Allow Azure services and resources to access this server.
- Select Yes for Add current client IP address.
On the Additional settings page, select None for Use existing data.
In the article, skip steps in the Query the database and Clean up resources sections.
If you want to test steps, create a table in the SQL database by using the Query editor (preview).
create table stocks (
    symbol varchar(4),
    price decimal
)

Use no-code editor to create a Stream Analytics job
In this section, you create an Azure Stream Analytics job using the no-code editor. The job transforms data streaming from an Event Hubs instance (event hub) and store result data in an Azure SQL database.
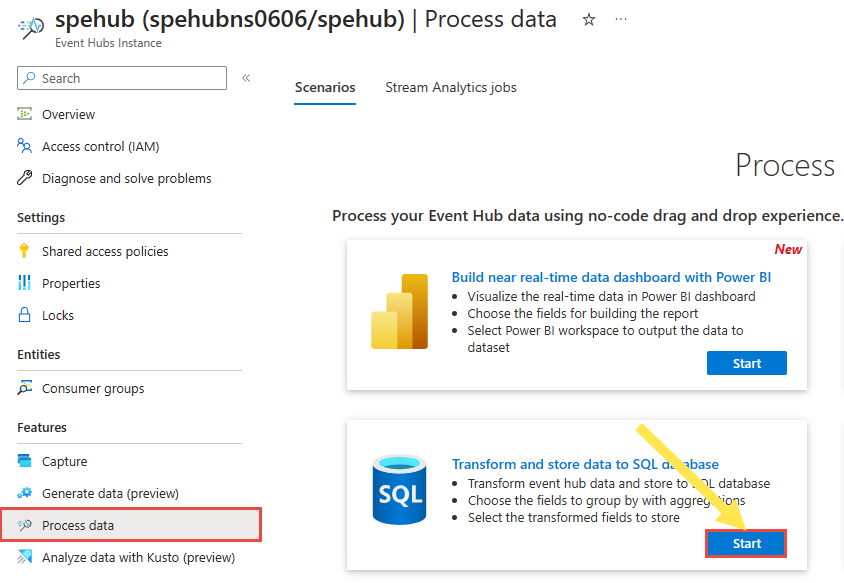
In the Azure portal, navigate to the Event Hubs Instance page for your event hub.
Select Features > Process Data on the left menu and then select Start on the Transform and store data to SQL database card.
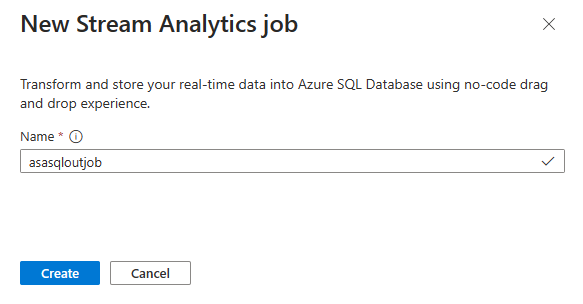
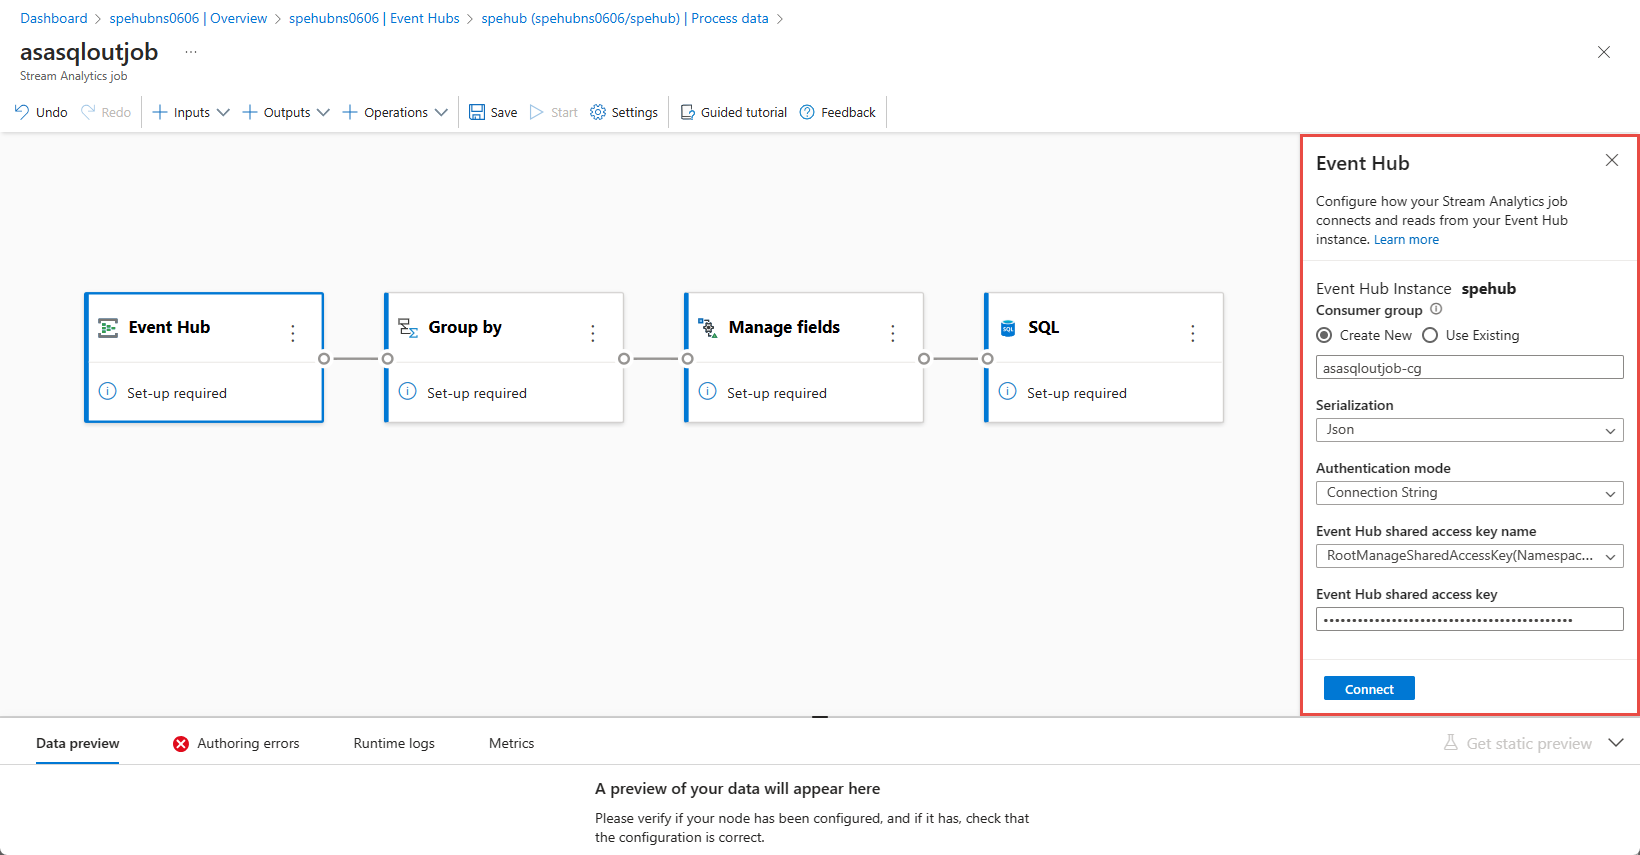
Enter a name for the Stream Analytics job, then select Create. You see the Stream Analytics job diagram with Event Hubs window to the right.
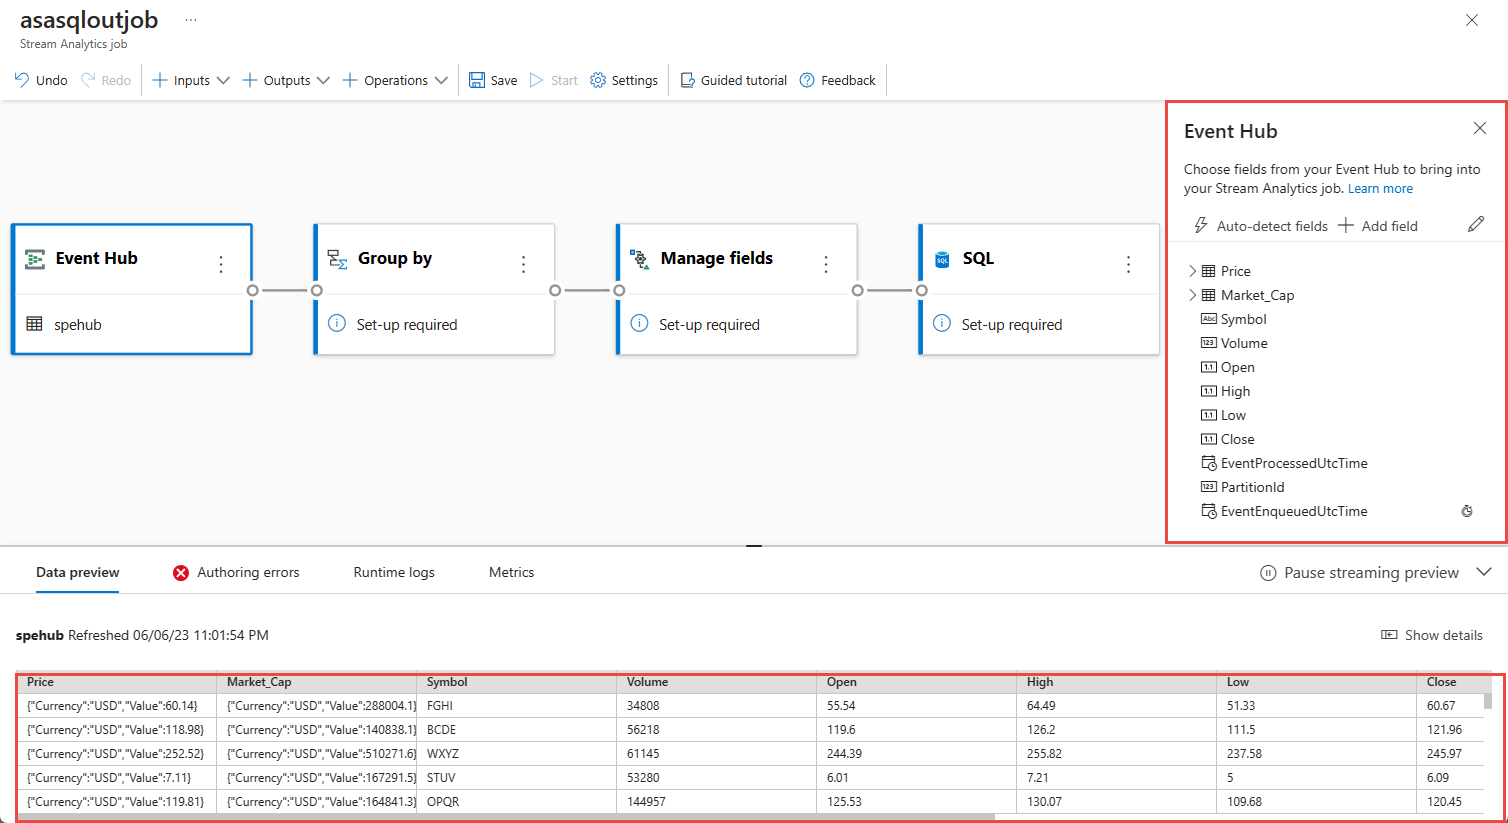
On the Event hub window, review Serialization and Authentication mode settings, and select Connect.
When the connection is established successfully and you have data in your Event Hubs instance, you see two things:
Fields that are present in the input data. You can choose Add field or select the three dot symbol next to a field to remove, rename, or change its type.
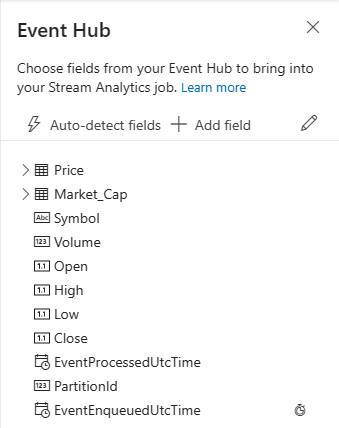
A live sample of incoming data in the Data preview table under the diagram view. It automatically refreshes periodically. You can select Pause streaming preview to see a static view of the sample input data.
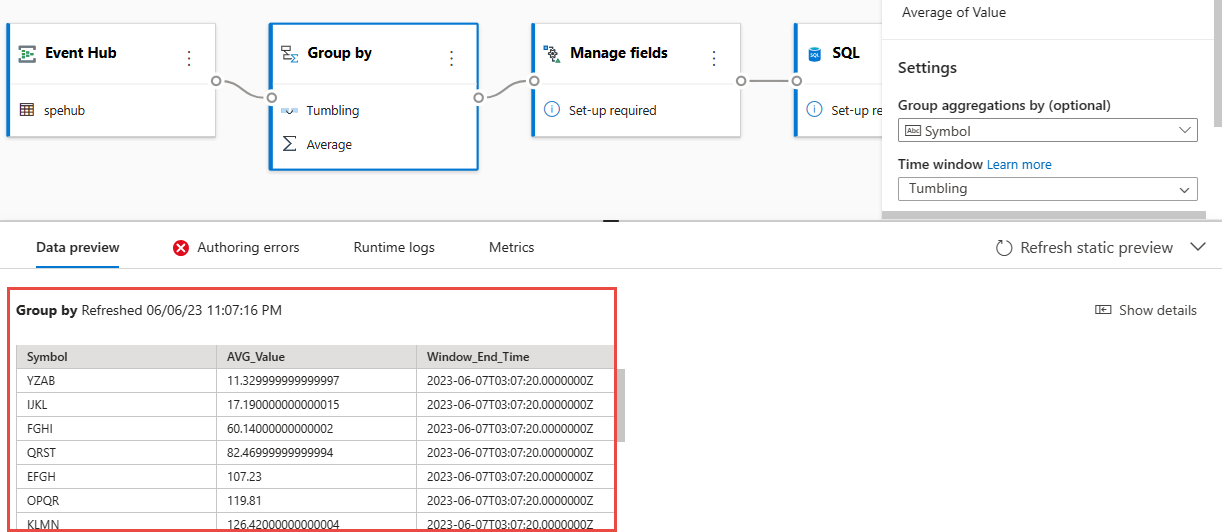
Select the Group by tile to aggregate the data. In the Group by configuration panel, You can specify the field that you want to Group By along with the Time window.
In the following example, average of price and symbol are used.
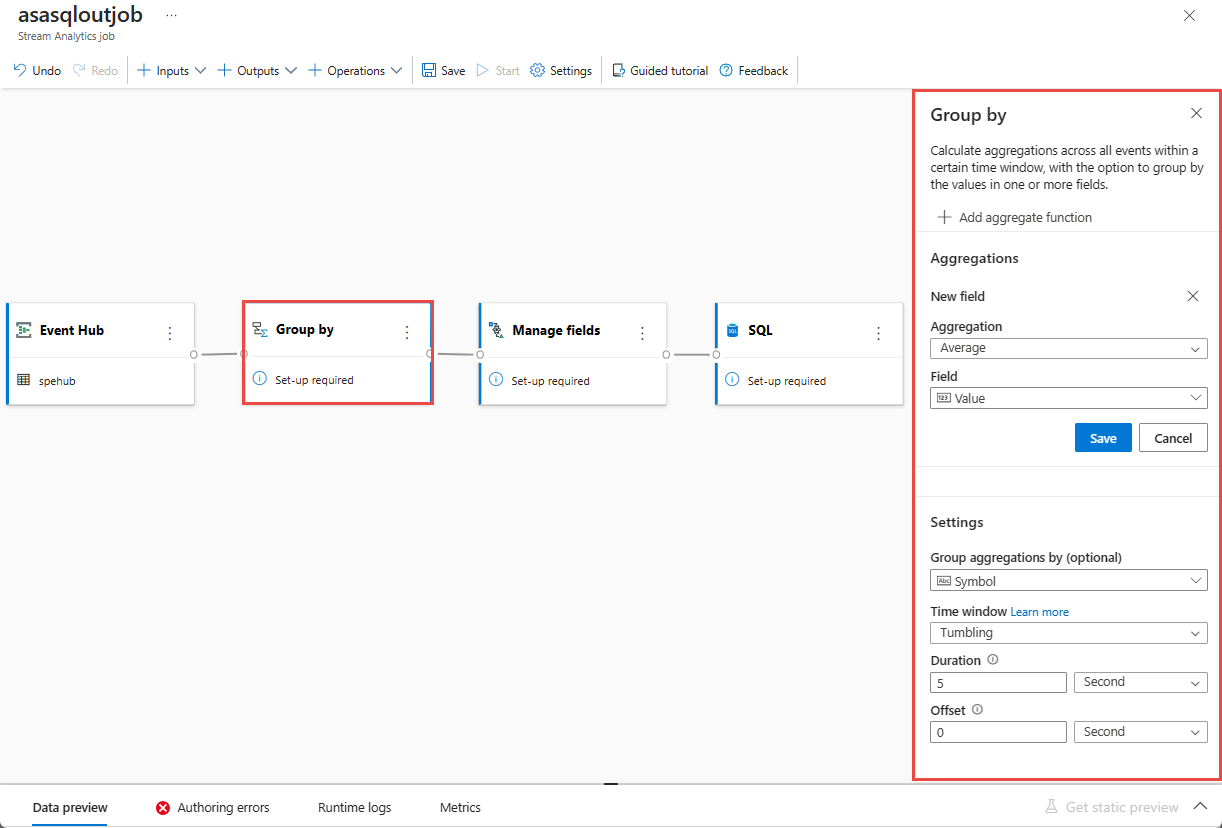
You can validate the results of the step in the Data preview section.
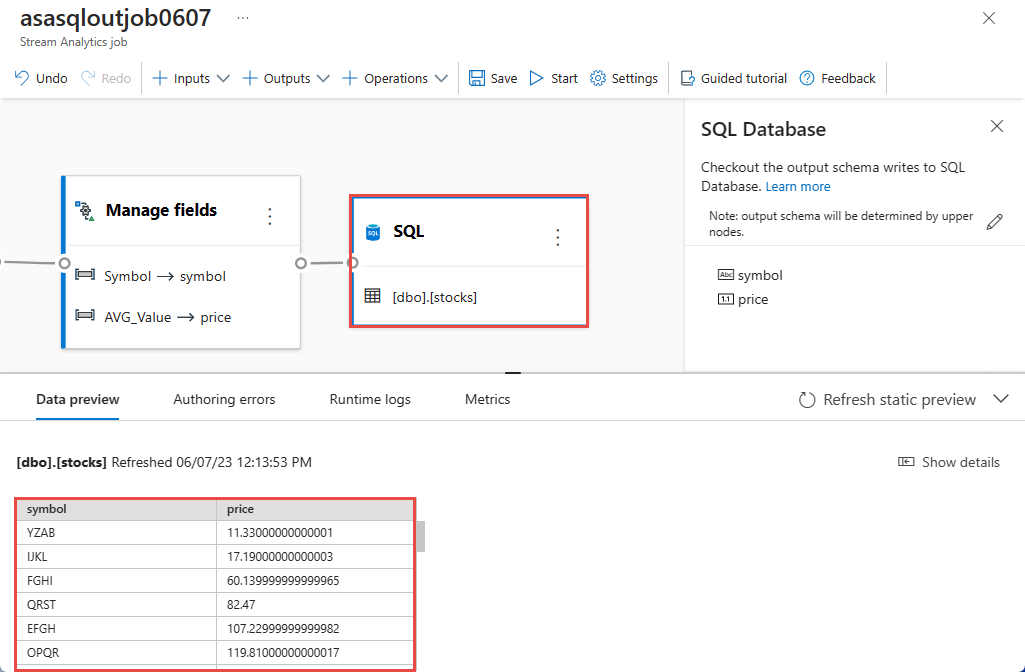
Select the Manage fields tile. In the Manage fields configuration panel, choose the fields you want to output by selecting Add field -> Imported Schema -> field.
If you want to add all the fields, select Add all fields. While adding a field, you can specify different name for the output. For example,
AVG_ValuetoValue. After you save the selections, you see data in the Data preview pane.In the following example, Symbol and AVG_Value are selected. Symbol is mapped to symbol, and AVG_Value is mapped to price.
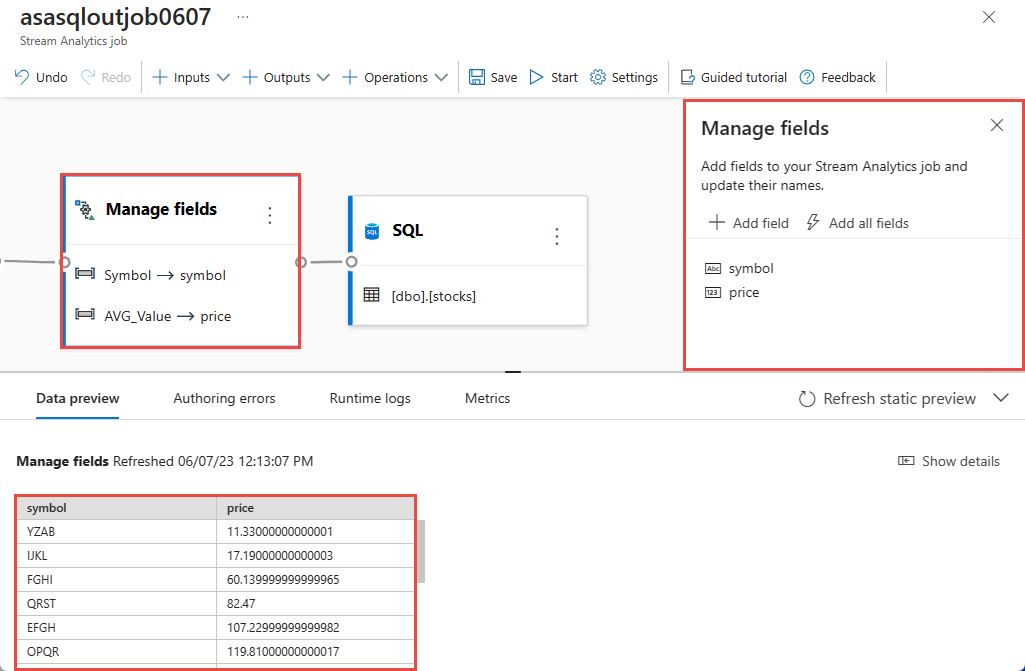
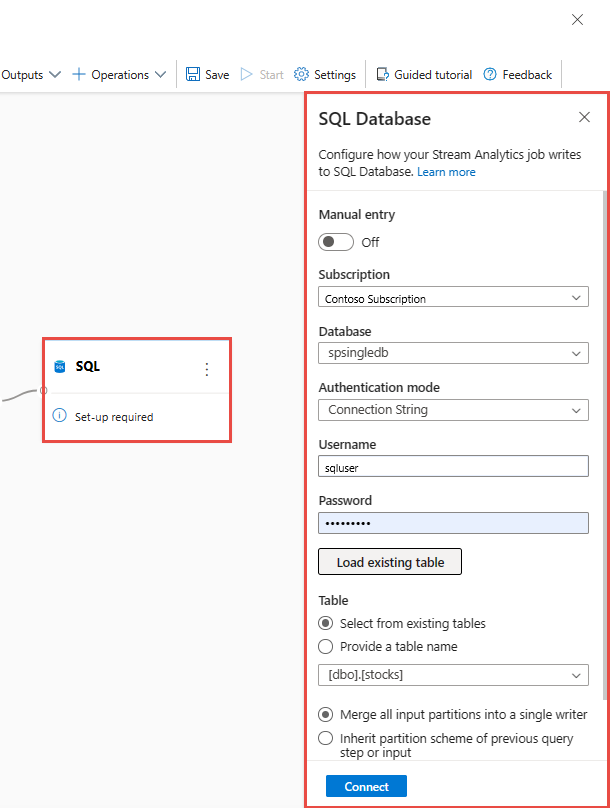
Select SQL tile. In the SQL Database configuration panel, fill in needed parameters and connect. Select Load existing table to have the table automatically picked. In the following example,
[dbo].[stocks]is picked. Then, select Connect.Note
The schema of the table you choose to write must exactly match the number of fields and their types that your data preview generates.
In the Data preview pane, you see the data preview that is ingested in SQL database.
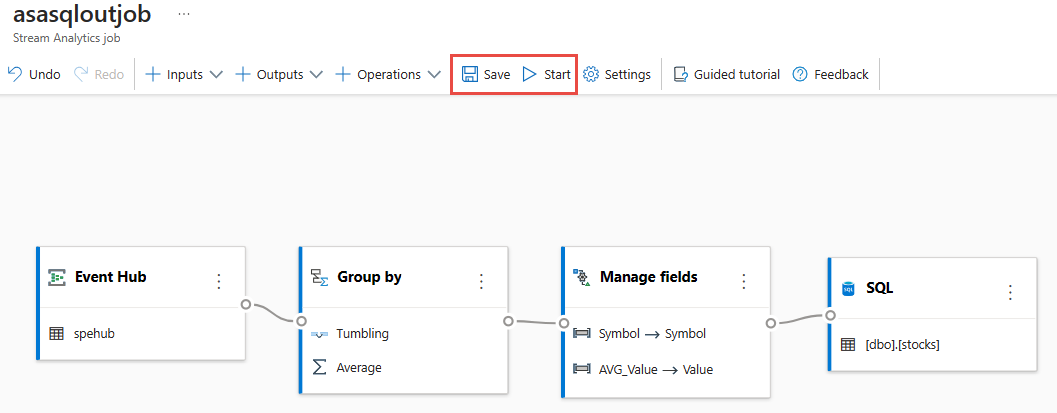
Select Save and then select Start the Stream Analytics job.
To start the job, specify:
The number of Streaming Units (SUs) the job runs with. SUs represents the amount of compute and memory allocated to the job. We recommended that you start with three and then adjust as needed.
Output data error handling – It allows you to specify the behavior you want when a job’s output to your destination fails due to data errors. By default, your job retries until the write operation succeeds. You can also choose to drop such output events.
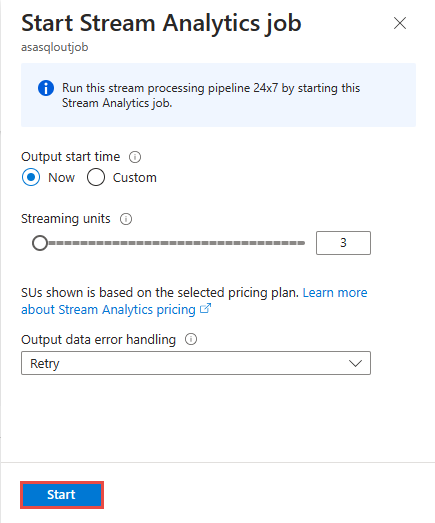
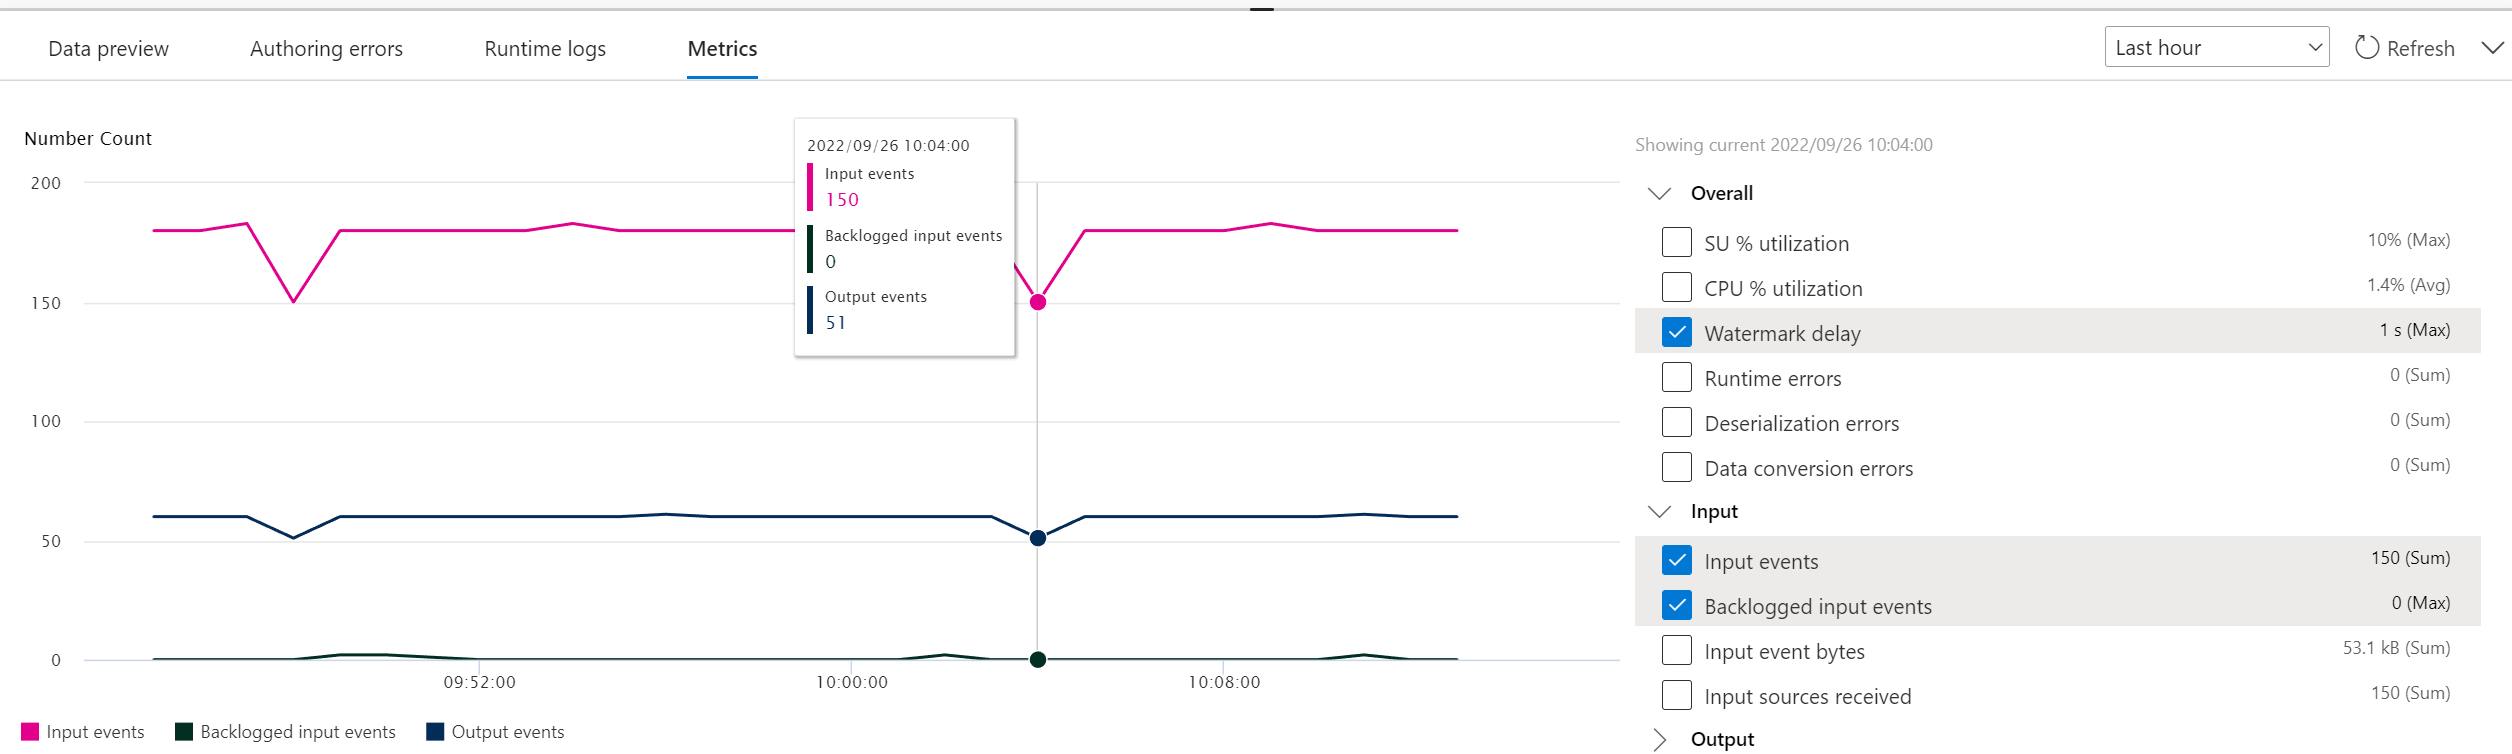
After you select Start, the job starts running within two minutes. You see the metrics panel in the bottom pane open. It takes sometime for this panel to updated. Select Refresh in the top-right corner of the panel to refresh the chart. Proceed to the next step in a separate tab or window of the web browser.
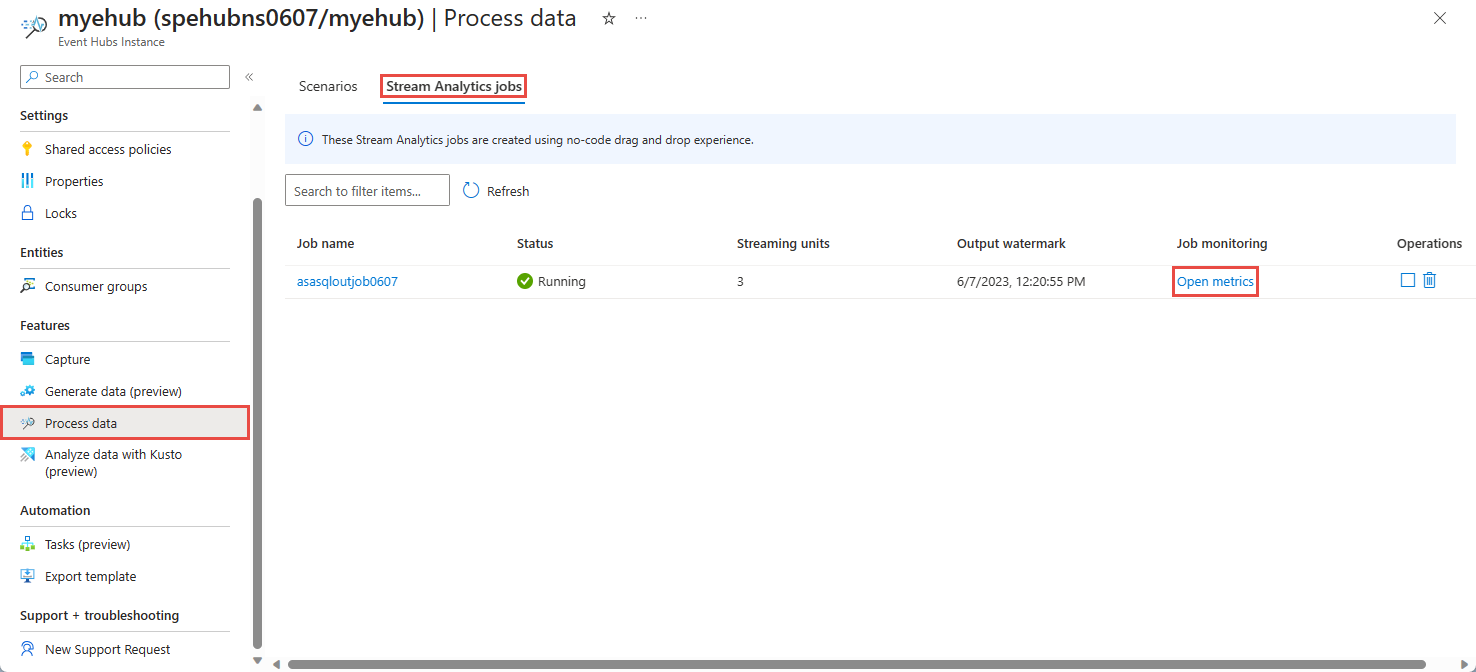
You can also see the job under the Process Data section on the Stream Analytics jobs tab. Select Open metrics to monitor it or stop and restart it, as needed.
Navigate to your event hub in the portal in a separate browser window or tab, and send sample stock data again (as you did in the prerequisites). On the Event Hubs Instance page, select Generate data (preview) on the left menu, select Stock data for Dataset, and then select Send to send some sample data to the event hub. It make take a few minutes to see the Metrics panel updated.
You should see records inserted in the Azure SQL database.


Considerations when using the Event Hubs Geo-replication feature
Azure Event Hubs recently launched the Geo-Replication feature in public preview. This feature is different from the Geo Disaster Recovery feature of Azure Event Hubs.
When the failover type is Forced and replication consistency is Asynchronous, Stream Analytics job doesn't guarantee exactly once output to an Azure Event Hubs output.
Azure Stream Analytics, as producer with an event hub an output, might observe watermark delay on the job during failover duration and during throttling by Event Hubs in case replication lag between primary and secondary reaches the maximum configured lag.
Azure Stream Analytics, as consumer with Event Hubs as Input, might observe watermark delay on the job during failover duration and might skip data or find duplicate data after failover is complete.
Due to these caveats, restart the Stream Analytics job with appropriate start time right after Event Hubs failover is complete. Also, since Event Hubs Geo-replication feature is in public preview, don't use this pattern for production Stream Analytics jobs at this point. The current Stream Analytics behavior will improve before the Event Hubs Geo-replication feature is generally available and can be used in Stream Analytics production jobs.
Next steps
Learn more about Azure Stream Analytics and how to monitor the job you've created.