Note
Access to this page requires authorization. You can try signing in or changing directories.
Access to this page requires authorization. You can try changing directories.
In this article, you learn how to create stream-processing logic to gather data from Internet of Things (IoT) devices. You use a real-world IoT use case to demonstrate how to build your solution quickly and economically.
Prerequisites
- Create a free Azure subscription.
- Download sample query and data files from GitHub.
Scenario
Contoso, a company in the industrial automation space, has automated its manufacturing process. The machinery in this plant has sensors that are capable of emitting streams of data in real time. In this scenario, a production floor manager wants to have real-time insights from the sensor data to look for patterns and take actions on them. You can use Stream Analytics Query Language (SAQL) over the sensor data to find interesting patterns from the incoming stream of data.
In this example, the data is generated from a Texas Instruments sensor tag device. The payload of the data is in JSON format as shown in the following sample snippet:
{
    "time": "2016-01-26T20:47:53.0000000",
    "dspl": "sensorE",
    "temp": 123,
    "hmdt": 34
}
In a real-world scenario, you could have hundreds of these sensors generating events as a stream. Ideally, a gateway device would run code to push these events to Azure Event Hubs or Azure IoT Hubs. Your Stream Analytics job would ingest these events from Event Hubs or IoT Hubs and run real-time analytics queries against the streams. Then, you could send the results to one of the supported outputs.
For ease of use, this getting started guide provides a sample data file, which was captured from real sensor tag devices. You can run queries on the sample data and see results. In subsequent tutorials, you learn how to connect your job to inputs and outputs and deploy them to the Azure service.
Create a Stream Analytics job
Navigate to the Azure portal.
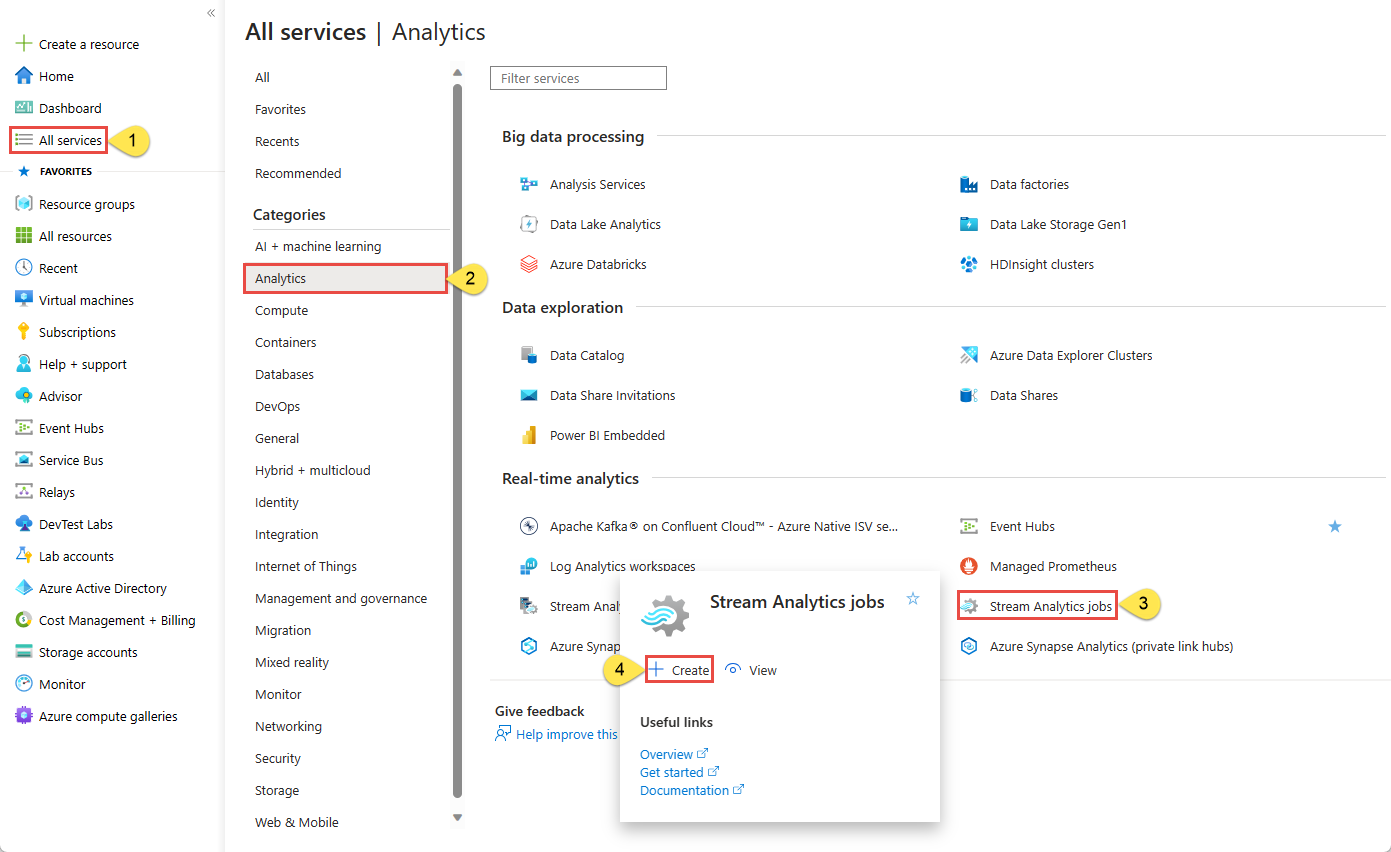
On the left navigation menu, select All services, select Analytics, hover the mouse over Stream Analytics jobs, and then select Create.
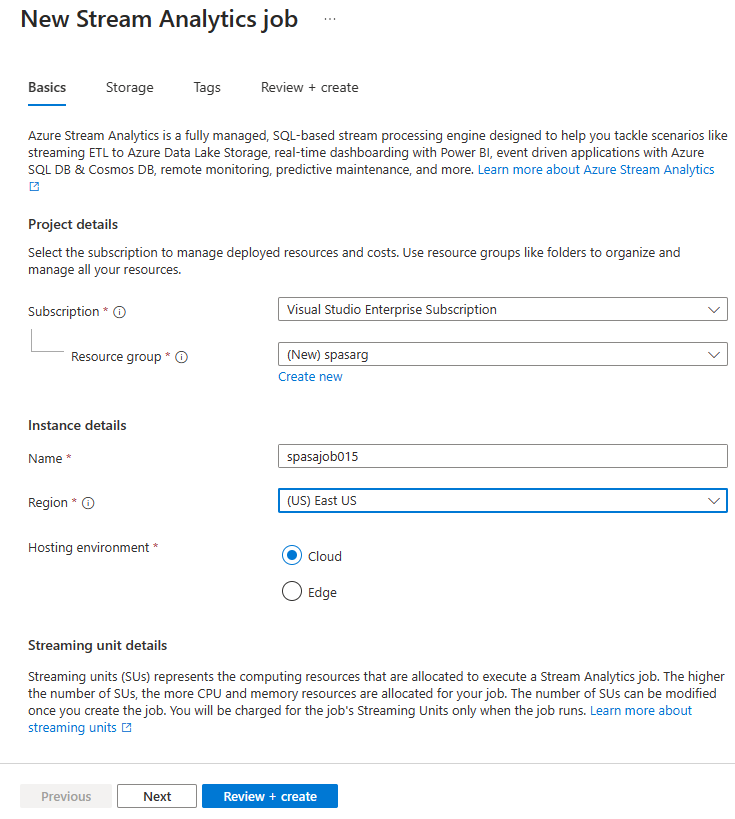
On the New Stream Analytics job page, follow these steps:
For Subscription, select your Azure subscription.
For Resource group, select an existing resource group or create a resource group.
For Name, enter a unique name for the Stream Analytics job.
Select the Region in which you want to deploy the Stream Analytics job. Use the same location for your resource group and all resources to increase the processing speed and reduce costs.
Select Review + create.
On the Review + create page, review settings, and select Create.
After the deployment succeeds, select Go to resource to navigate to the Stream Analytics job page for your Stream Analytics job.

Create an Azure Stream Analytics query
After your job is created, write a query. You can test queries against sample data without connecting an input or output to your job.
Download the HelloWorldASA-InputStream.json from GitHub.
On the Azure Stream Analytics job page in the Azure portal, select Query under Job topology from the left menu.
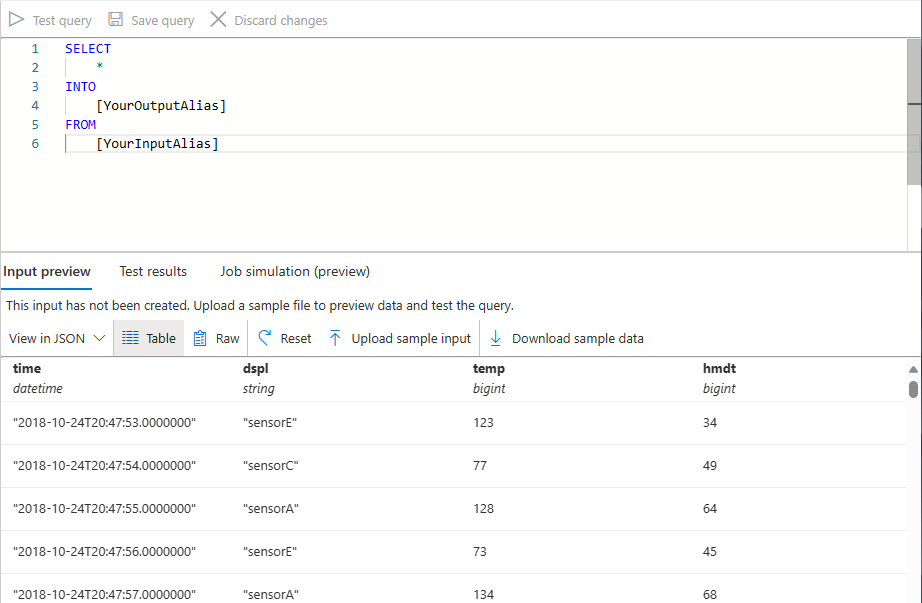
In the Query window, enter the following query.
SELECT
    *
INTO
    youroutputalias
FROM
    yourinputalias
In the bottom pane, select Upload sample input, select the
HelloWorldASA-InputStream.jsonfile you downloaded, and select OK.
Notice that a preview of the data is automatically populated in the Input preview table.

Query: Archive your raw data
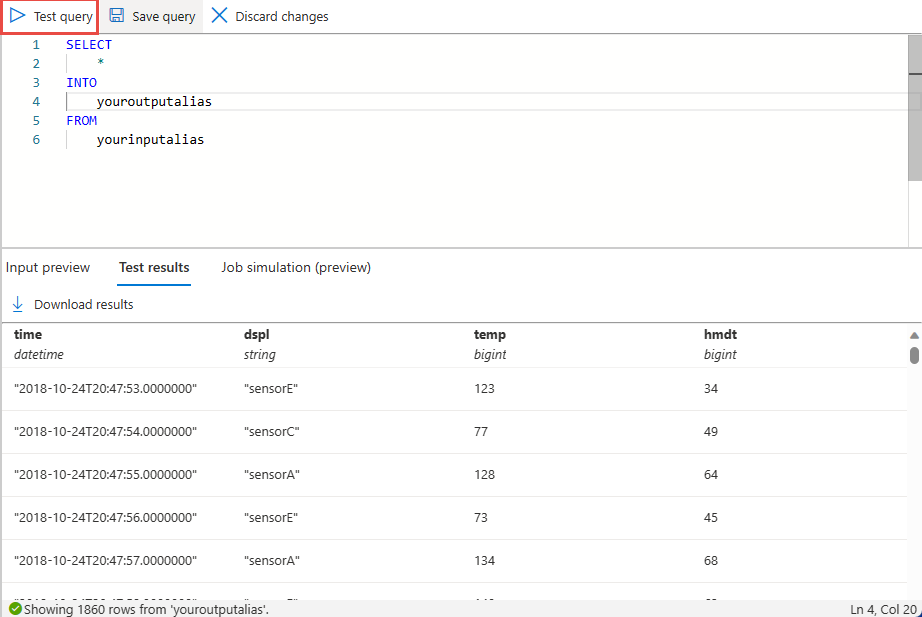
The simplest form of query is a pass-through query that archives all input data to its designated output. This query is the default query populated in a new Azure Stream Analytics job.
Select Test query on the toolbar.
View the results in the Test results tab in the bottom pane.
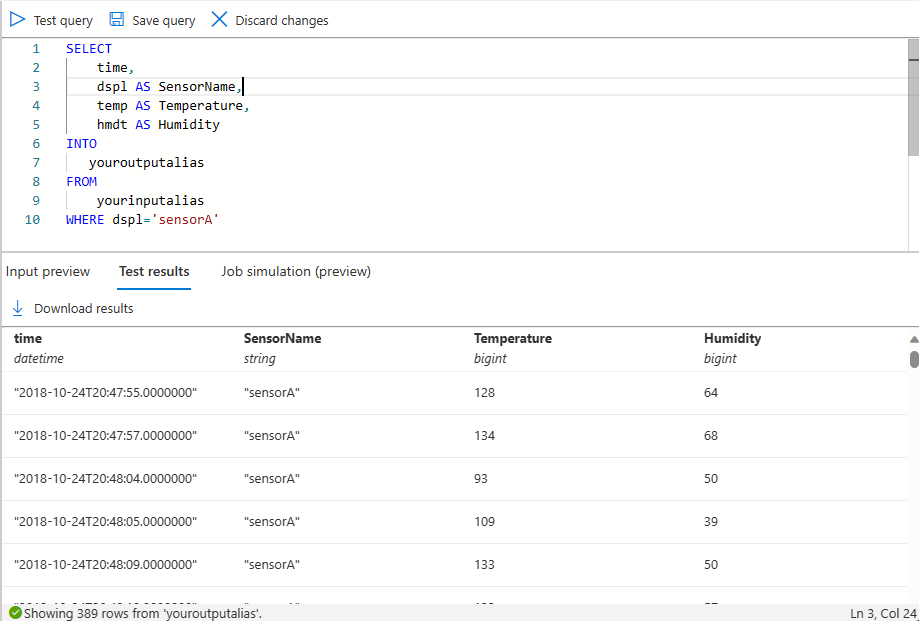
Query: Filter the data based on a condition
Let's update the query to filter the results based on a condition. For example, the following query shows events that come from sensorA."
Update the query with the following sample:
SELECT
    time,
    dspl AS SensorName,
    temp AS Temperature,
    hmdt AS Humidity
INTO
   youroutputalias
FROM
    yourinputalias
WHERE dspl='sensorA'
Select Test query to see the results of the query.
Query: Alert to trigger a business workflow
Let's make our query more detailed. For every type of sensor, we want to monitor average temperature per 30-second window and display results only if the average temperature is above 100 degrees.
Update the query to:
SELECT
    System.Timestamp AS OutputTime,
    dspl AS SensorName,
    Avg(temp) AS AvgTemperature
INTO
   youroutputalias
FROM
    yourinputalias TIMESTAMP BY time
GROUP BY TumblingWindow(second,30),dspl
HAVING Avg(temp)>100
Select Test query to see the results of the query.
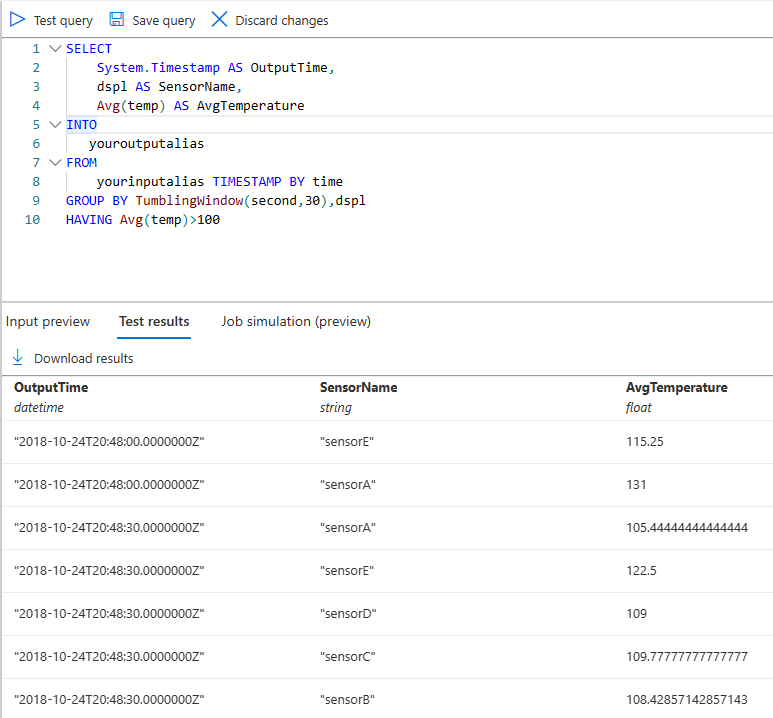
You should see results that contain only 245 rows and names of sensors where the average temperate is greater than 100. This query groups the stream of events by dspl, which is the sensor name, over a Tumbling Window of 30 seconds. Temporal queries must state how you want time to progress. By using the TIMESTAMP BY clause, you have specified the OUTPUTTIME column to associate times with all temporal calculations. For detailed information, read about Time Management and Windowing functions.
Query: Detect absence of events
How can we write a query to find a lack of input events? Let's find the last time that a sensor sent data and then didn't send events for the next 5 seconds.
Update the query to:
SELECT
    t1.time,
    t1.dspl AS SensorName
INTO
   youroutputalias
FROM
    yourinputalias t1 TIMESTAMP BY time
LEFT OUTER JOIN yourinputalias t2 TIMESTAMP BY time
ON
    t1.dspl=t2.dspl AND
    DATEDIFF(second,t1,t2) BETWEEN 1 and 5
WHERE t2.dspl IS NULL
Select Test query to see the results of the query.
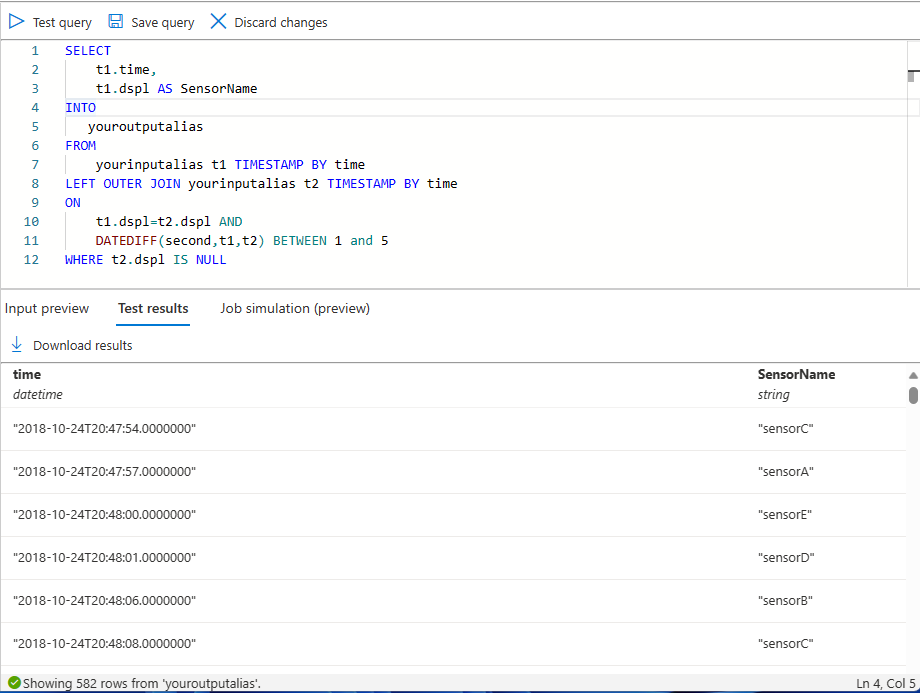
Here we use a LEFT OUTER join to the same data stream (self-join). For an INNER join, a result is returned only when a match is found. For a LEFT OUTER join, if an event from the left side of the join is unmatched, a row that has NULL for all the columns of the right side is returned. This technique is useful to find an absence of events. For more information, see JOIN.
Conclusion
The purpose of this article is to demonstrate how to write different Stream Analytics Query Language queries and see results in the browser. However, this article is just to get you started. Stream Analytics supports various inputs and outputs and can even use functions in Azure Machine Learning to make it a robust tool for analyzing data streams. For more information about how to write queries, read the article about common query patterns.