Visualize data from Azure Time Series Insights in Power BI
Note
The Time Series Insights service will be retired on 7 July 2024. Consider migrating existing environments to alternative solutions as soon as possible. For more information on the deprecation and migration, visit our documentation.
Azure Time Series Insights is a platform for storing, managing, querying, and visualizing time-series data in the cloud. Power BI is a business analytics tool with rich visualization capabilities that allows you to share insights and results across your organization. Both services can now be integrated allowing you to augment the powerful analytics of Azure Time Series Insights with the strong data visualization and easy sharing capabilities of Power BI.
You'll learn how to:
- Connect Azure Time Series Insights to Power BI using the native Azure Time Series Insights connector
- Create visuals with your time-series data in Power BI
- Publish the report to Power BI and share with the rest of your organization
Prerequisites
- Sign up for a free Azure subscription if you don't already have one.
- Download and install the latest version of Power BI Desktop
- Have or create an Azure Time Series Insights Gen2 environment
Please review environment access policies and make sure you have either direct access or guest access to the Azure Time Series Insights Gen2 environment.
Important
Download and install the latest version of Power BI Desktop. To follow along with the steps in this article, please make sure you have at least the December 2020 (2.88.321.0) version of Power BI Desktop installed.
Export data from Azure Time Series Insights into Power BI desktop
To get started:
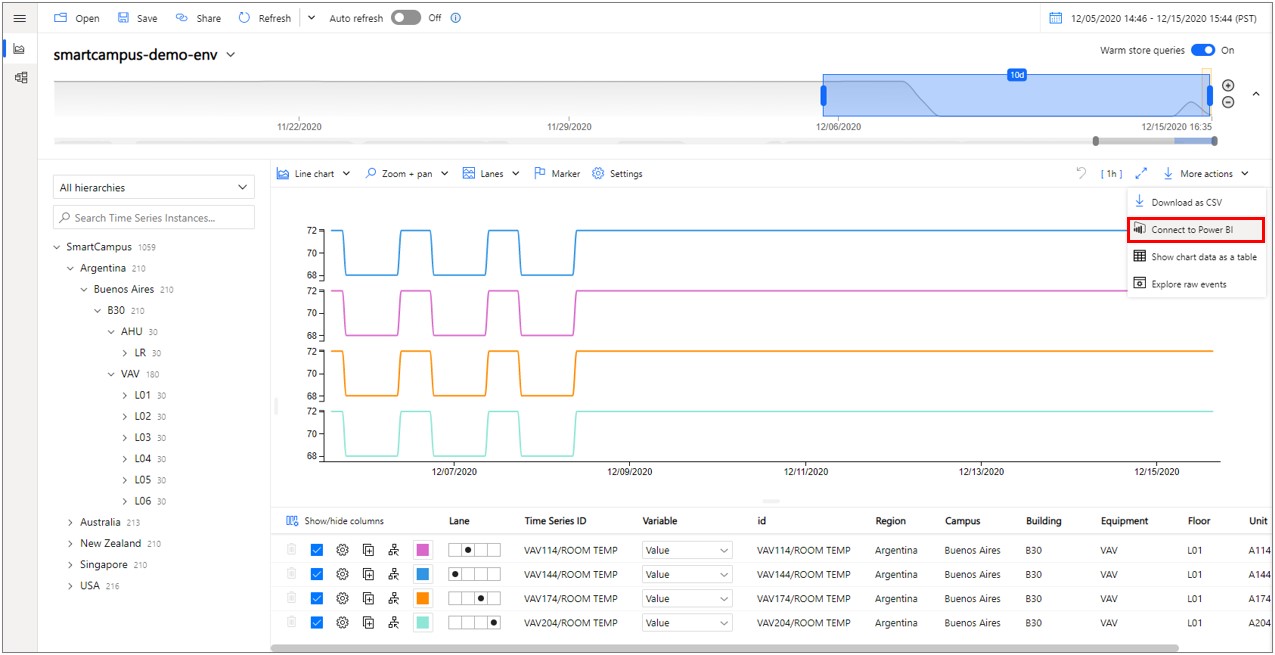
Open the Azure Time Series Insights Gen2 Explorer and curate your data. This is the data that will be exported into Power BI.
Once you have created a view you are satisfied with, navigate to the More actions dropdown menu and select Connect to Power BI.
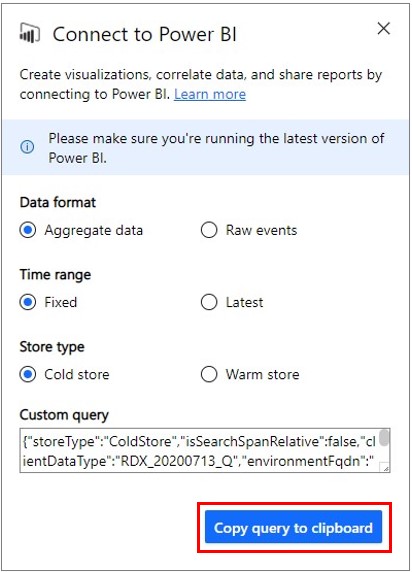
Set your parameters for export:
Data format: Choose whether you want to export Aggregate data or Raw events to Power BI.
Note
If you export raw events, you can aggregate that data later in Power BI. However, if you export aggregate data, you cannot revert to raw data in Power BI. There is a 250,000 event count limit for Raw Event level data.
Time Range: Choose whether you'd like to see a fixed time range or the latest data in Power BI. Choosing the fixed time range means the data in the search span you've charted will be exported to Power BI. Choosing the latest time range means that Power BI will grab the latest data for the search span you've chosen (e.g. If you chart any 1 hour of data and choose the "latest" setting, Power BI Connector will always make queries for the latest 1 hour of data.)
Store Type: Choose whether you'd like to run your selected query against Warm Store or Cold Store. If you've selected a range that spans both Cold and Warm stores, your query will be routed to Cold Store by default since Warm store will contain only the latest data. Manually changing the storeType parameter is allowed, but not recommended for best experience.
Tip
Azure Time Series Insights Explorer will automatically select the recommended parameters depending on the search span and view of data you've chosen to export.
Once you have configured your settings, select Copy query to clipboard.
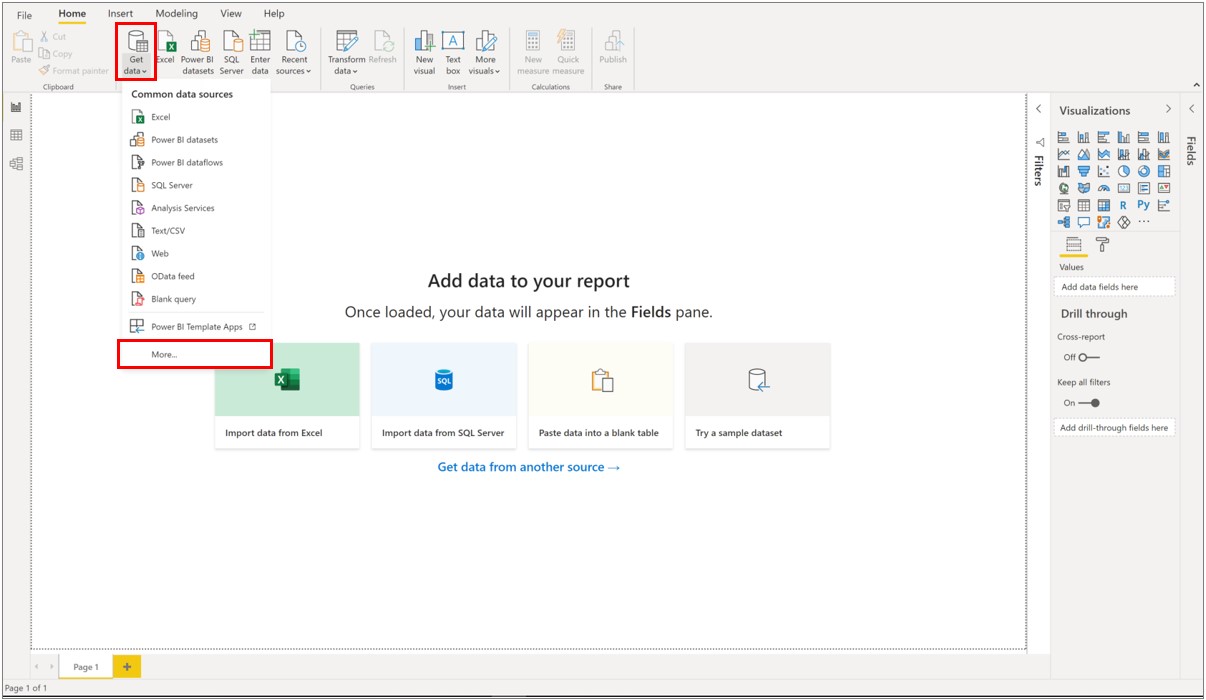
Launch Power BI Desktop.
In Power BI Desktop on the Home tab, select Get Data in the upper left corner, then More.
Search for Azure Time Series Insights, select Azure Time Series Insights (Beta), then Connect.
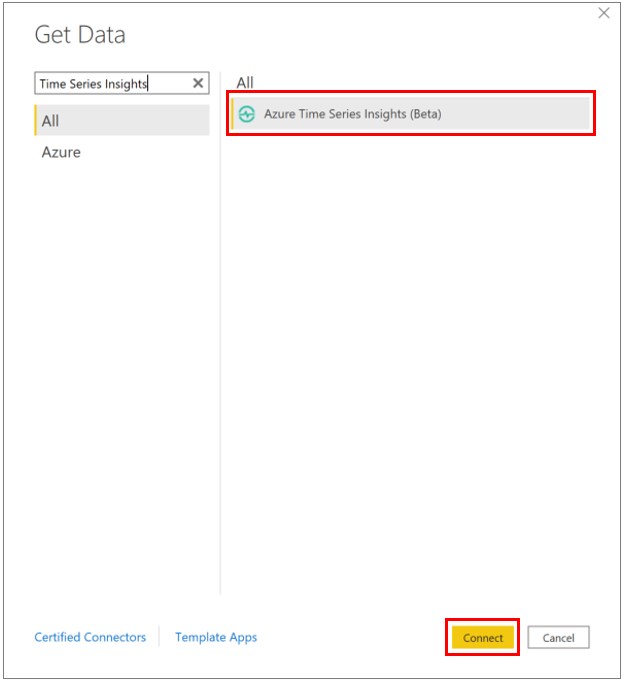
Alternatively, navigate to the Azure tab, select Azure Time Series Insights (Beta), then Connect.
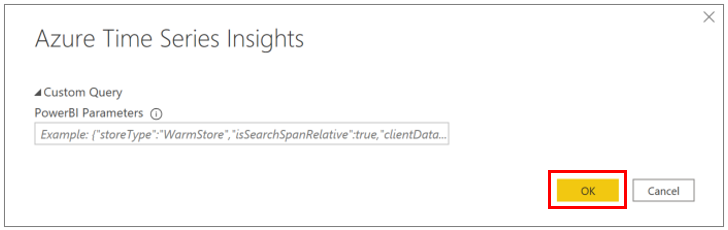
Paste the query you copied from Azure Time Series Insights Explorer into the Custom Query field, then press OK.
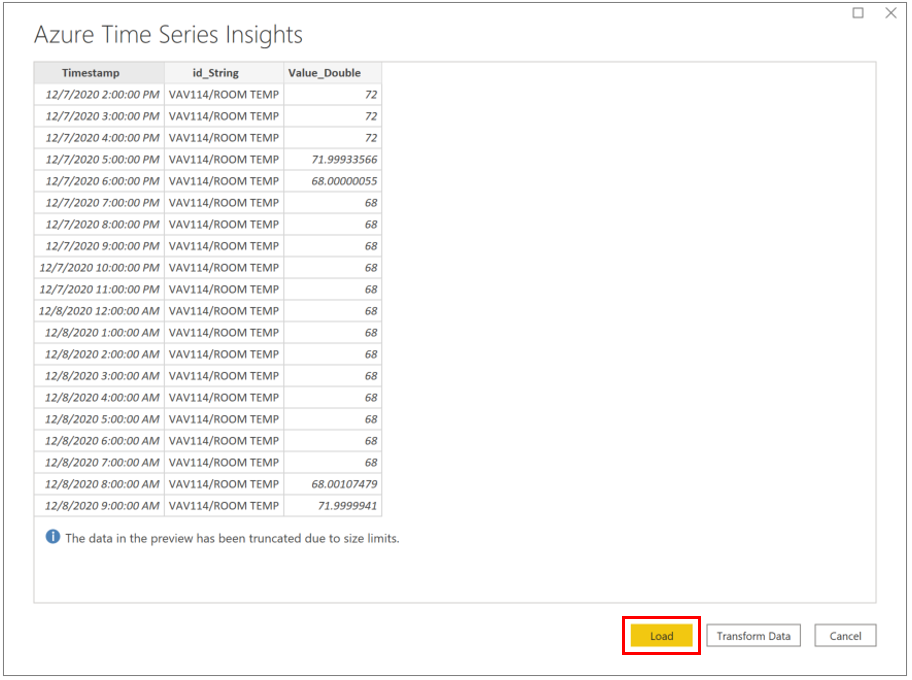
The data table will now load. Press Load to load into Power BI. If you wish to make any transformations to the data, you can do so now by clicking Transform Data. You can also transform your data after it's loaded.


Create a report with visuals
Now that you have imported the data into Power BI, it’s time to build a report with visuals.
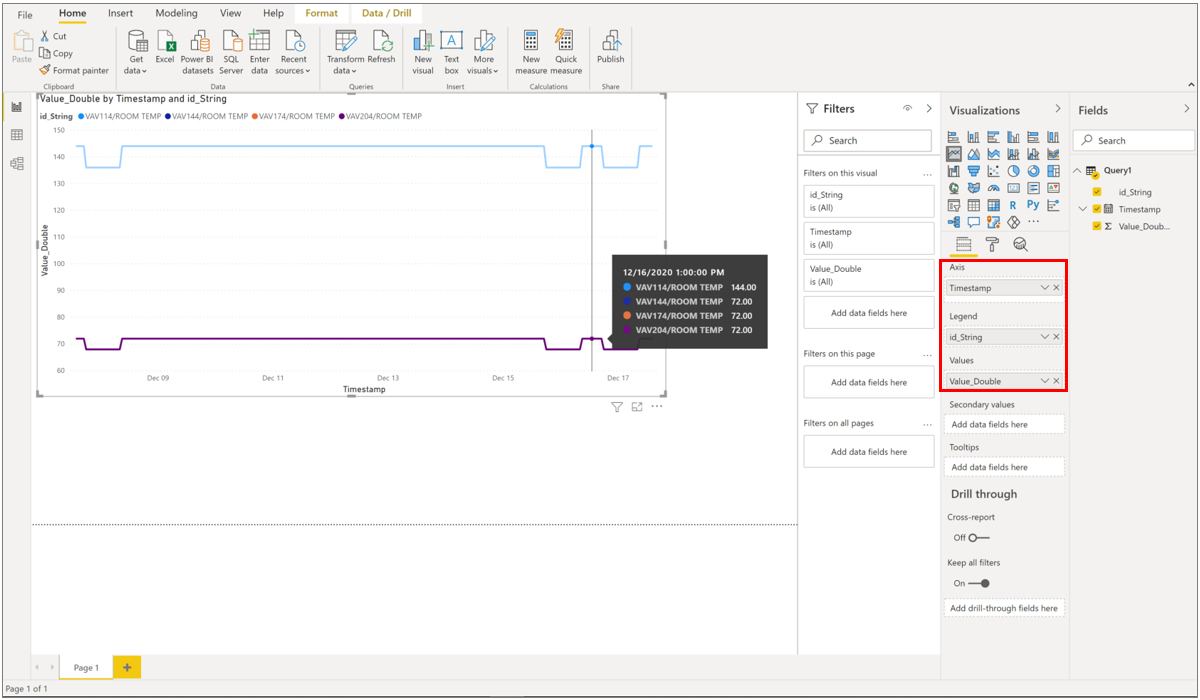
On the left side of the window, make sure you have selected the Report view.
In the Visualizations column, select your visual of choice. For example, select Line chart. This will add a blank line chart to your canvas.
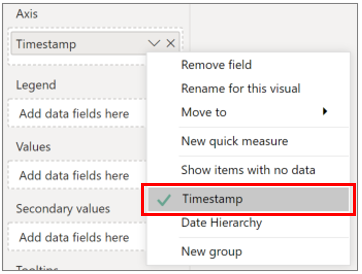
In the Fields list, select _Timestamp and drag it to the Axis field to display time along the X-axis. Make sure to switch to _Timestamp to as the value for the Axis (default is Date Hierarchy).
Again, in the Fields list, select the variable you wish to plot and drag it to the Values field to display values along the Y-axis. Select your Time Series ID value and drag it to the Legend field to create multiple lines in the chart, one per Time Series ID. This will render a view similar to what is provided by the Azure Time Series Insights Explorer!
To add another chart to your canvas, select anywhere on the canvas outside the line chart and repeat this process.
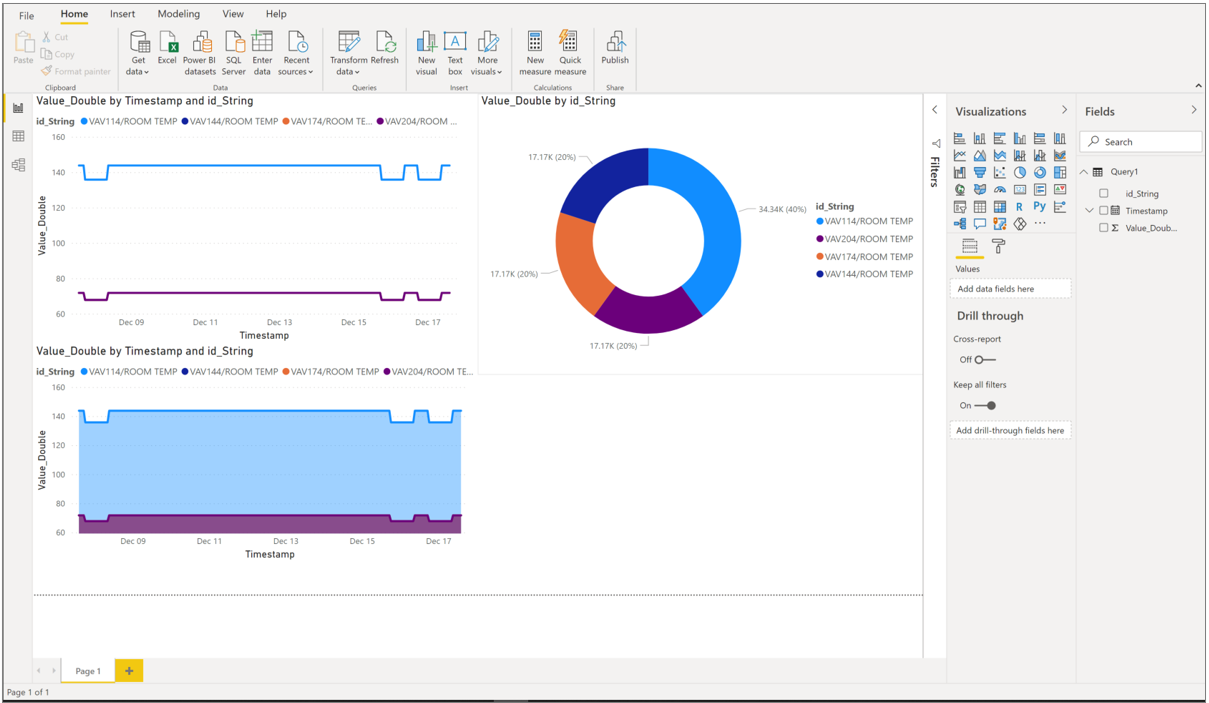


Once you have created your report, you can publish it to Power BI Reporting Services and share with others in your organization.
Advanced editing
If you have already loaded a dataset in Power BI but would like to modify the query (such as the date/time or Environment ID parameters), you can do this via Power BI’s Advanced Editor functionality. Refer to the Power BI documentation to learn more about how to make changes using the Power Query Editor.
Next Steps
Learn more about Power BI desktop.
Learn about querying data in Azure Time Series Insights Gen2.