Traffic Manager Traffic View
Traffic Manager provides you with DNS (Domain Name System) level routing. This service allows your end users to get directed to healthy endpoints based on the routing method of your choosing. Traffic View provides Traffic Manager with a view of your user bases (at a DNS resolver granularity level) and their traffic pattern. When you enable Traffic View, this information is processed to provide you with actionable insights.
By using Traffic View, you can:
- understand where your user bases are located (up to a local DNS resolver level granularity).
- view the volume of traffic (observed as DNS queries handled by Azure Traffic Manager) originating from these regions.
- get insights into what is the representative latency experienced by these users.
- deep dive into the specific traffic patterns from each of these user bases to Azure regions where you have endpoints.
For example, you can use Traffic View to understand which regions have a large amount of traffic but suffer from higher latencies. Then you use this information to plan your footprint expansion to new Azure regions. That way your users will have a lower latency experience.
How Traffic View works
Traffic View works by look at the incoming queries received over the last seven days for a profile. From the incoming queries information, Traffic View extracts the subnet address for the DNS resolver used to represent the location of the users. This information gets grouped together at a DNS resolver level to create user-base regions. Traffic Manager maintains the geographic information of IP addresses. Traffic Manager then looks at the Azure regions to which the query gets routed and constructs a traffic flow map for users from those regions.
In the next step, Traffic Manager correlates the user base region to Azure region mapping with the network intelligence latency tables. This table is maintained for different end-user networks to understand the average latency experienced by users from those regions when connecting to Azure regions. All these calculations are then combined at a per local DNS resolver IP level before it's presented to you. You can consume the information in various ways.
The frequency of Traffic view data update depends on multiple internal service variables. However, the data is updated once every 48 hours.
Note
The latency described in Traffic View is a representative latency between the end user and the Azure regions to which they had connected to, and is not the DNS lookup latency. Traffic View makes a best effort estimate of the latency between the local DNS resolver and the Azure region the query was routed to, if there is insufficient data available then the latency returned will be null.
Visual overview
When you navigate to the Traffic View section in your Traffic Manager page, you see a geographical map with an overlay of Traffic View insights. The map provides information about the user base and endpoints for your Traffic Manager profile.
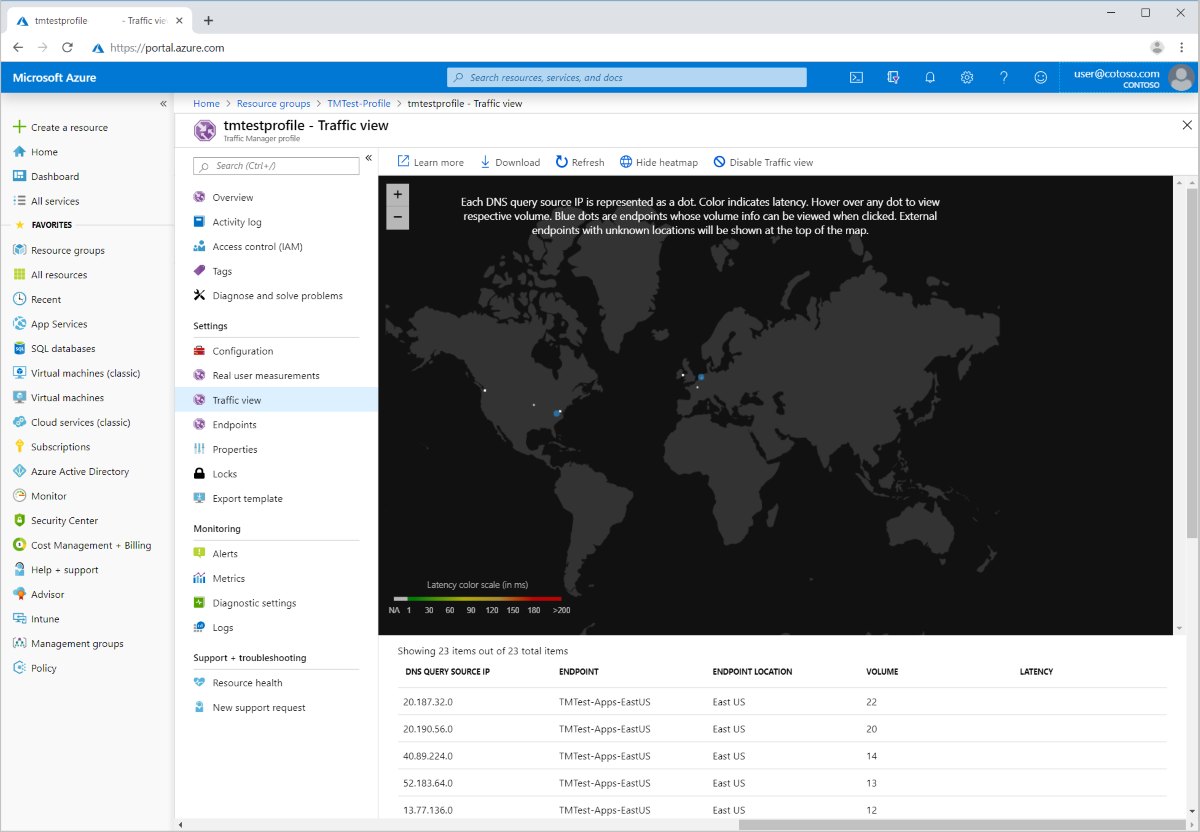
User base information
For those local DNS resolvers for which location information is available, they're shown in the map. The color of the DNS resolver denotes the average latency experienced by end users who used that DNS resolver for their Traffic Manager queries.
If you hover over a DNS resolver location in the map, it shows:
- the subnet of the DNS resolver (labeled as: DNS query source IP)
- the volume of DNS query traffic seen by Traffic Manager from it
- the endpoints to which traffic from the DNS resolver was routed, as a line between the endpoint and the DNS resolver
- the average latency from that location to the endpoint, represented as the color of the line connecting them
Endpoint information
The Azure regions in which the endpoints are located are shown as blue dots in the map. If your endpoint is external and doesn’t have an Azure region map to it, then they're shown at the top of the map. Select any endpoint to see the different locations (based on the DNS resolver used) from where traffic was directed to that endpoint. The connections are shown as a line between the endpoint and the DNS resolver location. They're colored according to the representative latency between that pair. You can see the name of the endpoint and the Azure region in which it runs. The total volume of requests that get directed to it by this Traffic Manager profile are also displayed.
Tabular listing and raw data download
You can view the Traffic View data in a tabular format in Azure portal. There's an entry for each DNS resolver IP / endpoint pair that shows:
- The subnet of the DNS resolver (labeled as: DNS query source IP)
- The name
- The geographical location of the Azure region in which the endpoint is located (if available)
- The volume of requests associated with that DNS resolver to that endpoint
- The representative latency associated with end users using that DNS (where available)
You can also download the Traffic View data as a CSV file that can be used as a part of an analytics workflow of your choice.
Billing
When you use Traffic View, you're billed based on the number of data points used to create the insights presented. Currently, the only data point type used is the queries received against your Traffic Manager profile. For more details on the pricing, visit the Traffic Manager pricing page.
FAQs
How is Traffic View different from the Traffic Manager metrics available through Azure monitor?
Do I need to enable Traffic View for each profile in my subscription?
Next steps
- Learn how Traffic Manager works
- Learn more about the traffic-routing methods supported by Traffic Manager
- Learn how to create a Traffic Manager profile
Feedback
Coming soon: Throughout 2024 we will be phasing out GitHub Issues as the feedback mechanism for content and replacing it with a new feedback system. For more information see: https://aka.ms/ContentUserFeedback.
Submit and view feedback for