What is Azure NAT Gateway metrics and alerts?
This article provides an overview of all NAT gateway metrics and diagnostic capabilities. This article provides general guidance on how to use metrics and alerts to monitor, manage, and troubleshoot your NAT gateway resource.
Azure NAT Gateway provides the following diagnostic capabilities:
Multi-dimensional metrics and alerts through Azure Monitor. You can use these metrics to monitor and manage your NAT gateway and to assist you in troubleshooting issues.
Network Insights: Azure Monitor Insights provides you with visual tools to view, monitor, and assist you in diagnosing issues with your NAT gateway resource. Insights provide you with a topological map of your Azure setup and metrics dashboards.

Figure: Azure NAT Gateway for outbound to Internet
Metrics overview
NAT gateway provides the following multi-dimensional metrics in Azure Monitor:
| Metric | Description | Recommended aggregation | Dimensions |
|---|---|---|---|
| Bytes | Bytes processed inbound and outbound | Sum | Direction (In; Out), Protocol (6 TCP; 17 UDP) |
| Packets | Packets processed inbound and outbound | Sum | Direction (In; Out), Protocol (6 TCP; 17 UDP) |
| Dropped Packets | Packets dropped by the NAT gateway | Sum | / |
| SNAT Connection Count | Number of new SNAT connections over a given interval of time | Sum | Connection State (Attempted, Failed), Protocol (6 TCP; 17 UDP) |
| Total SNAT Connection Count | Total number of active SNAT connections | Sum | Protocol (6 TCP; 17 UDP) |
| Datapath Availability | Availability of the data path of the NAT gateway. Used to determine whether the NAT gateway endpoints are available for outbound traffic flow. | Avg | Availability (0, 100) |
Note
Count aggregation is not recommended for any of the NAT gateway metrics. Count aggregation adds up the number of metric values and not the metric values themselves. Use Sum aggregation instead to get the best representation of data values for connection count, bytes, and packets metrics.
Use average for best represented health data for the datapath availability metric.
For information about aggregation types, see aggregation types.
Where to find my NAT gateway metrics
NAT gateway metrics can be found in the following locations in the Azure portal.
Metrics page under Monitoring from a NAT gateway's resource page.
Insights page under Monitoring from a NAT gateway's resource page.

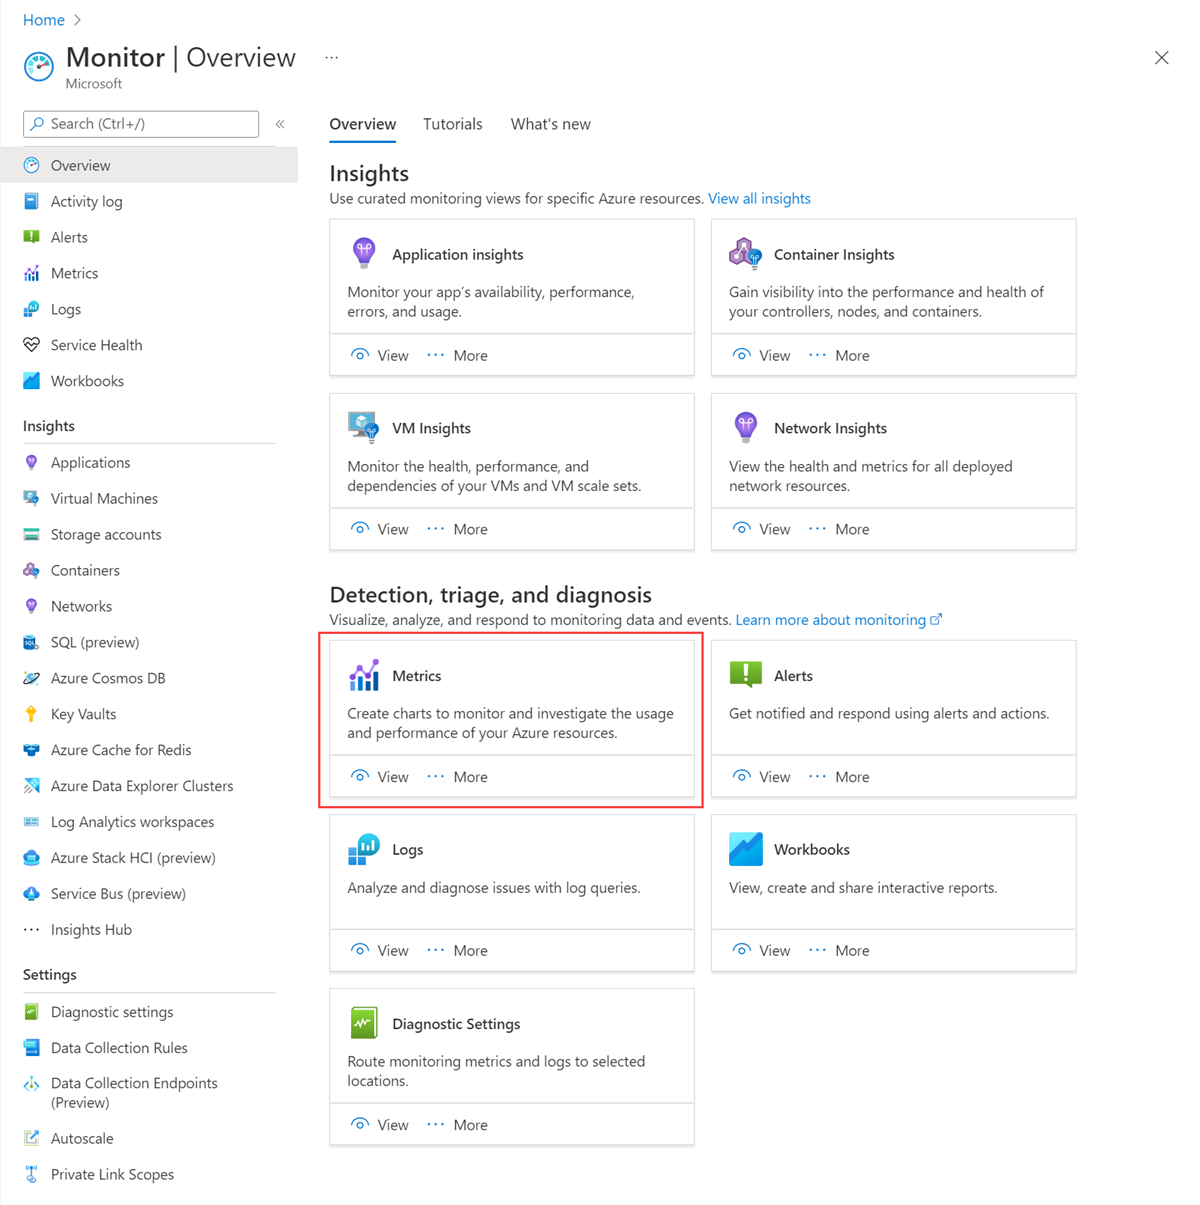
Azure Monitor page under Metrics.
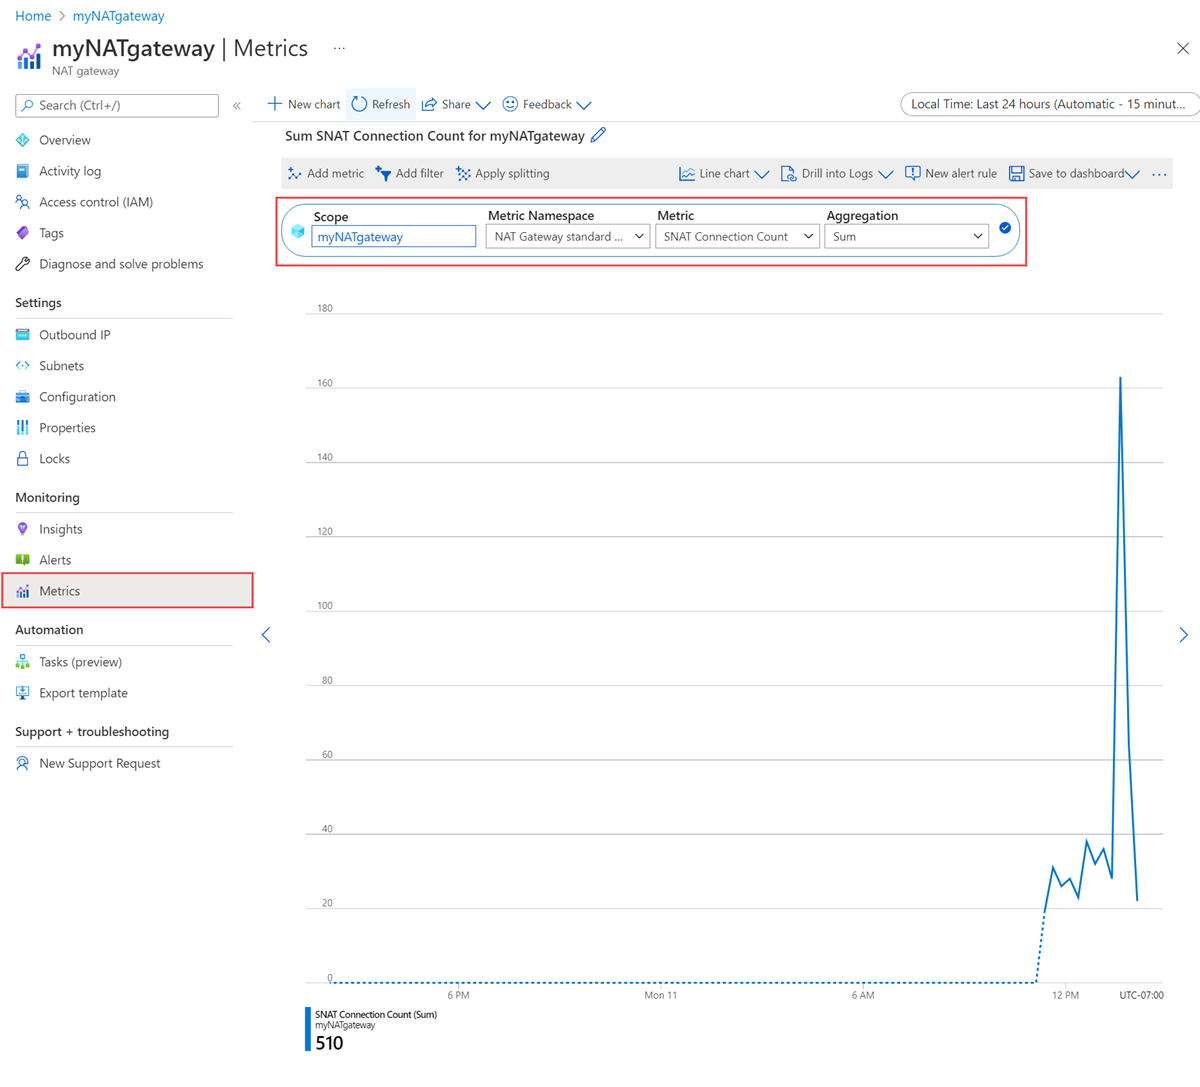
To view any one of your metrics for a given NAT gateway resource:
Select the NAT gateway resource you would like to monitor.
In the Metric drop-down menu, select one of the provided metrics.
In the Aggregation drop-down menu, select the recommended aggregation listed in the metrics overview table.
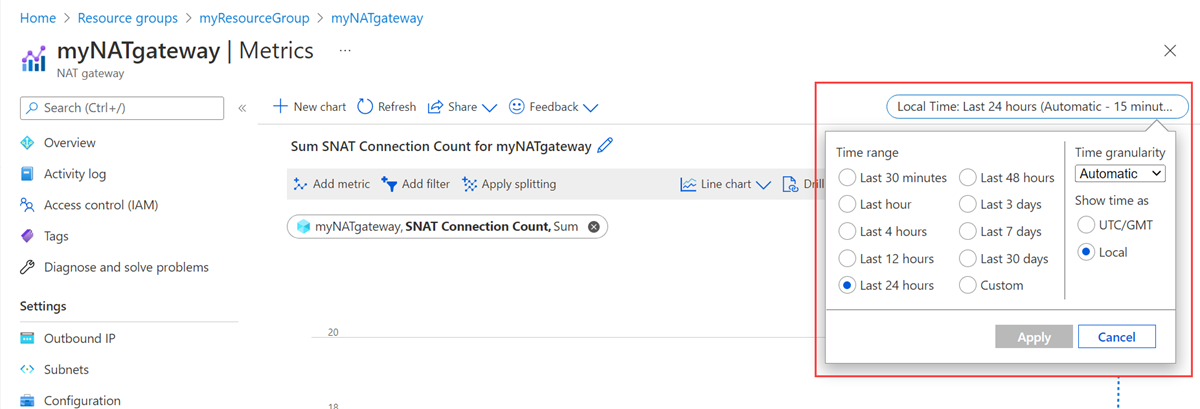
To adjust the time frame over which the chosen metric is presented on the metrics graph or to adjust how frequently the chosen metric is measured, select the Time window in the top right corner of the metrics page and make your adjustments.
How to use NAT gateway metrics
The following sections detail how to use each NAT gateway metric to monitor, manage, and troubleshoot your NAT gateway resource.
Bytes
The Bytes metric shows you the amount of data going outbound through NAT gateway and returning inbound in response to an outbound connection.
Use this metric to:
- View the amount of data being processed through NAT gateway to connect outbound or return inbound.
To view the amount of data passing through NAT gateway:
Select the NAT gateway resource you would like to monitor.
In the Metric drop-down menu, select the Bytes metric.
In the Aggregation drop-down menu, select Sum.
Select to Add filter.
In the Property drop-down menu, select Direction (Out | In).
In the Values drop-down menu, select Out, In, or both.
To see data processed inbound or outbound as their own individual lines in the metric graph, select Apply splitting.
In the Values drop-down menu, select Direction (Out | In).
Packets
The packets metric shows you the number of data packets passing through NAT gateway.
Use this metric to:
Verify that traffic is passing outbound or returning inbound through NAT gateway.
View the amount of traffic going outbound through NAT gateway or returning inbound.
To view the number of packets sent in one or both directions through NAT gateway, follow the same steps in the Bytes section.
Dropped packets
The dropped packets metric shows you the number of data packets dropped by NAT gateway when traffic goes outbound or returns inbound in response to an outbound connection.
Use this metric to:
Check if periods of dropped packets coincide with periods of failed SNAT connections with the SNAT Connection Count metric.
Help determine if you're experiencing a pattern of failed outbound connections or SNAT port exhaustion.
Possible reasons for dropped packets:
- Outbound connectivity failure can cause packets to drop. Connectivity failure can happen for various reasons. See the NAT gateway connectivity troubleshooting guide to help you further diagnose.
SNAT connection count
The SNAT connection count metric shows you the number of new SNAT connections within a specified time frame. This metric can be filtered by Attempted and Failed connection states. A failed connection volume greater than zero can indicate SNAT port exhaustion.
Use this metric to:
Evaluate the health of your outbound connections.
Help diagnose if your NAT gateway is experiencing SNAT port exhaustion.
Determine if you're experiencing a pattern of failed outbound connections.
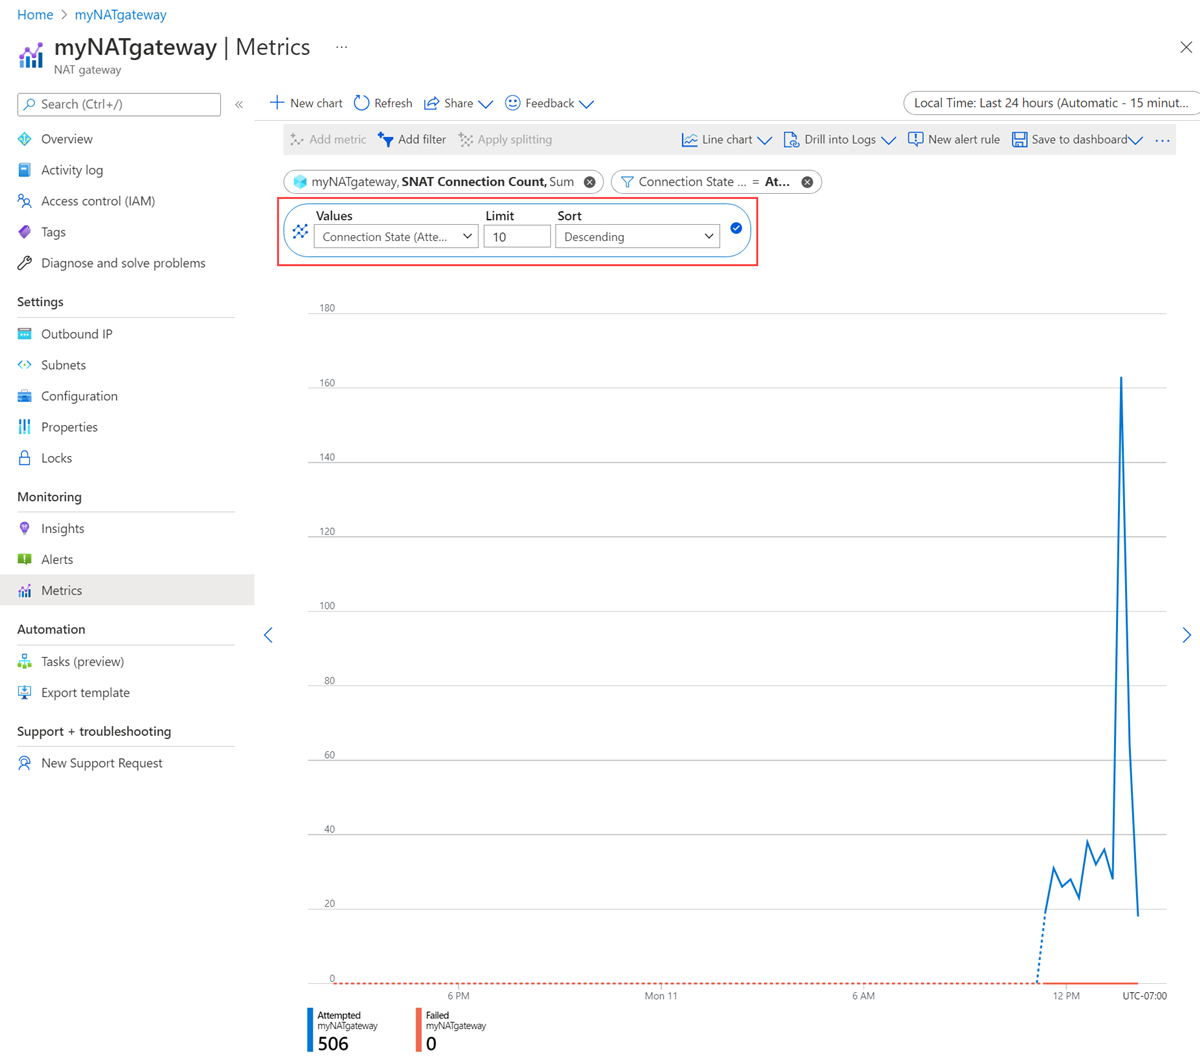
To view the connection state of your connections:
Select the NAT gateway resource you would like to monitor.
In the Metric drop-down menu, select the SNAT Connection Count metric.
In the Aggregation drop-down menu, select Sum.
Select to Add filter.
In the Property drop-down menu, select Connection State.
In the Values drop-down menu, select Attempted, Failed, or both.
To see attempted and failed connections as their own individual lines in the metric graph, select Apply splitting.
In the Values drop-down menu, select Connection State.
Total SNAT connection count
The Total SNAT connection count metric shows you the total number of active SNAT connections passing through NAT gateway.
You can use this metric to:
Evaluate the volume of connections passing through NAT gateway.
Determine if you're nearing the connection limit of NAT gateway.
Help assess if you're experiencing a pattern of failed outbound connections.
Possible reasons for failed connections:
- A pattern of failed connections can happen for various reasons. See the NAT gateway connectivity troubleshooting guide to help you further diagnose.
Note
When NAT gateway is attached to a subnet and public IP address, the Azure platform verifies NAT gateway is healthy by conducting health checks. These health checks appear in NAT gateway's SNAT Connection Count metrics. The amount of health check related connections may vary as the health check service is optimized, but is negligible and doesn’t impact NAT gateway’s ability to connect outbound.
Datapath availability
The datapath availability metric measures the health of the NAT gateway resource over time. This metric indicates if NAT gateway is available for directing outbound traffic to the internet. This metric is a reflection of the health of the Azure infrastructure.
You can use this metric to:
Monitor the availability of NAT gateway.
Investigate the platform where your NAT gateway is deployed and determine if it’s healthy.
Isolate whether an event is related to your NAT gateway or to the underlying data plane.
Possible reasons for a drop in data path availability include:
An infrastructure outage.
There aren't healthy VMs available in your NAT gateway configured subnet. For more information, see the NAT gateway connectivity troubleshooting guide.
Alerts
Alerts can be configured in Azure Monitor for all NAT gateway metrics. These alerts proactively notify you when important conditions are found in your monitoring data. They allow you to identify and address potential issues with NAT gateway.
For more information about how metric alerts work, see Azure Monitor Metric Alerts. The following guidance describes how to configure some common and recommended types of alerts for your NAT gateway.
Alerts for datapath availability degradation
Set up an alert on datapath availability to help you detect issues with the health of NAT gateway.
The recommended guidance is to alert on NAT gateway’s datapath availability when it drops below 90% over a 15-minute period. This configuration is indicative of a NAT gateway resource being in a degraded state.
To set up a datapath availability alert, follow these steps:
From the NAT gateway resource page, select Alerts.
Select Create alert rule.
From the signal list, select Datapath Availability.
From the Operator drop-down menu, select Less than.
From the Aggregation type drop-down menu, select Average.
In the Threshold value box, enter 90%.
From the Unit drop-down menu, select Count.
From the Aggregation granularity (Period) drop-down menu, select 15 minutes.
Create an Action for your alert by providing a name, notification type, and type of action that is performed when the alert is triggered.
Before deploying your action, test the action group.
Select Create to create the alert rule.
Note
Aggregation granularity is the period of time over which the datapath availability is measured to determine if it has dropped below the threshold value. Setting the aggregation granularity to less than 5 minutes may trigger false positive alerts that detect noise in the datapath.
Alerts for SNAT port exhaustion
Set up an alert on the SNAT connection count metric to notify you of connection failures on your NAT gateway. A failed connection volume greater than zero can indicate that you reached the connection limit on your NAT gateway or that you hit SNAT port exhaustion. Investigate further to determine the root cause of these failures.
To create the alert, use the following steps:
From the NAT gateway resource page, select Alerts.
Select Create alert rule.
From the signal list, select SNAT Connection Count.
From the Aggregation type drop-down menu, select Total.
From the Operator drop-down menu, select Greater than.
From the Unit drop-down menu, select Count.
In the Threshold value box, enter 0.
In the Split by dimensions section, select Connection State under Dimension name.
Under Dimension values, select Failed connections.
From the When to evaluate section, select 1 minute under the Check every drop-down menu.
For the lookback period, select 5 minutes from the drop-down menu options.
Create an Action for your alert by providing a name, notification type, and type of action that is performed when the alert is triggered.
Before deploying your action, test the action group.
Select Create to create the alert rule.
Note
SNAT port exhaustion on your NAT gateway resource is uncommon. If you see SNAT port exhaustion, check if NAT gateway's idle timeout timer is set higher than the default amount of 4 minutes. A long idle timeout timer setting can cause SNAT ports too be in hold down for longer, which results in exhausting SNAT port inventory sooner. You can also scale your NAT gateway with additional public IPs to increase NAT gateway's overall SNAT port inventory. To troubleshoot these kinds of issues, refer to the NAT gateway connectivity troubleshooting guide.
Alerts for NAT gateway resource health
Azure Resource Health provides information on the health state of your NAT gateway resource. The resource health of your NAT gateway is evaluated by measuring the datapath availability of your NAT gateway endpoint. You can set up alerts to notify you when the health state of your NAT gateway resource changes. To learn more about NAT gateway resource health and setting up alerts, see:
Network Insights
Azure Monitor Network Insights allows you to visualize your Azure infrastructure setup and to review all metrics for your NAT gateway resource from a preconfigured metrics dashboard. These visual tools help you diagnose and troubleshoot any issues with your NAT gateway resource.
View the topology of your Azure architectural setup
To view a topological map of your setup in Azure:
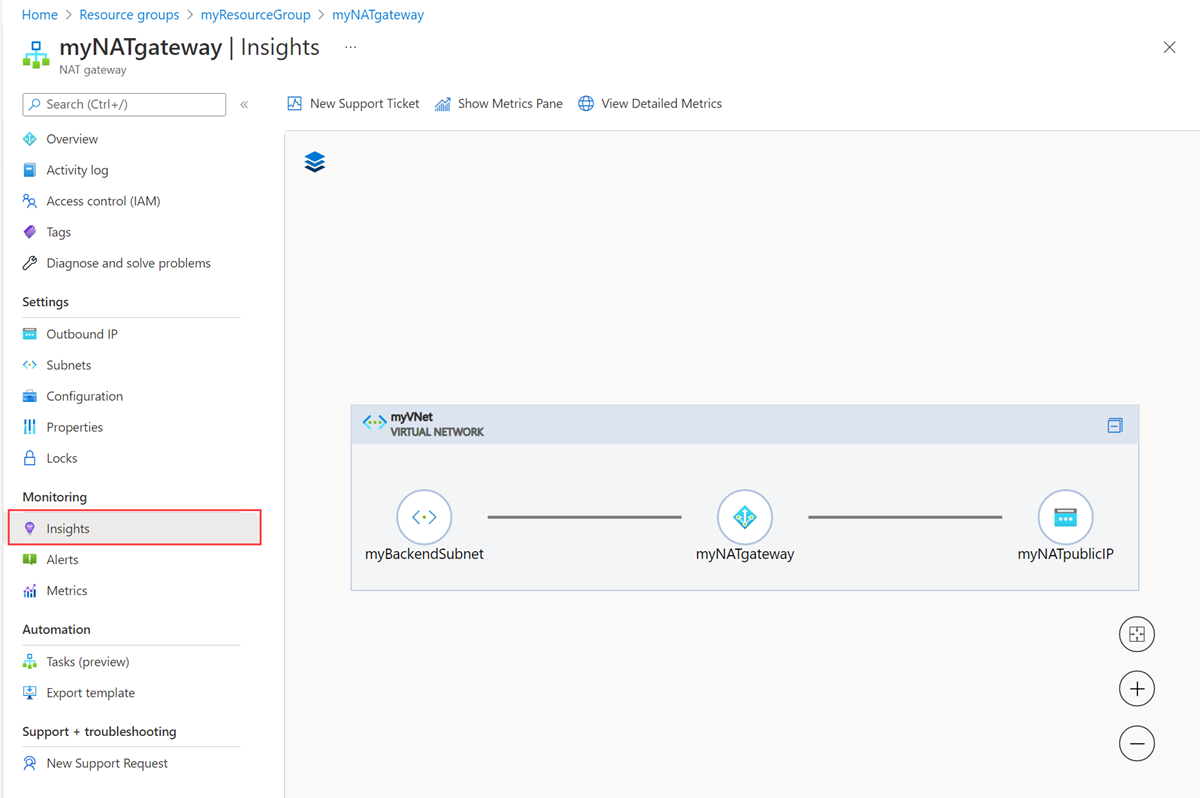
From your NAT gateway’s resource page, select Insights from the Monitoring section.
On the landing page for Insights, there's a topology map of your NAT gateway setup. This map shows the relationship between the different components of your network (subnets, virtual machines, public IP addresses).
Hover over any component in the topology map to view configuration information.
View all NAT gateway metrics in a dashboard
The metrics dashboard can be used to better understand the performance and health of your NAT gateway resource. The metrics dashboard shows a view of all metrics for NAT gateway on a single page.
All NAT gateway metrics can be viewed in a dashboard when selecting Show Metrics Pane.
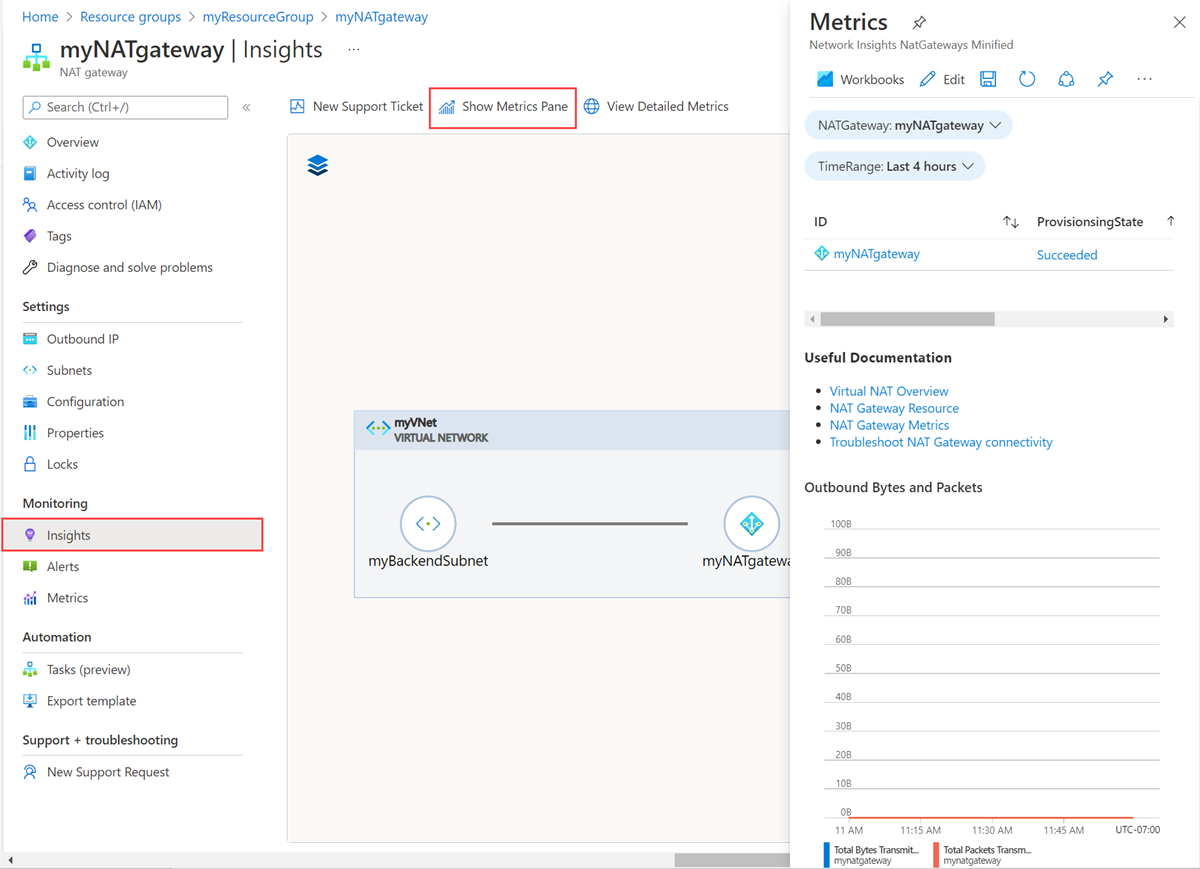
A full page view of all NAT gateway metrics can be viewed when selecting View Detailed Metrics.
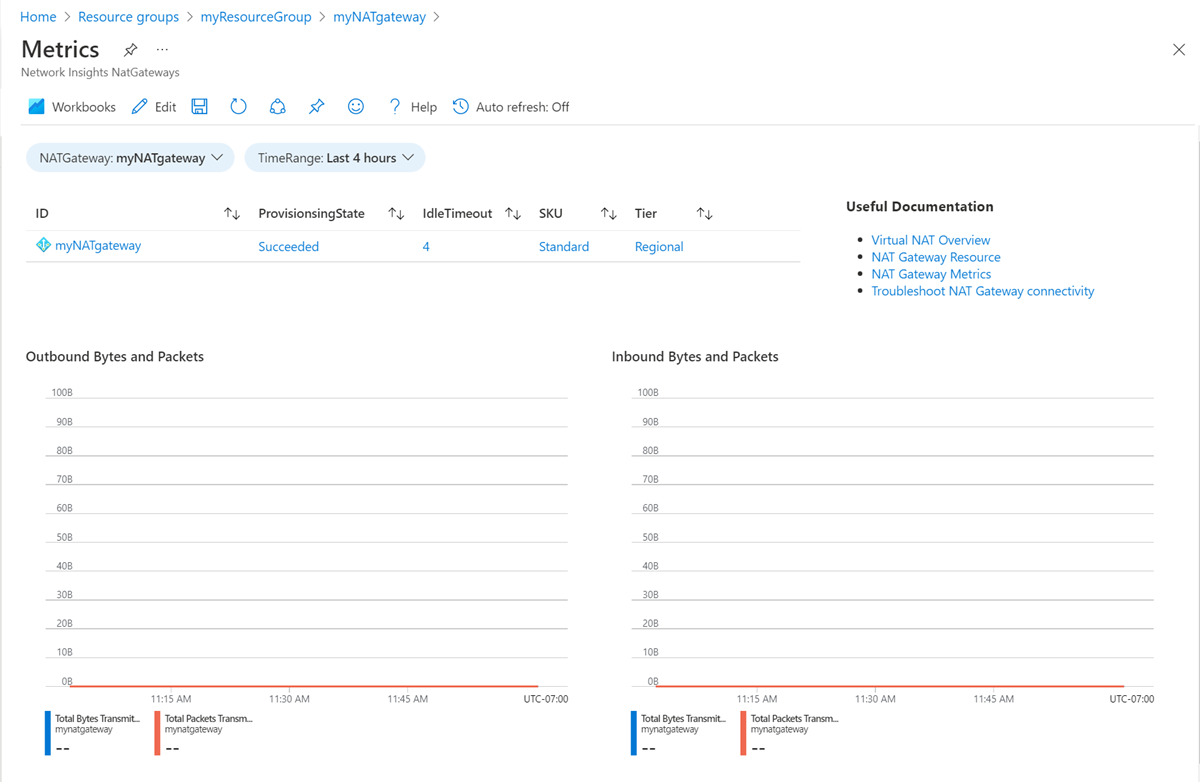
For more information on what each metric is showing you and how to analyze these metrics, see How to use NAT gateway metrics.
Metrics FAQ
What type of metrics are available for NAT gateway?
The NAT gateway supports multi-dimensional metrics. You can filter the multi-dimensional metrics by different dimensions to gain greater insight into the provided data. The SNAT connection count metric allows you to filter the connections by Attempted and Failed connections, enabling you to distinguish between different types of connections made by the NAT gateway.
Refer to the dimensions column in the metrics overview table to see which dimensions are available for each NAT gateway metric.
How do I store NAT gateway metrics long-term?
All platform metrics are stored for 93 days. If you require long term access to your NAT gateway metrics data, NAT gateway metrics can be retrieved by using the metrics REST API. For more information on how to use the API, see the Azure monitoring REST API walkthrough.
Note
Diagnostic Settings doesn’t support the export of multi-dimensional metrics to another location, such as Azure Storage and Log Analytics.
To retrieve NAT gateway metrics, use the metrics REST API.
How do I interpret metrics charts?
Refer to troubleshooting metrics charts if you run into issues with creating, customizing or interpreting charts in Azure metrics explorer.
Next steps
- Learn about Azure NAT Gateway
- Learn about NAT gateway resource
- Learn about Azure Monitor
- Learn about troubleshooting NAT gateway resources.
- Learn about troubleshooting NAT gateway connectivity