Enable and view audit logs of common management operations in BizTalk Server
In BizTalk Server 2020 and later, administrators can generate an audit trail of management operations on application artifacts. Examples include operations on send ports, receive ports, receive locations, orchestrations, and resources. You can also audit suspend, resume, and terminate operations on service instances.
Configure auditing
Auditing isn't configured by default. To turn on auditing:
Open the BizTalk Server Administration console.
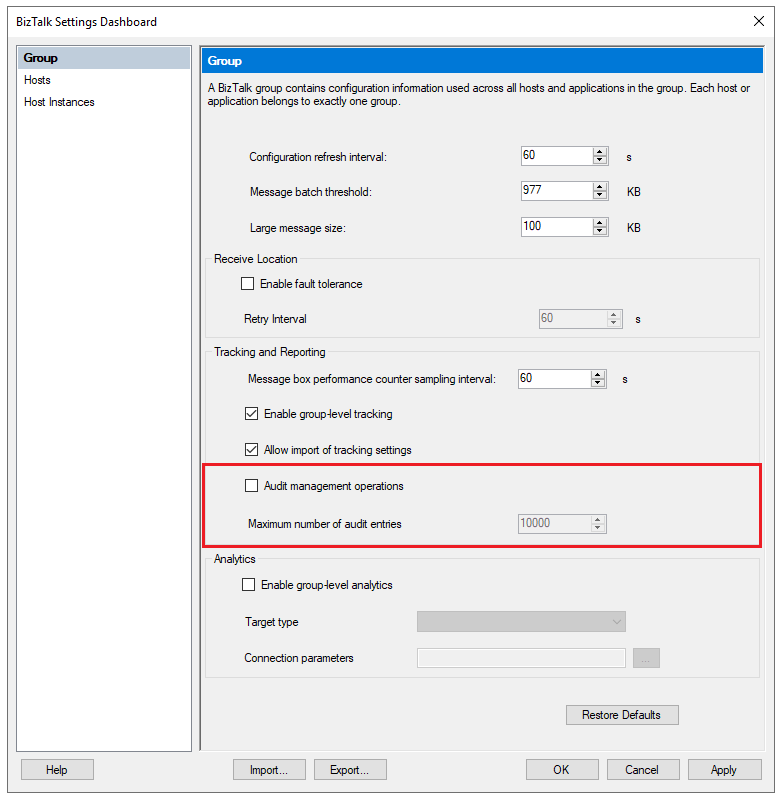
Right-click BizTalk Group, and then select Settings.
Select Audit management operations.
In the Maximum number of audit entries box, enter the number of entries that you'd like to retain. By default, BizTalk stores the 10,000 most recent entries.
Select OK to save your changes.
If you'd like to do more management operations in the same session, refresh the administration console.
View audit logs
Confirm that the Operational Data Service is configured. The service should be using an account that's a member of the BizTalk Server Administrators, the BizTalk Server Operators, or the BizTalk Server Read Only Users groups.
For more information, see Configure the REST APIs.
To view audit logs, go to
http://localhost/BizTalkOperationalDataService/AuditLogs.To see audit log entries from a specific date range, use one of these formats for the URL:
http://localhost/BizTalkOperationalDataService/AuditLogs?fromDate=<yyyy-MM-dd>&toDate=<yyyy-MM-dd>http://localhost/BizTalkOperationalDataService/AuditLogs?fromDate=<yyyy-MM-dd>T<hh:mm:ss>&toDate=<yyyy-MM-dd>T<hh:mm:ss>
For example, you might use one of these URLs:
http://localhost/BizTalkOperationalDataService/AuditLogs?fromDate=2022-05-01&toDate=2022-05-10http://localhost/BizTalkOperationalDataService/AuditLogs?fromDate=2022-05-01T01:00:00&toDate=2022-05-10T01:00:00
Audit log structure
An audit log contains following information:
Id: An ID of type
Guid, which is unique per entry.BatchId: An ID that's the same for all audited operations that you perform in a single SQL transaction. This value can help you correlate user operations with lower level details.
UserPrincipal: The user who ran the operation, for example,
jeffsmith@Fabricom.com.Machine: The name of the machine that the operation ran on, for example,
machine1@contoso.com.ArtifactId: The unique ID of the artifact.
ParentArtifactId: The ID of the parent artifact, if the artifact is a child of another artifact.
ArtifactType: The type of artifact that the operation ran on, for example,
SendPort,ReceivePort, orApplication.ArtifactName: The name of the artifact. This value is configured by the user, for example,
FTP send port.OperationName: The action that ran on the artifact, for example,
Create.The following table lists operations that you can run on different types of artifacts:
Artifact type Operation names Port Create, Update, Delete Service instance Suspend, Resume, Terminate Application resource Add, Update, Remove Binding file Import Payload: Information about the changes that the operation made. The payload is in JSON format, for example,
{"Description":"New description"}.CreatedDate: The time stamp of the operation.
When an artifact is created or updated, one or more audit entries are logged. For example, when a send port is created, audit entries are logged for each of these artifacts:
- The send port
- The primary transport
- The secondary transport
All three entries have the same BatchId. You can use the ArtifactId and ParentArtifactId values to correlate audit log entries for primary and secondary transports with send ports.