Use and customize the Cost optimization workbook
This article explains how to install and edit the Cost optimization workbook. The Cost optimization workbook is a central point for some of the most often used tools that can help achieve utilization and efficiency goals. It offers a range of insights, including:
- Advisor cost recommendations
- Idle resource identification
- Management of improperly deallocated virtual machines
- Insights into using Azure Hybrid Benefit options for Windows, Linux, and SQL databases
The workbook includes insights for compute, storage and networking. The workbook also has a quick fix option for some queries. The quick fix option allows you to apply the recommended optimization directly from the workbook page, streamlining the optimization process.
The workbook has two main sections: Rate optimization and Usage optimization.
Rate optimization
This section focuses on strategies to optimize your Azure costs by addressing rate-related factors. It includes insights from Advisor cost recommendations, guidance on the utilization of Azure Hybrid Benefit options for Windows, Linux, and SQL databases, and more. It also includes recommendations for commitment-based discounts, such as Reservations and Azure Savings Plans. Rate optimization is critical for reducing the hourly or monthly cost of your resources.
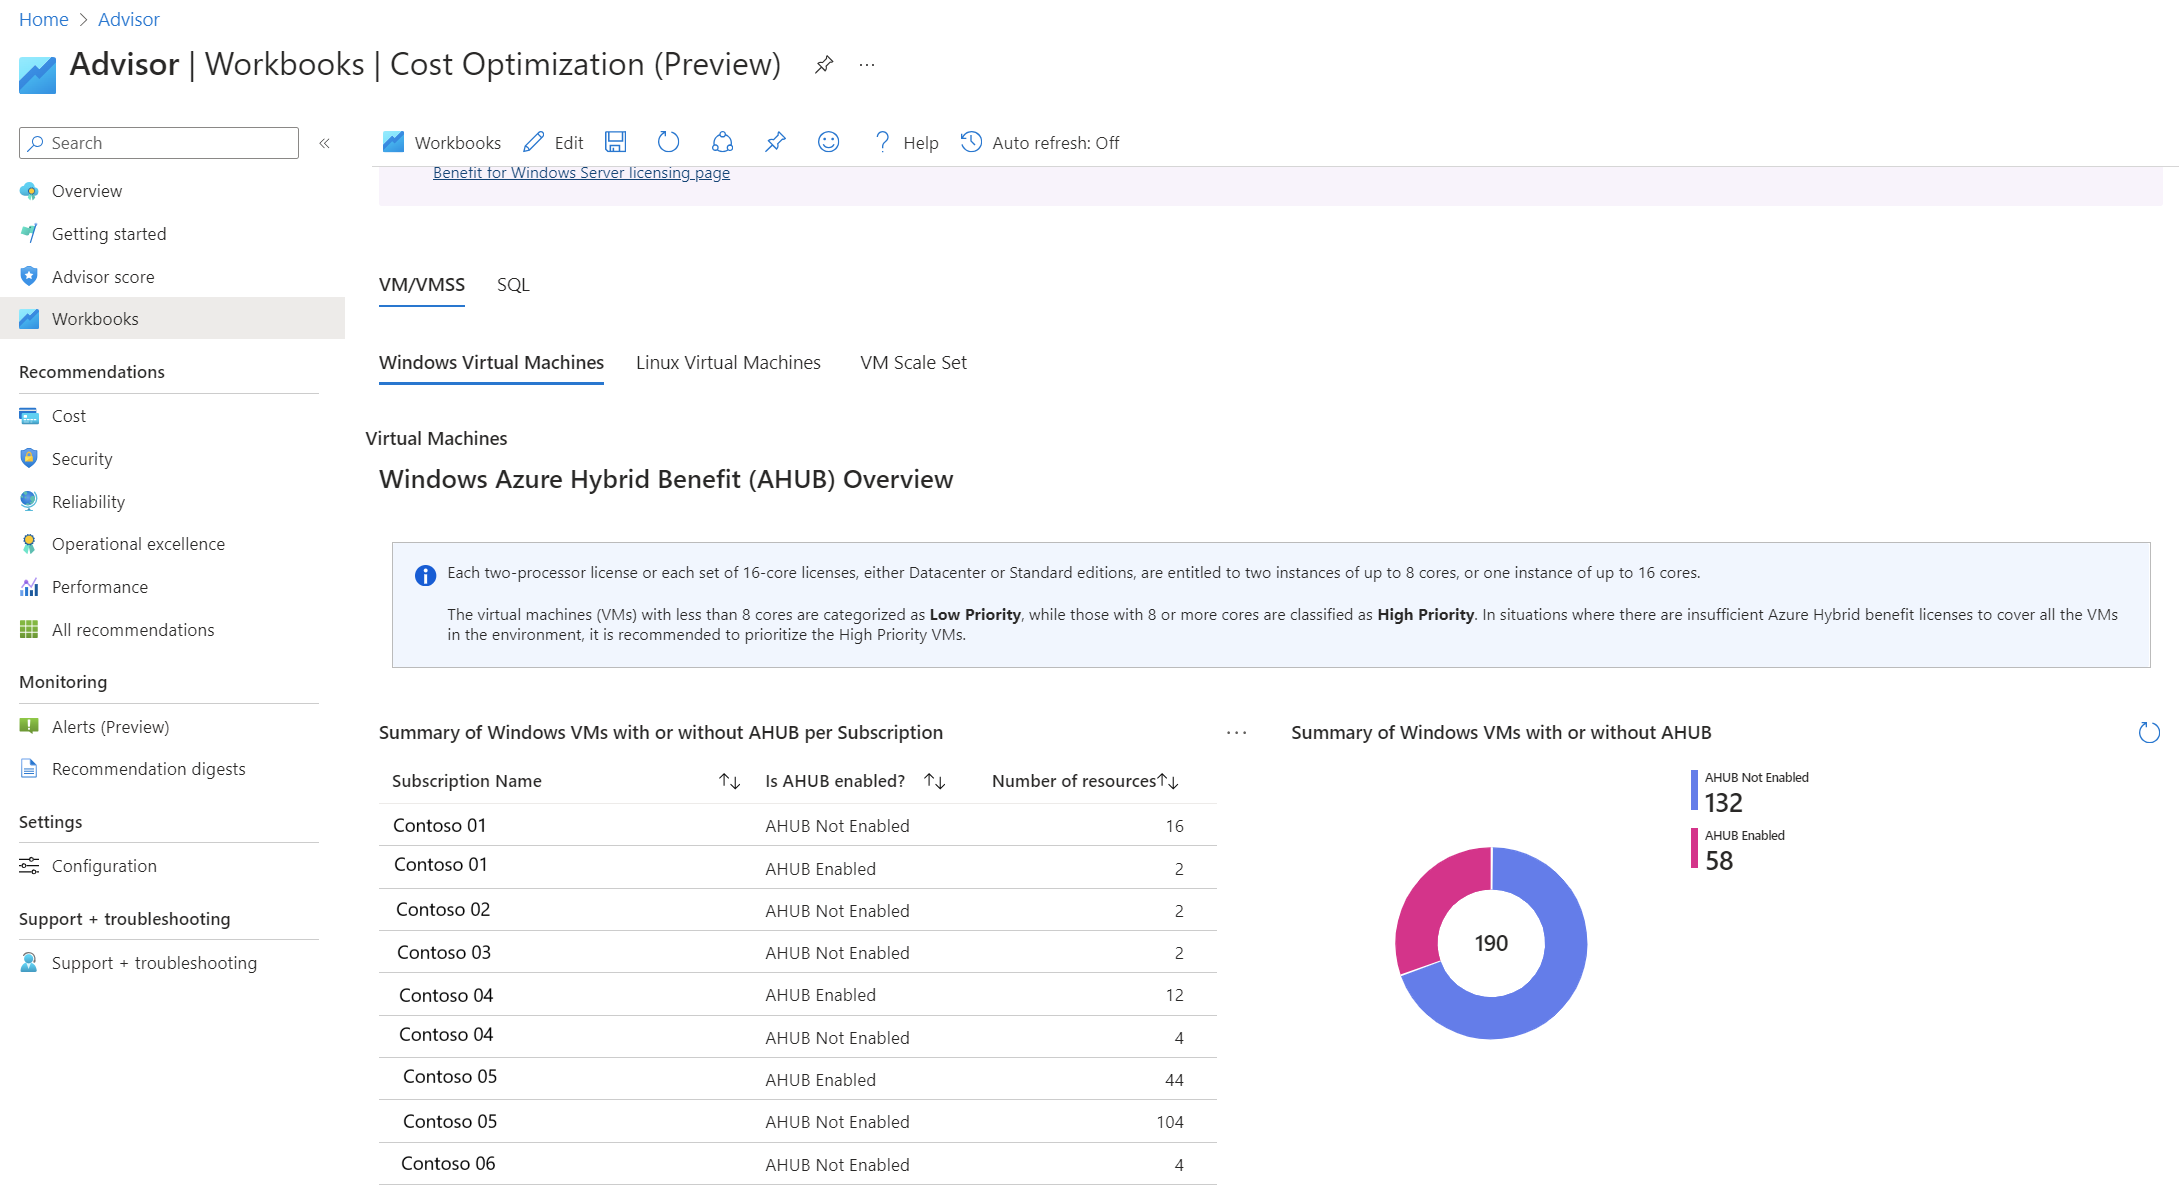
Here's an example of the Rate optimization section for Windows virtual machines with Azure Hybrid Benefit.
Usage optimization
The purpose of Usage optimization is to ensure that your Azure resources are used efficiently. This section provides guidance to identify idle resources, manage improperly deallocated virtual machines, and implement recommendations to enhance resource efficiency. Focus on usage optimization to maximize your resource utilization and minimize costs.
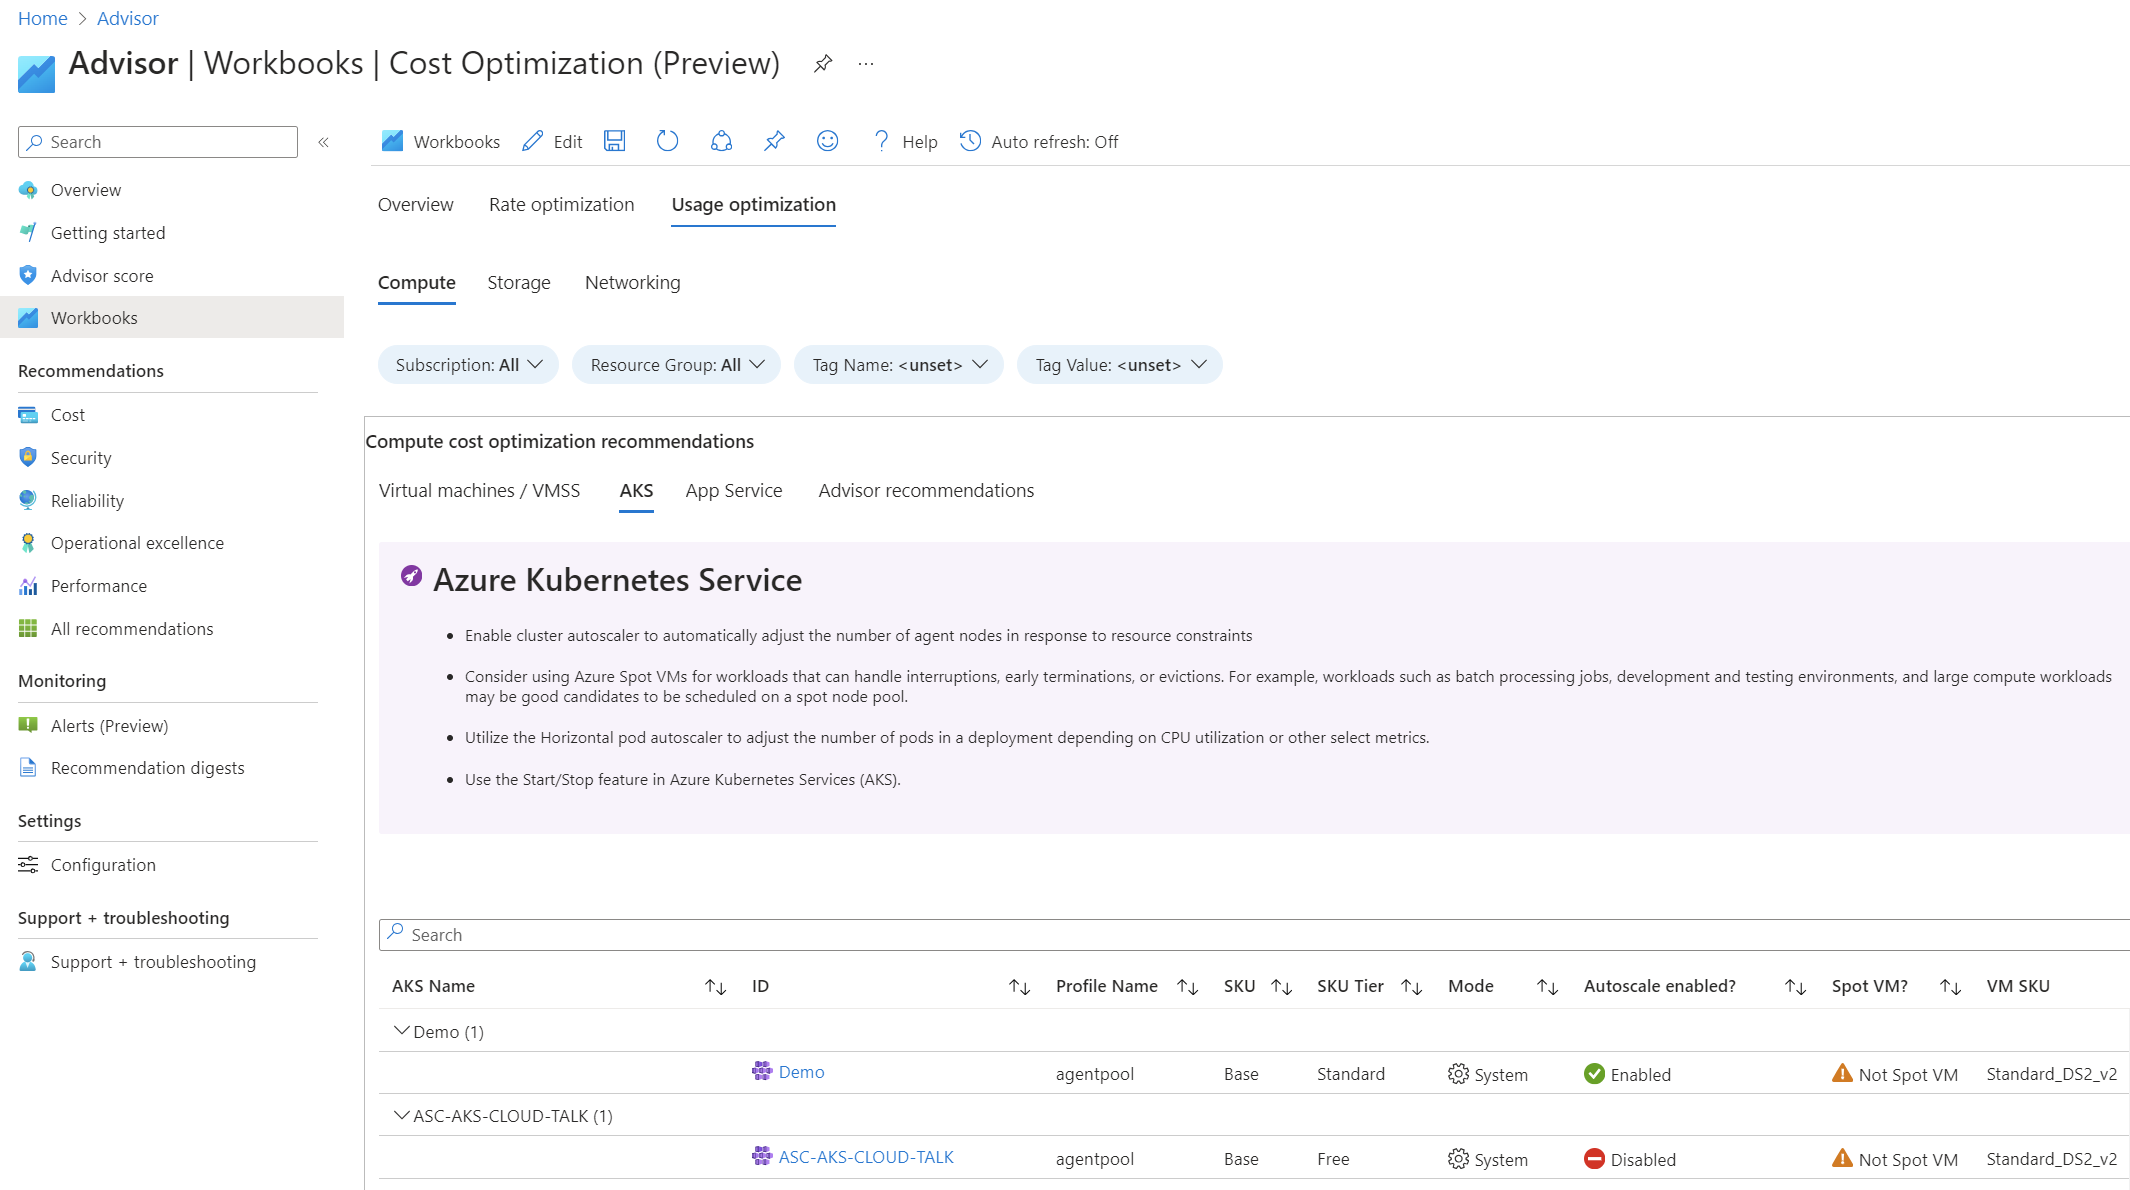
Here's an example of the Usage optimization section for AKS.
For more information about the Cost optimization workbook, see Understand and optimize your Azure costs using the Cost optimization workbook.
Use the workbook
Azure Monitor workbooks provide a flexible canvas for data analysis and the creation of rich visual reports within the Azure portal. You can then customize them to display visual and interactive information about your Azure environment. It allows you to query various sources of data in Azure and modify or process the data if needed. Then you can choose to display it using any of the available visualizations and finally share the workbook with your team so everyone can use it.
The Cost optimization workbook is in the Azure Advisor's workbook gallery, and it doesn't require any setup. However, if you want to make changes to the workbook, like adding or customizing queries, you can copy the workbook to your environment.
View the workbook in Advisor
- Sign in to the Azure portal.
- Search for Azure Advisor.
- In the left navigation menu, select Workbooks.
- In the Workbooks Gallery, select the Cost Optimization (Preview) workbook template.
- Select an area to explore.
Deploy the workbook to Azure
If you want to make modifications to the original workbook, its template is offered as part of the FinOps toolkit and can be deployed in just a few steps.
Confirm that you have the following least-privileged roles to deploy and use the workbook.
- Workbook Contributor - allows you to import, save, and deploy the workbook.
- Reader allows you to view all the workbook tabs without saving.
Deploy the Cost optimization workbook template with one of the following options.
{% include deploy.html template="optimization-workbook" public="1" gov="1" china="0" %}
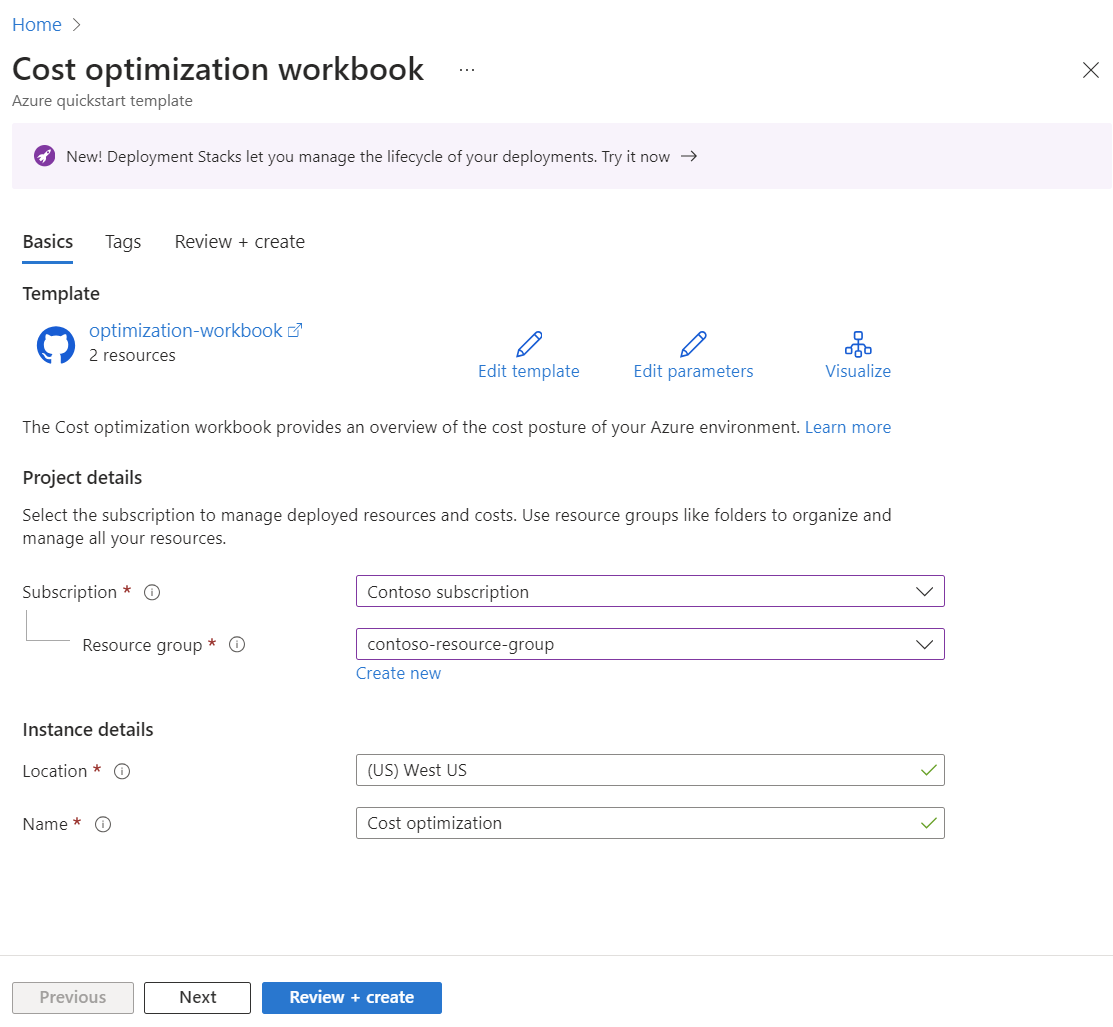
Select a subscription, location, resource group and give the workbook a name. Then, select Review + create to deploy the workbook template.
On the Review + create page, select Create.
After the deployment completes, you can view and copy the workbook URL on the Outputs page. The URL takes you directly to the workbook that you created. Here's an example.
Edit and include new queries to the workbook
If you want to edit or include more queries in the workbook, you can edit the template for your needs.
The workbook is primarily based on Azure Resource Graph queries. However, workbooks support many different sources. They include KQL, Azure Resource Manager, Azure Monitor, Azure Data Explorer, Custom Endpoints, and others.
You can also merge data from different sources to enhance your insights experience. Azure Monitor has several correlatable data sources that are often critical to your triage and diagnostic workflow. You can merge or join data to provide rich insights using the merge control.
Here's how to create and add a query to the Azure Hybrid benefit tab in the workbook. For this example, you add code from the Code example section to help you identify which Azure Stack HCI clusters aren't using Azure Hybrid Benefit.
- Open the Workbook and select Edit.
- Select the Rate optimization tab , which shows virtual machines using Azure Hybrid Benefit.
- At the bottom of the page on the right side, to the right of the last Edit option, select the ellipsis (…) symbol and then select Add. This action adds a new item after the last group.
- Select Add query.
- Change the Data source to Azure Resource Graph. Leave the Resource type as Subscriptions.
- Under Subscriptions, select the list option and then under Resource Parameters, select Subscriptions.
- Copy the example code from the Code example section and paste it into the editor.
- Change the ResourceGroup name in the code example to the one where your Azure Stack HCI clusters reside.
- At the bottom of the page, select Done Editing.
- Save your changes to the workbook and review the results.
Understand code sections
Although the intent of this article isn't to focus on Azure Resource Graph queries, it's important to understand what the query example does. The code example has three sections.
In the first section, the following code identifies and groups your own subscriptions.
ResourceContainers | where type =~ 'Microsoft.Resources/subscriptions' | where tostring (properties.subscriptionPolicies.quotaId) !has "MSDNDevTest_2014-09-01" | extend SubscriptionName=name
It queries the ResourceContainers table and removes the ones that are Dev/Test because Azure Hybrid Benefit doesn't apply to Dev/Test resources.
In the second section, the query finds and assesses your Stack HCI resources.
resources
| where resourceGroup in ({ResourceGroup})
| where type == 'microsoft.azurestackhci/clusters'
| extend AHBStatus = tostring(properties.softwareAssuranceProperties.softwareAssuranceIntent)
| where AHBStatus == "Disable"
This section queries the Resource table. It filters by the resource type microsoft.azurestackhci/clusters. It creates a new column called AHBStatus with the property where we have the software assurance information. And, we want only resources where the AHBStatus is set to Disable.
In the last section, the query joins the ResourceContainerstable with the resources table. The join helps to identify the subscription that the resources belong to.
ResourceContainers | "Insert first code section go here"
| join (
resources  "Insert second code section here"
) on subscriptionId
| order by type asc
| project HCIClusterId,ClusterName,Status,AHBStatus
In the end, you view the most relevant columns. Because the workbook has a ResourceGroup parameter, the example code allows you to filter the results per resource group.
Code example
Here's the full code example that you use to insert into the workbook.
ResourceContainers | where type =~ 'Microsoft.Resources/subscriptions' | where tostring (properties.subscriptionPolicies.quotaId) !has "MSDNDevTest_2014-09-01"  | extend SubscriptionName=name
| join (
  resources
  | where resourceGroup in ({ResourceGroup})
  | where type == 'microsoft.azurestackhci/clusters'
  | extend AHBStatus = tostring(properties.softwareAssuranceProperties.softwareAssuranceIntent)
  | where AHBStatus == "Disable"
  | extend HCIClusterId=properties.clusterId, ClusterName=properties.clusterName, Status=properties.status, AHBStatus=tostring(properties.softwareAssuranceProperties.softwareAssuranceIntent)
) on subscriptionId
| order by type asc
| project HCIClusterId,ClusterName,Status,AHBStatus
Learn more about workbooks
To learn more about Azure Monitor workbooks, see the Visualize data combined from multiple data sources by using Azure Monitor Workbooks training module.
Next steps
To learn more about the Cost optimization workbook, see Visualize data combined from multiple data sources by using Azure Monitor Workbooks.
Feedback
Coming soon: Throughout 2024 we will be phasing out GitHub Issues as the feedback mechanism for content and replacing it with a new feedback system. For more information see: https://aka.ms/ContentUserFeedback.
Submit and view feedback for


