Capture Composer telemetry with Application Insights
APPLIES TO: Composer v1.x and v2.x
Bot Framework Composer enables your bot applications to send event data to a telemetry service such as Application Insights. Telemetry offers insights into your bot by showing which features are used the most, detects unwanted behavior and offers visibility into availability, performance, and usage. In this article, you'll learn how to implement telemetry into your bot using Application Insights.
Note
You may want to look at the related Bot Framework SDK article Add telemetry to your bot.
Prerequisites
- A subscription to Microsoft Azure.
- A basic bot built using Composer.
- Basic knowledge of Kusto queries.
- How to use Log Analytics in the Azure portal to write Azure Monitor log queries.
- The basic concepts of Log queries in Azure Monitor.
Create an Application Insights resource
Azure Application Insights displays data of your application in a Microsoft Azure resource. Creating a new resource is part of setting up Application Insights to monitor an application. After creating your new resource, you can get its instrumentation key and use it to configure settings in Composer. The instrumentation key links your telemetry to the resource.
If you've not yet provisioned Application Insights for your bot, do so before continuing. You can do so from within Composer, from the command line, or within the Azure portal. For more information, see How to provision Azure resources.
Update Composer settings
When the current publishing profile for your bot includes Application Insights, Composer updates the bot configuration to use the provisioned instrumentation key.

Analyze bot behavior with Application Insights
After making these changes to include the instrumentation key, you can run and interact with your bot to generate telemetry data. To see this telemetry data, navigate to the Logs section of your Application Insights resource in Azure.
For example, if you run a simple specified customEvents as a query, which shows all custom events, but you can narrow down the events or fields you want to see by providing different queries. see Analyze your bot's telemetry data for additional information on creating custom queries.

As standard you can track a number of events, including bot messages sent or received, LUIS results, dialog events (started / completed / canceled) and QnA Maker events. Specifically for QnA Maker, you can filter down to events named QnAMakerRecognizerResult, which will include the original query, the top answers from the QmA Maker Knowledge Base and the score etc.
Once you're gathering telemetry from your bot, you can also try using Power BI template, which contains some QnA tabs, to view your data. The template was built for use with the Virtual Assistant template, and you can find details of this on GitHub.
Note
Azure QnA Maker will be retired on 31 March 2025. Beginning 1 October 2022, you won't be able to create new QnA Maker resources or knowledge bases. A newer version of the question and answering capability is now available as part of Azure AI Language.
Custom question answering, a feature of Azure AI Language, is the updated version of the QnA Maker service. For more information about question-and-answer support in Composer, see Natural language processing.
Note
Language Understanding (LUIS) will be retired on 1 October 2025. Beginning 1 April 2023, you won't be able to create new LUIS resources. A newer version of language understanding is now available as part of Azure AI Language.
Conversational language understanding (CLU), a feature of Azure AI Language, is the updated version of LUIS. For more information about question-and-answer support in Composer, see Natural language processing.
Additional information
Configure telemetry
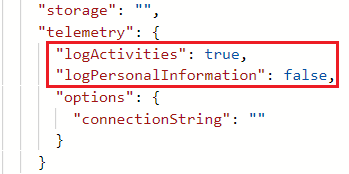
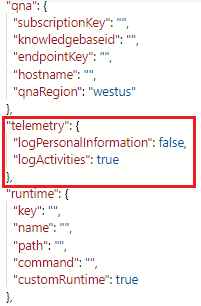
In Composer, there are two additional settings in the app settings that you need to be aware of: logActivities and logPersonalInformation. logActivities, which is set to true by default, determines if your incoming and outgoing activities are logged. logPersonalInformation, which is set to false by default, determines if more sensitive information is logged. You may see some of the fields blank if you don't enable this.
The Application Insights action
Wherever you want to track a custom event, you can add the Emit a telemetry track event action, which can be found under the Debugging Options menu. Once added to your authoring canvas, you specify a custom name for the event, which is the name of the event that will appear in the customEvents table referenced above, along with optionally specifying one or more additional properties to attach to the event.
Further reading
Feedback
Coming soon: Throughout 2024 we will be phasing out GitHub Issues as the feedback mechanism for content and replacing it with a new feedback system. For more information see: https://aka.ms/ContentUserFeedback.
Submit and view feedback for