Note
Access to this page requires authorization. You can try signing in or changing directories.
Access to this page requires authorization. You can try changing directories.
APPLIES TO: Composer v2.x
This article shows you how to use Web Chat in Composer to test a bot locally, how to save a transcript from your Web Chat test for debugging, and how to use the Web Chat Inspector to view trace activities and bot state.
Note
With the current Web Chat integration:
- You can test a local root bot directly.
- You can test a local skill indirectly, through the root bot.
However, you need to test remote bots and skills in the Emulator.
Prerequisites
- Install Bot Framework Composer 1.4 and above.
- A basic bot built using Composer.
Run and test a bot locally
Select the Start bot button on the top right to start your bot's local runtime.
Once your bot is running, the Local bot runtime manager opens and will show your bot's status as running.
Note
If you see a Windows Security Alert, your firewall has blocked some features of this app. Select Allow access.
Select Open Web Chat to the right of your root bot or select the Open Web Chat (
 ) icon from the toolbar. This will open the Web Chat window where you interact with your root bot. You can test different types of message activities, including text, cards and suggested actions.
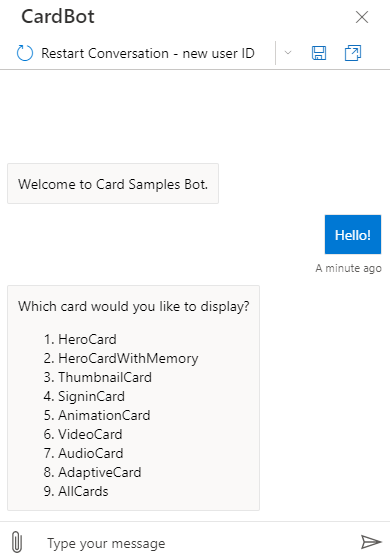
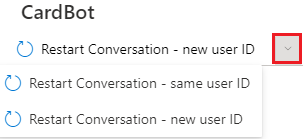
Select Restart Conversation to restart a conversation. Use the drop-down menu to the right of the button to choose whether to start the conversation with the same user ID or a new user ID.
Save a transcript for debugging
A bot transcript file is a specialized JSON file. It preserves the interactions between a user and your bot, including the contents of a message, interaction details such as the user ID, channel ID, channel type, channel capabilities, time of the interaction, and more. All of this information can be used to help find and resolve issues when testing and debugging your bot.
This section walks you through the process to save a transcript from your Web Chat test and use the transcript to debug your bot.
Select the Save chat transcripts (
 ) icon in the upper-right of the Web Chat window.
Choose a location to save the transcript file.
Select the saved transcript (
 ) icon to open the file in the Emulator. With your transcript file loaded, you're now ready to debug the interactions that you captured between a user and your bot.
Select any event or activity from the conversation window on the left. In the example shown below, the user's first interaction when they sent the message "Hi" was selected.
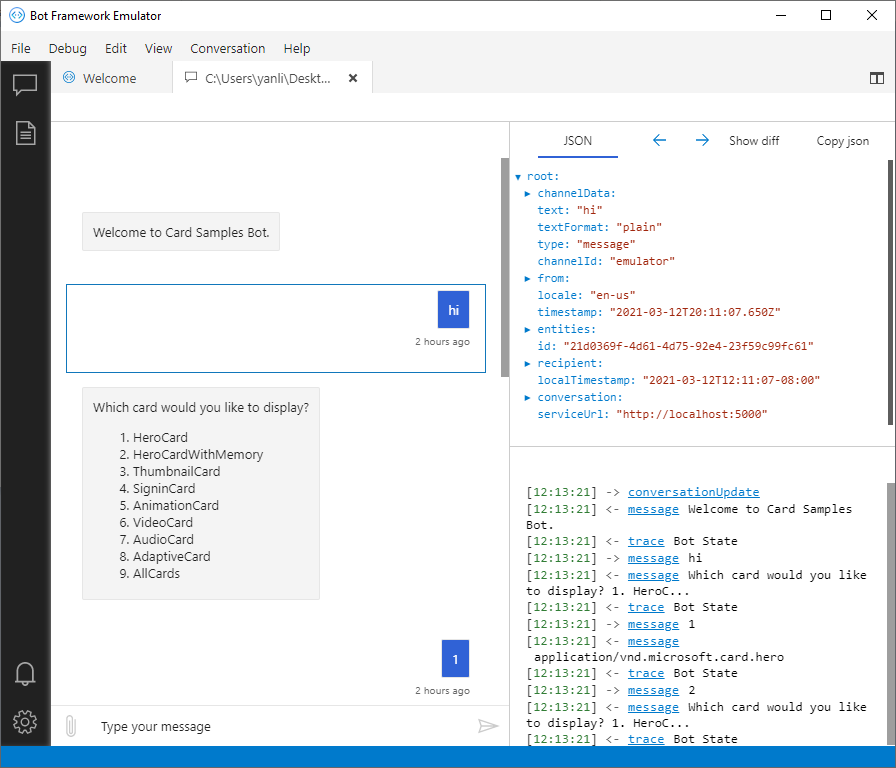
Looking at some of these values from the JSON window on the top right, you'll see some detailed information such as the:
- Plain text sent contained "Hi".
- Interaction type was message.
- Time the message was sent.
- User ID and information.
This detailed information allows you to follow the step-by-step interactions between the user's input and your bot's response, which is useful for debugging situations.
Web Chat Inspector
Note
Azure QnA Maker will be retired on 31 March 2025. Beginning 1 October 2022, you won't be able to create new QnA Maker resources or knowledge bases. A newer version of the question and answering capability is now available as part of Azure AI Language.
Custom question answering, a feature of Azure AI Language, is the updated version of the QnA Maker service. For more information about question-and-answer support in Composer, see Natural language processing.
Note
Language Understanding (LUIS) will be retired on 1 October 2025. Beginning 1 April 2023, you won't be able to create new LUIS resources. A newer version of language understanding is now available as part of Azure AI Language.
Conversational language understanding (CLU), a feature of Azure AI Language, is the updated version of LUIS. For more information about question-and-answer support in Composer, see Natural language processing.
You can view bot state, LUIS, QnA, and other trace activities, as well as track properties in memory. All of these features are located in the diagnostics panes at the bottom of the Composer window.

The Problems panel logs authoring errors and warnings such as incorrect syntax or a missing configuration file.
The Web Chat Inspector panel logs errors and warnings that happen between Composer and the bot. For example, if you enter an invalid app ID or password, you'll see the errors in the Web Chat Inspector panel.
The Output panel shows the standard output/error stream, when the bot is running, from the .NET or JavaScript runtime. This includes start up information and runtime errors.
See the section below for information about how to use the Watch panel to track properties in memory during testing.
Watch panel
Composer users can track one or more properties in memory during Web Chat testing using the Watch panel. This makes the debugging process easier, and lets developers track variables within Composer without any additional logic.
To watch a property in memory, do the following:
Start and run the bot with the property or properties you want to watch using Web Chat.
Select the Watch panel on bottom of the screen.
Select Add a Property to add a property to watch.
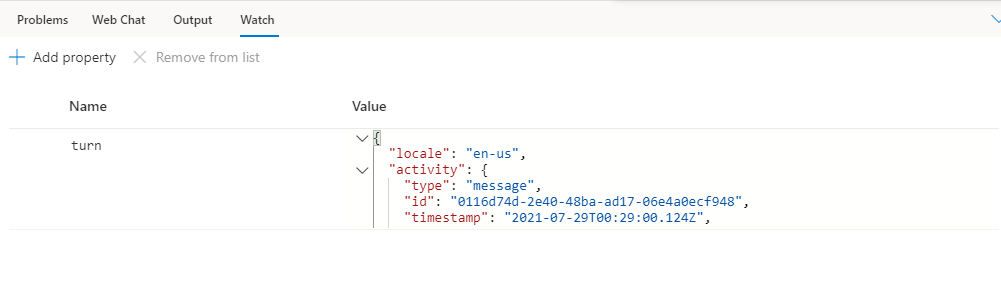
Now select the grey box under Name. A box will appear with drop-down menus to add dialog, this, and turn properties. Select one of these or add your own property from memory to watch.
Now test your bot in Web Chat and track the properties you've added to the Watch panel. The screenshot below shows an example of the turn property.