Note
Access to this page requires authorization. You can try signing in or changing directories.
Access to this page requires authorization. You can try changing directories.
Welcome to the Copilot for Data Engineering & Data Science exercise in Microsoft Fabric!
This exercise is the second in the Copilot in Microsoft Fabric tutorial. In this exercise you learn how Copilot can be used in the notebooks for the Data Engineering and Data Science workloads to generate code snippets, provide explanation for existing code, suggest data visualizations, suggest analytical machine learning models, and more.
You also learn how to write effective prompts to better utilize Copilot's capabilities in diverse scenarios. A step-by-step video is also included to visually guide you visually through the exercise.
As in the previous exercise, to complete this exercise, you need to enable Copilot in Microsoft Fabric and ensure you have the required assets for this exercise. If you haven't done so, you can download the required assets from this link.
You also need the following tables loaded in your Lakehouse from the previous exercise:
- DimCustomer
- DimProducts
- Sales
- DimShipping
- DimStore
- DimDate
- DimEmployee
- Person
Scenario: A data engineer / data scientist is looking to analyze the demographics of the customers. The engineer needs to:
- Understand the existing code that loads and transforms the customer data.
- Transform the data to remove empty values and add new columns to aid in further analysis.
- Visualize the customer data by various demographics.
- Create a machine learning model to predict the likelihood of a customer to purchase a bike to help the marketing team build a targeted campaign.
The following video shows the overall process you go through this exercise:
Let's get started!
Using Copilot for Data Engineering & Data Science
Objective: Understand how to use Copilot in notebooks for Data Engineering and Data Science workloads to generate code snippets, provide explanation for existing code, suggest data visualizations, suggest analytical machine learning models, and more.
To complete this exercise, perform the following steps:
Open the Lakehouse in which data from the Data Factory in the previous exercise is loaded. Inside the Tables folder, open the
Persontable.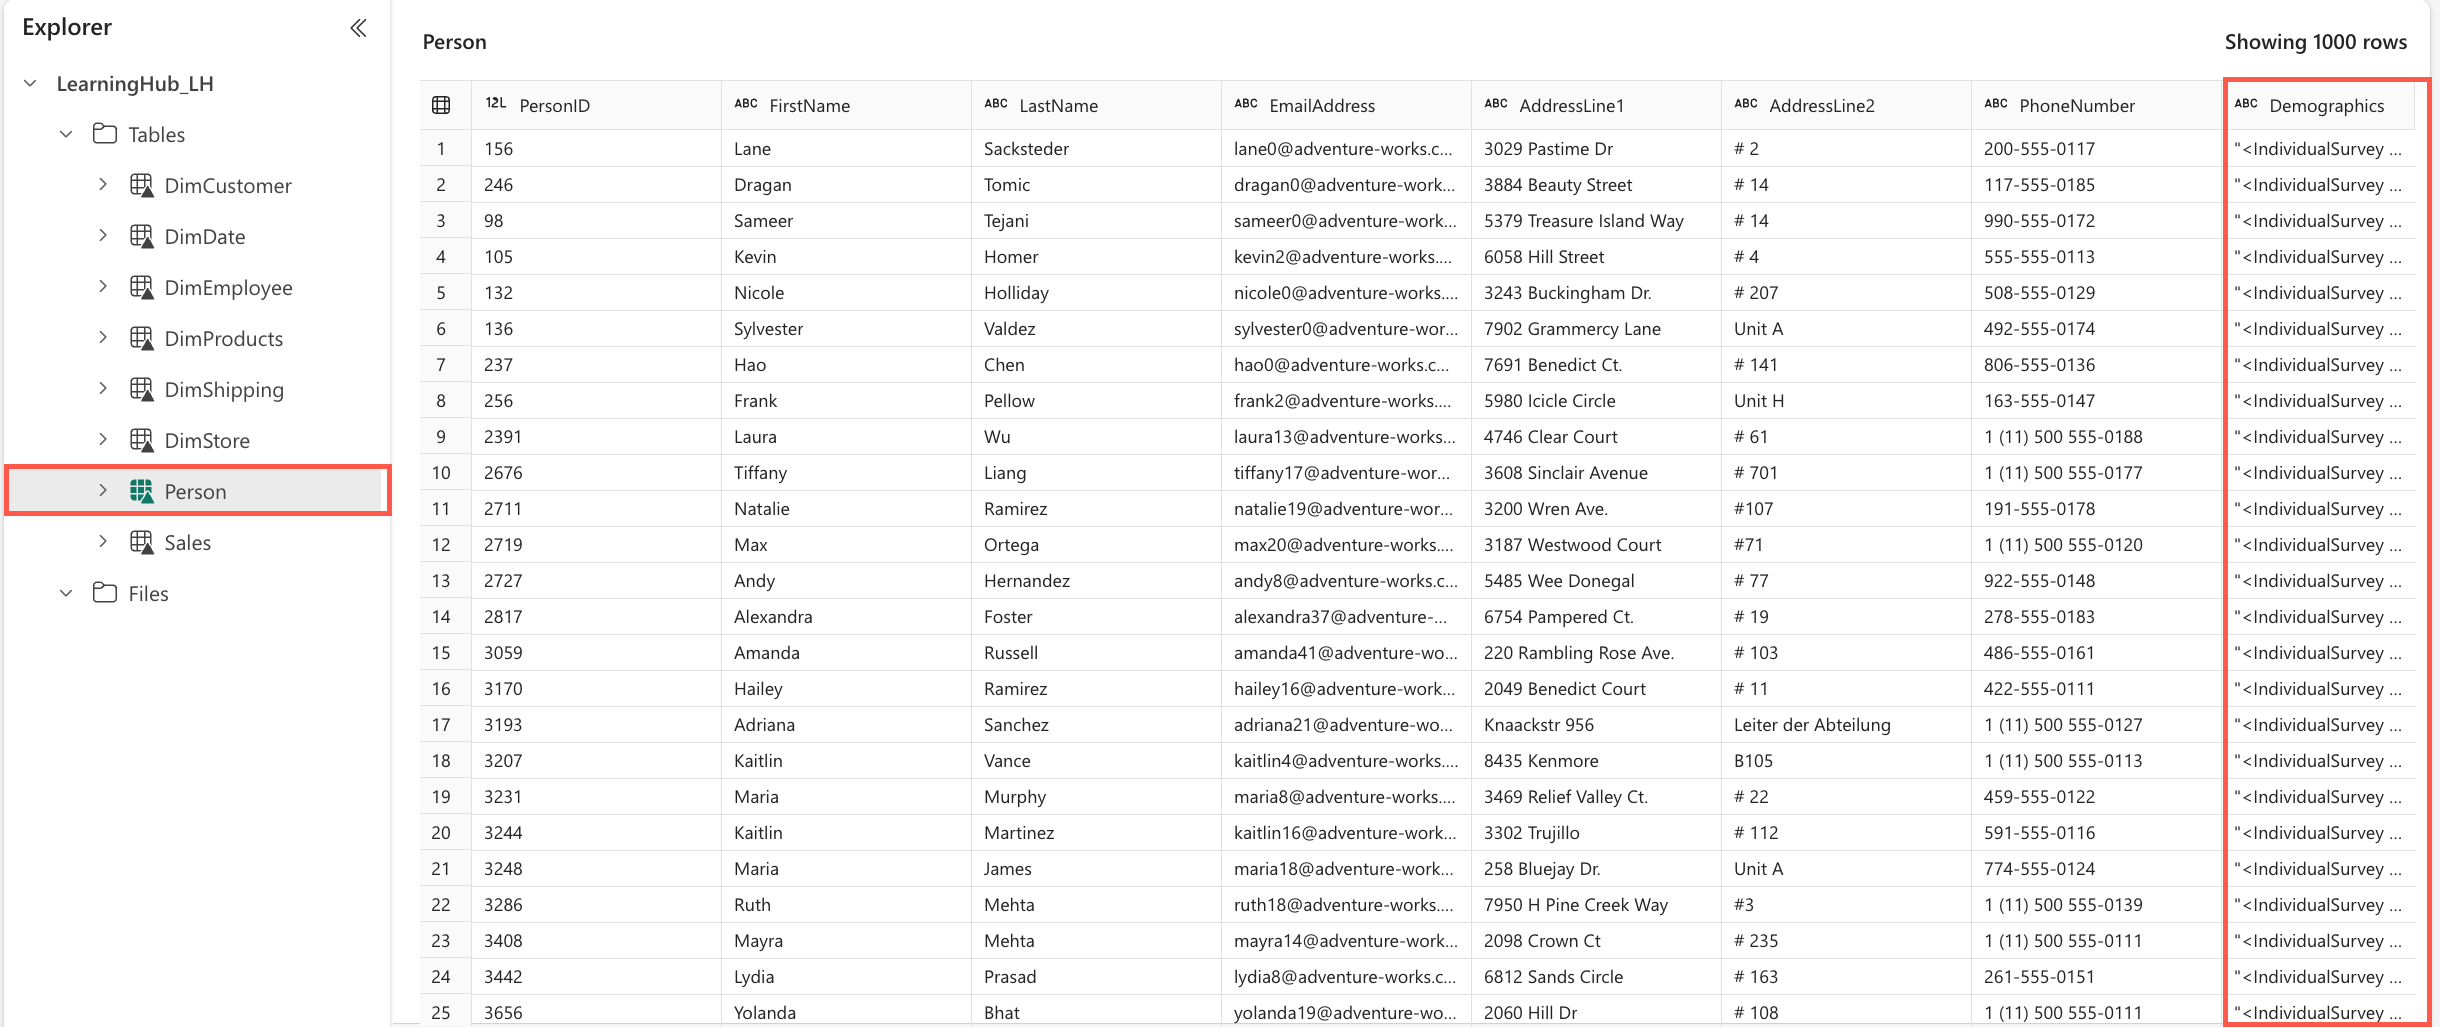
This opens the
Persontable. The last column, namedDemographics, contains the demographics for each person as XML data. In the next steps, we'll transform this data to extract it into its own table and build an analytical model.From the assets you downloaded, you will use the *[load_demographics.ipynb] notebook in this exercise.
Open your workspace and from the toolbar select Import > Notebook > From this computer. On the panel that opens, select the Upload button and upload the load_demographics.ipynb file.
Once the upload is successful, open the load_demographics notebook. In the explorer, choose Lakehouses as your data source and select Add. Pick the existing Lakehouse where your data is stored and select Add again to finalize. The explorer will display the Lakehouse with all tables from the previous exercise.
The notebook contains some pre-written code. Use Copilot to explain the code and review the DataFrames before making any changes. Also, update the Lakehouse name in the Select statement to match your own Lakehouse.
Add Copilot capabilities by selecting the Copilot button from the menu ribbon. This opens the Copilot panel on the right side of the screen.
Select the Get started button in the Copilot panel. This adds a cell at the start of the notebook, with code that adds the required packages to use Copilot in the notebook.
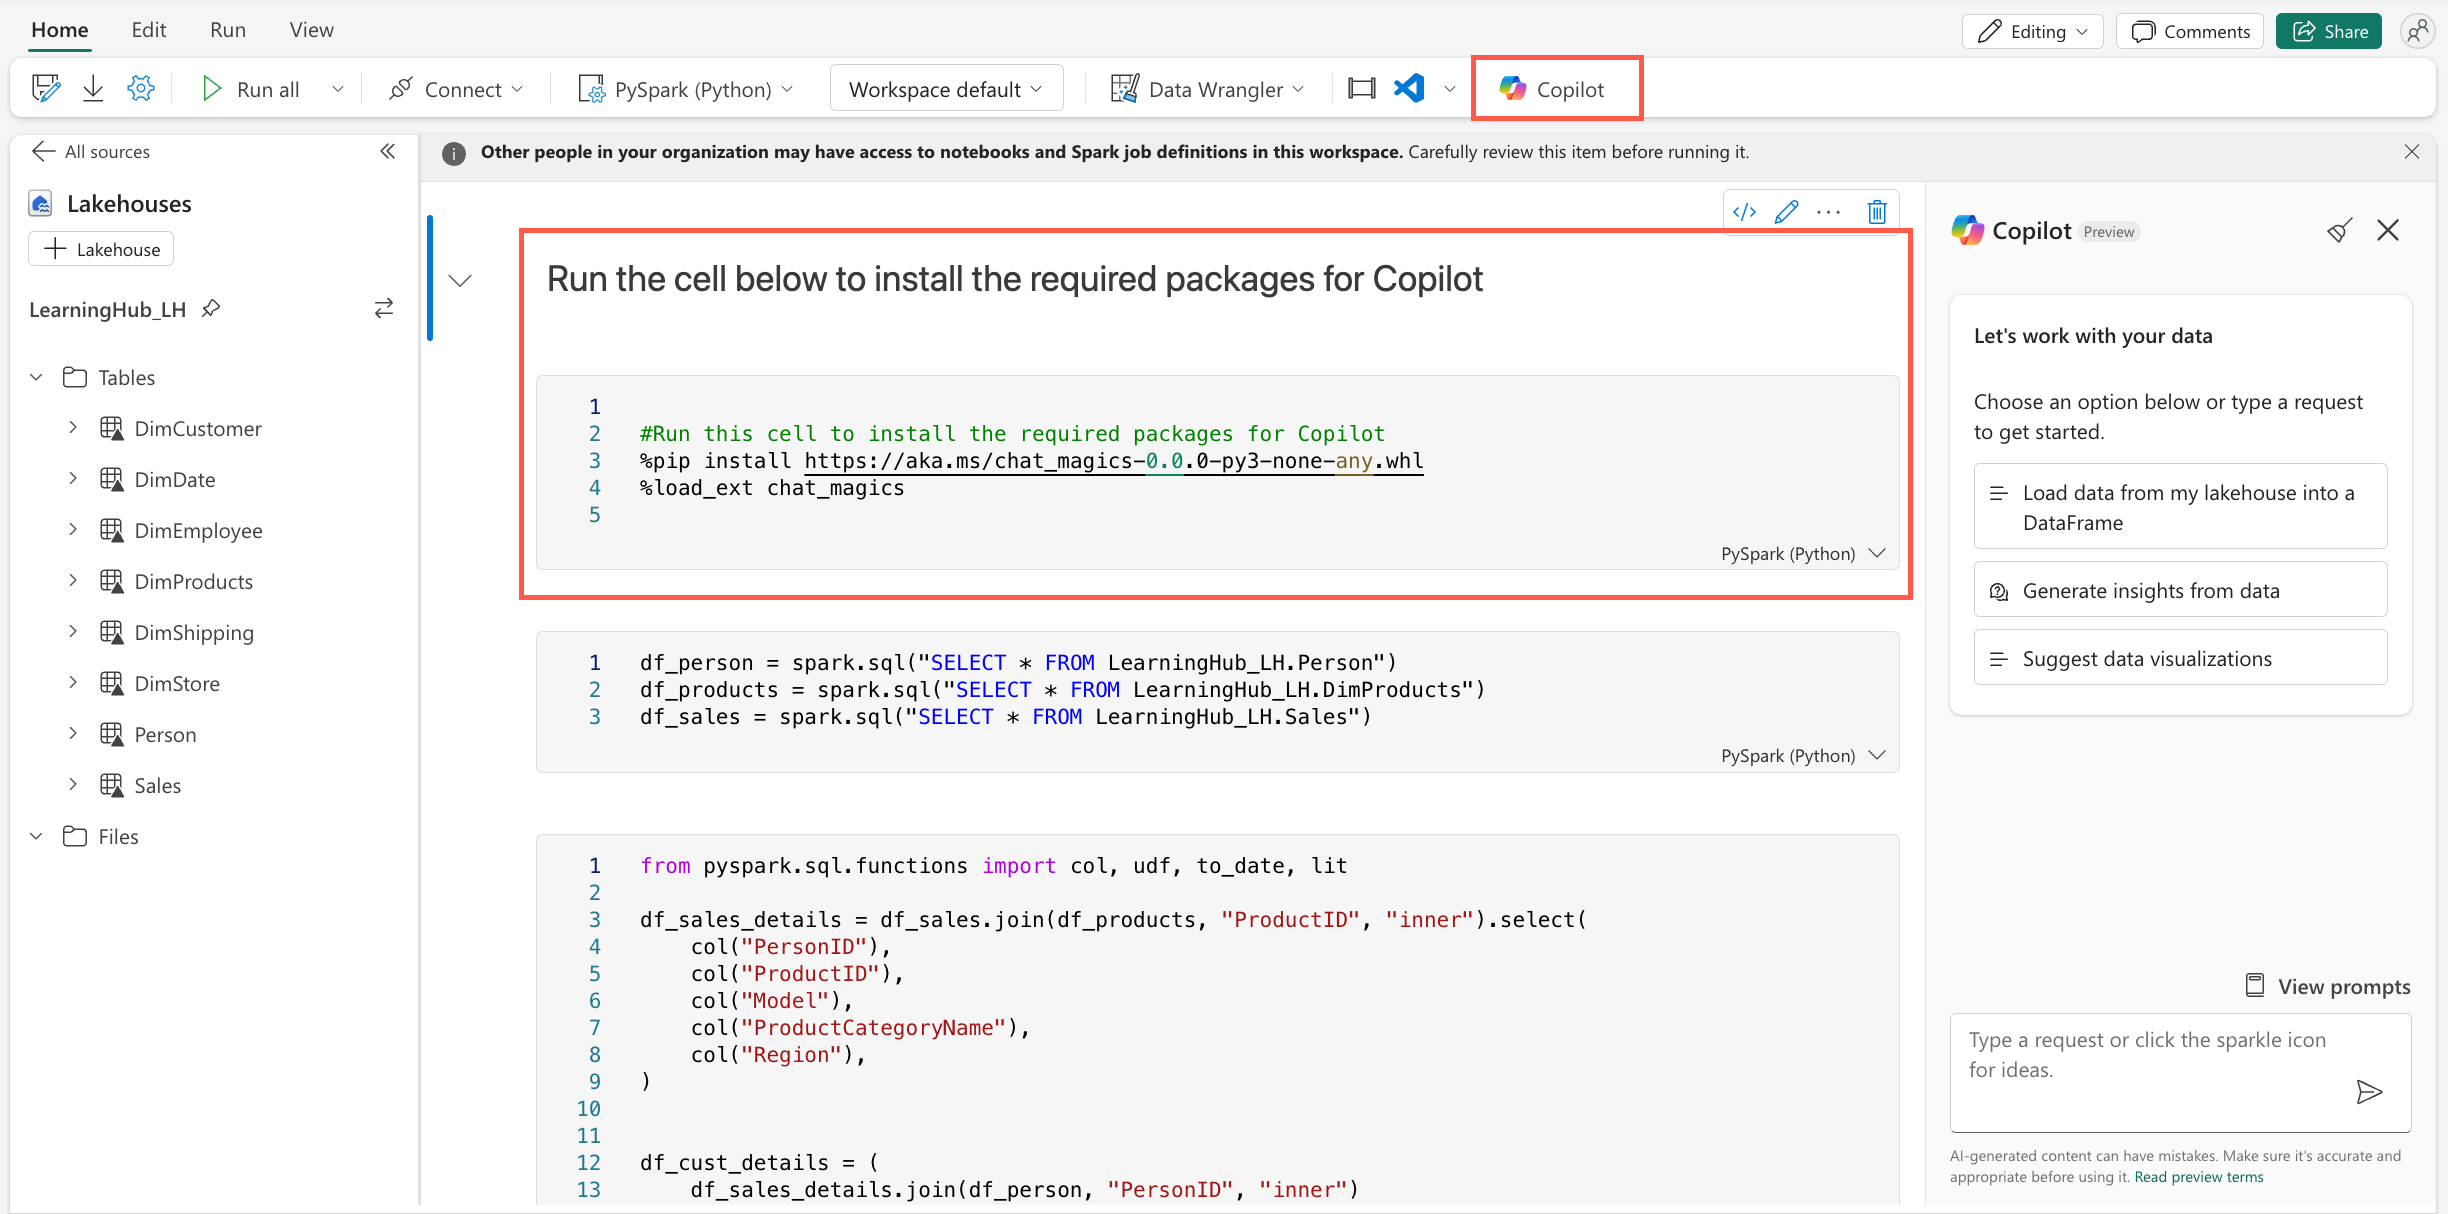
Run the code cell to add the required packages to the notebook. Once this completes, take time to review the output; This includes a section on Data Privacy & Security and Chat_Magics. We'll be using the Chat_Magics in the next steps.
Run the next cell that loads the data from the
Person,DimProducts, andSalestables into DataFrame.Add the following chat-magics command at the beginning of the next two cells, and run both cells.
%%chat
Explain this block of code step by step
For the first cell, Copilot explains how we're performing various joins and renaming of columns. In the output of the second cell, Copilot explains how we're parsing the XML data and transforming it to a structured DataFrame. Do you notice Copilot mentions, the use of a UDF? What is a UDF?
On the open Copilot pane on the right, submit the following prompt:
What is a UDF?
Before proceeding any further, let's add some comments in these cells to improve readability. Remove the chat_magics for chat in both cells and replace with the following chat_magics:
%%add_comments
Run the cells to add the comments.
Note
Ensure that you review the comments added to the cells to ensure they are accurate and that the code was not altered in any way.
Run both cells.
Use Copilot to understand the DataFrame
df_cust_detailscreated in the steps above. Submit the following prompt:%describe
df_cust_details
Confirm the columns that Copilot describes in the output exist in the DataFrame by running the following line of code in a new cell:
display(df_cust_details)
You notice that the
TotalPurchaseYTDhas all empty values, we need to drop it. Add a new cell and run the following prompt:%%code
Remove the TotalPurchaseYTD column
Copilot generates the code to remove the column, review the code and run the cell to remove the column.
Remove all duplicate rows from the DataFrame where the values in the columns columns "First Name," "Last Name," "Address," and "Birthdate" are identical. Run the following prompt in a new code cell:
%%code
Drop all duplicate rows from the dataframe
df_cust_detailswhere the values in the columns "First Name," "Last Name," "Address," and "Birthdate" are identical.Copilot generates the code to remove the duplicate rows, review the code and run the cell to remove the duplicate rows.
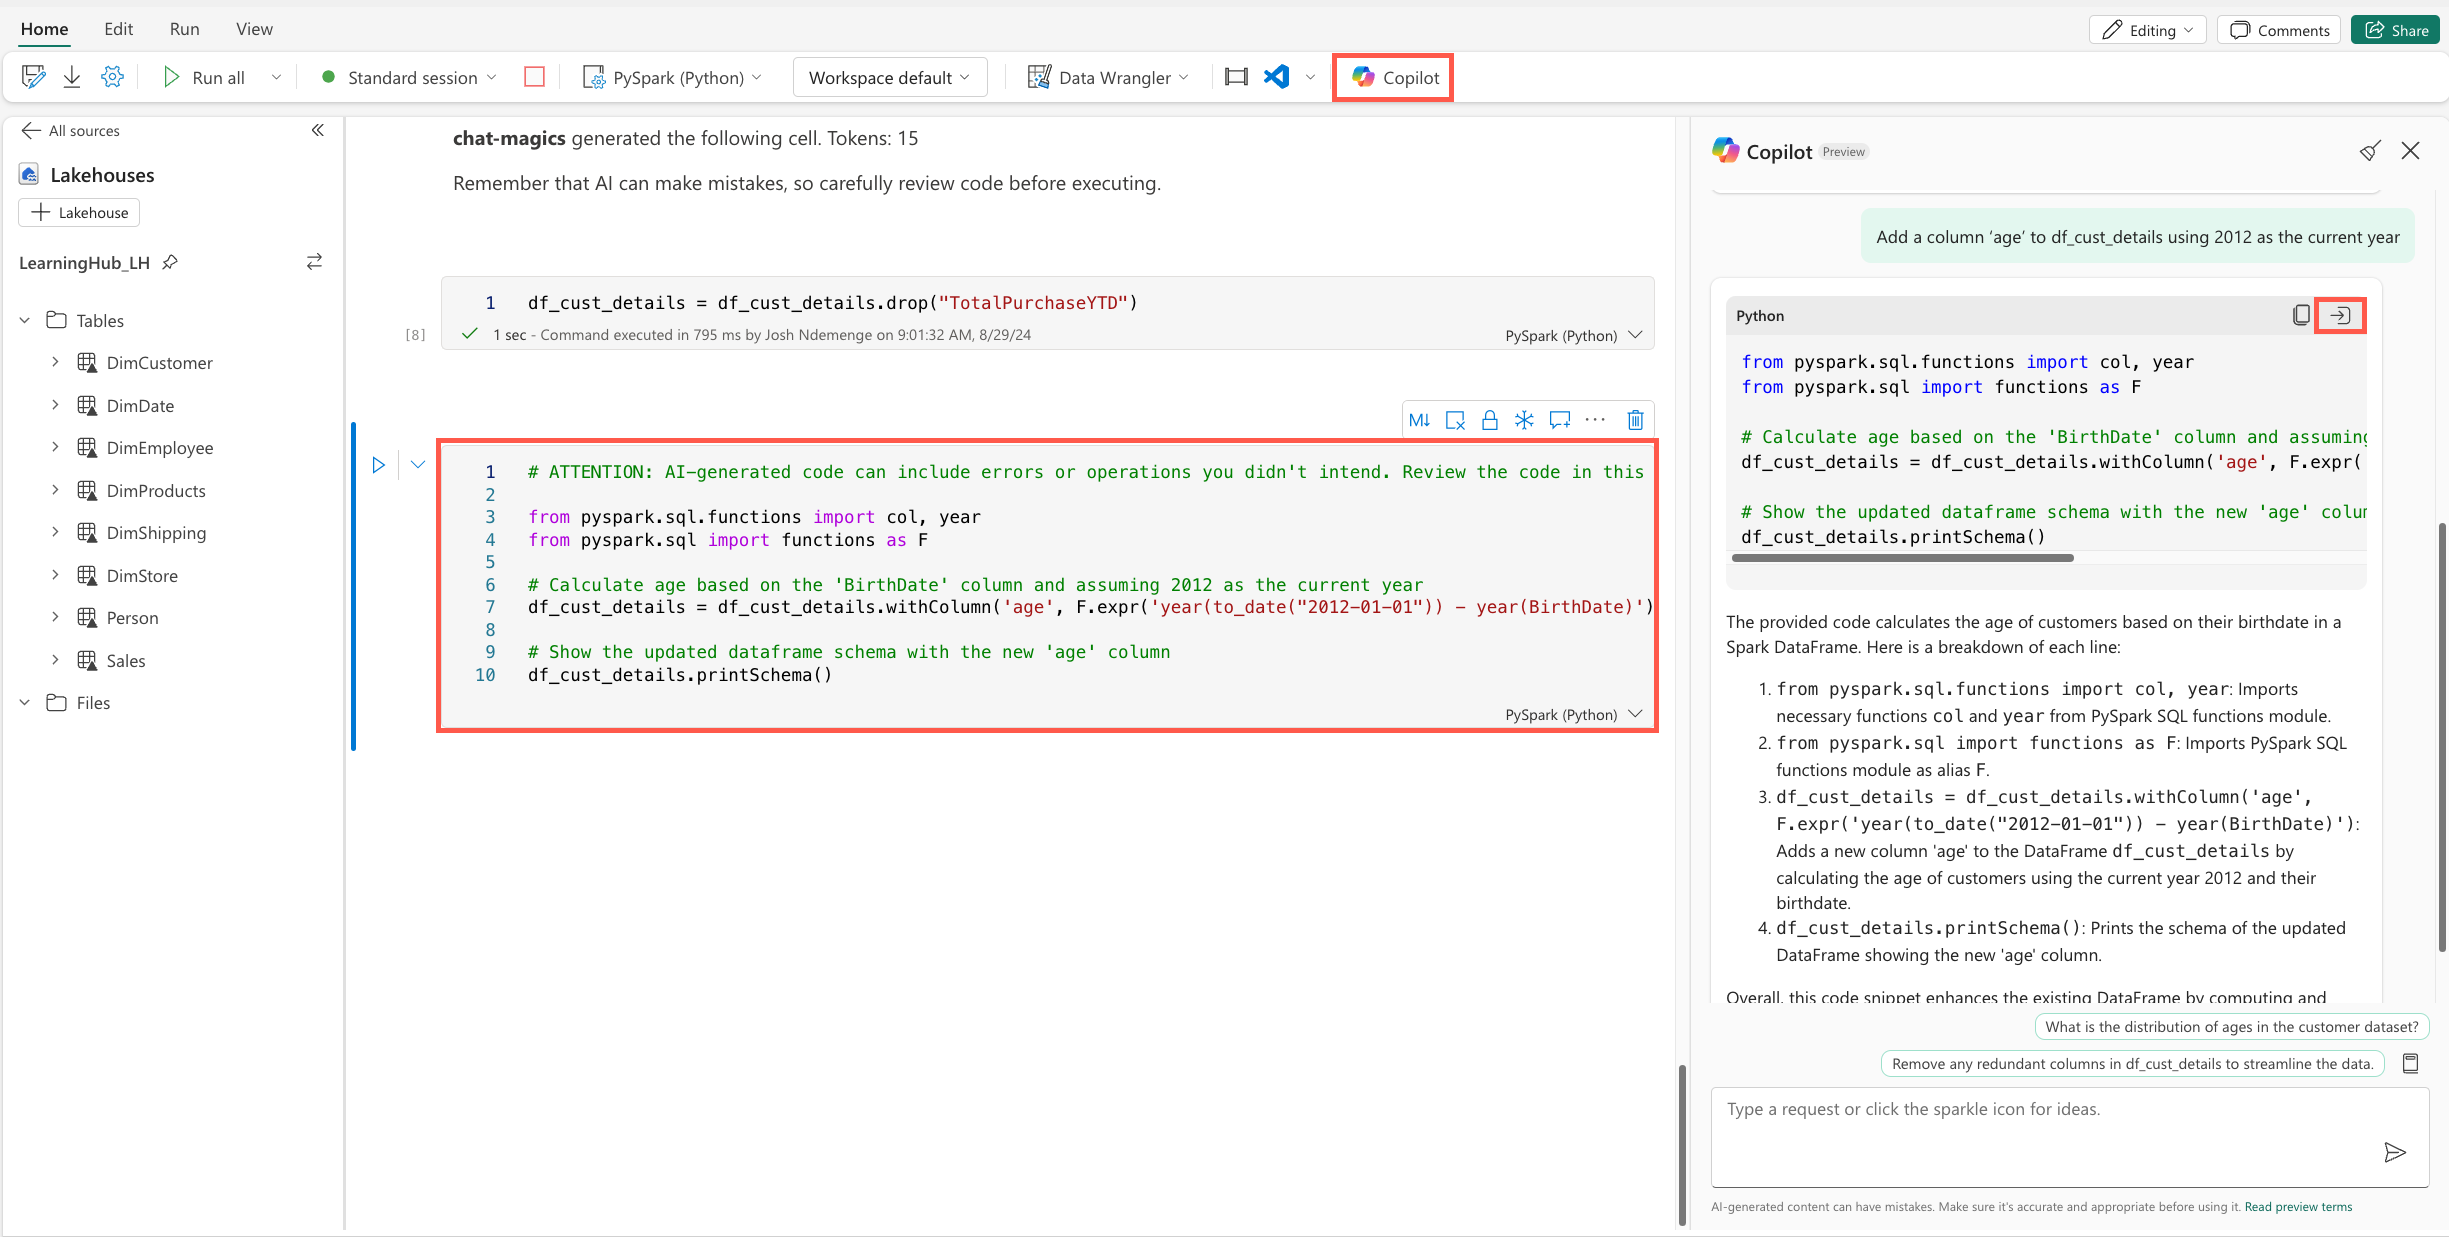
Add a new column called Age, Use the Copilot panel and submit the following prompt to get the code to add the column:
Add a column 'age' to df_cust_details using 2012 as the current year
Take time to review the code generated and explanation provided by Copilot, then use the insert code button on the response card to add the code to a new cell and run the cell.
Since we want to build an analytical model to predict the likelihood of a customer to purchase a bike, we need to transform the data to add a new column that indicates if a customer has purchased a bike or not. Use the Copilot panel to submit the following prompt:
Add a new column ‘IsBikeBuyer’ to df_cust_details with a value of 1 for rows where 'ProductCategory' is 'Bikes', and 0 otherwise.
Review the code generated by Copilot and the explanation provided, then use the insert code button on the response card to add the code to a new cell. If the code generated creates a new DataFrame for the filtered data rename the DataFrame back to
df_cust_details. Run the cell.Using the Copilot panel, select the prompt guide icon and then the Suggest data visualizations option. In the prompt text box, replace
[YOUR_DATA_NAME]withdf_cust_detailsand submit the prompt.Pick one of the suggested visualizations and use either the Copilot panel or Chat_Magics to generate code for the visualization.
Take time and try out the other options provided by Copilot in the prompt guide.
And finally, how can we use Copilot to help the marketing team build a targeted campaign by predicting the likelihood of a customer to purchase a bike? Using the Copilot panel to submit the following prompt:
Suggest how we can build a predictive machine learning model using df_cust_details to predict if a customer is likely to buy a bike or not to help Adventure Works, the bike shop, build a targeted marketing campaign, the 'IsBikeBuyer' column is the target column.
Carefully review the code generated by Copilot and the explanation provided. Use the insert code button on the response card to add the code to a new cell and run the cell.
Save the df_cust_details DataFrame to the Lakehouse by replacing the existing Person table. In a new code cell, copy and run the following code:
df_cust_details.write.saveAsTable("Person", mode="overwrite", overwriteSchema="true")
Congratulations!
And that's it! You've successfully completed the Copilot for Data Engineering & Data Science exercise in Microsoft Fabric. You learnt how to use Copilot in notebooks to generate code snippets, provide explanation for existing code, suggest data visualizations, suggest analytical machine learning models, and more.
Remember, you're using Copilot, not Autopilot. These tools are there to be your assistant in your day-to-day work rather than doing work for you.
What were your thoughts on these exercises? What would you like to see more of? Let us know in the comments of the embedded video.