Note
Access to this page requires authorization. You can try signing in or changing directories.
Access to this page requires authorization. You can try changing directories.
Native CMake support is available in Visual Studio 2017 and later. To see the documentation for these versions, set the Visual Studio Version selector control for this article to Visual Studio 2017 or later. It's found at the top of the table of contents on this page.
All executable CMake targets are shown in the Startup Item dropdown in the toolbar. Select one to start a debugging session and launch the debugger.
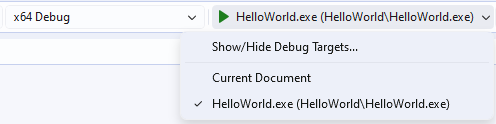
The dropdown provides a list of debug targets to choose from. The selected item appears as a play button followed by the name of the selected debug target to run. In this example, the selected debug target is Hello World .exe.
You can also start a debug session from Solution Explorer. First, switch to CMake Targets View in the Solution Explorer window.
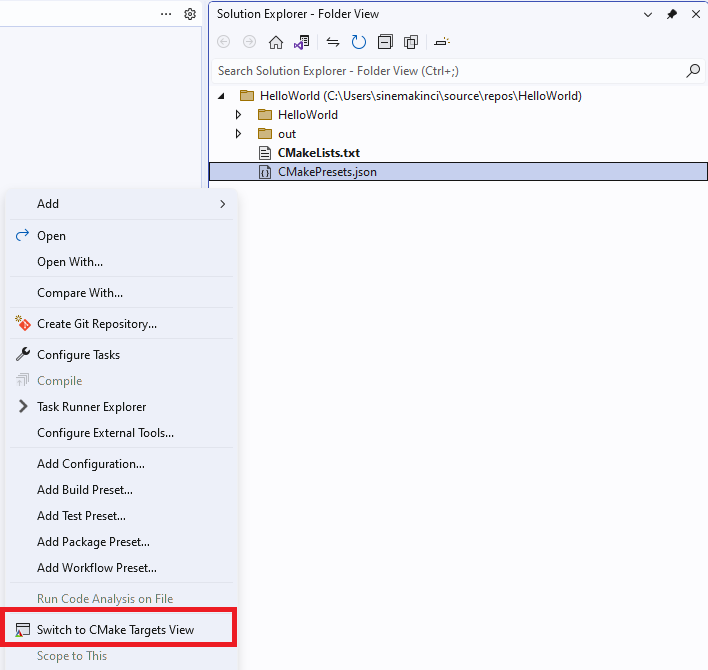
The solution explorer is shown. A right-click on an item in the Folder View has opened a menu that shows options such as Open, Open with, Compare with, and so on. The Switch to Targets View menu item is highlighted.
Then, right-click on an executable and select Debug. This command automatically starts debugging the selected target based on your active configuration.
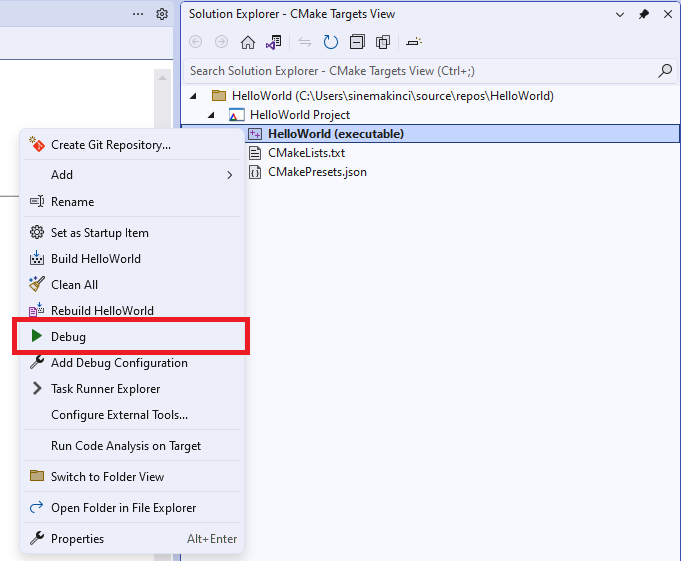
A right-click on a target in the CMake Targets view has opened a menu with options such as Set as Startup item, Build, Clean All, and so on. The Debug menu option is highlighted.
Starting in Visual Studio 2022 Version 17.6, you can also start a debugging session on your CMakeLists.txt file. To do so, just set a breakpoint in your CMakeLists.txt file and run Configure Project with CMake Debugger from the Project dropdown.
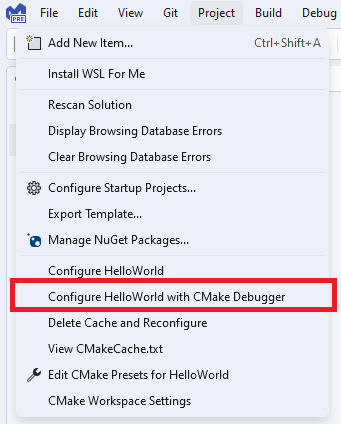
The Project dropdown is shown. The menu option to Configure Project with CMake debugger is highlighted.
Customize debugger settings
You can customize the debugger settings for any executable CMake target in your project. They're found in a configuration file called launch.vs.json, located in a .vs folder in your project root. A launch configuration file is useful in most debugging scenarios, because you can configure and save your debugging setup details. There are three entry points to this file:
- Debug Menu: Select Debug > Debug and Launch Settings for ${activeDebugTarget} from the main menu to customize the debug configuration specific to your active debug target. If you don't have a debug target selected, this option is grayed out.

- Targets View: Navigate to Targets View in Solution Explorer. Then, right-click on a debug target and select Add Debug Configuration to customize the debug configuration specific to the selected target.

- Root CMakeLists.txt: Right-click on a root CMakeLists.txt and select Add Debug Configuration to open the Select a Debugger dialog box. The dialog allows you to add any type of debug configuration, but you must manually specify the CMake target to invoke via the
projectTargetproperty.

You can edit the launch.vs.json file to create debug configurations for any number of CMake targets. When you save the file, Visual Studio creates an entry for each new configuration in the Startup Item dropdown.
Reference keys in CMakeSettings.json
To reference any key in a CMakeSettings.json file, prepend cmake. to it in launch.vs.json. The following example shows a simple launch.vs.json file that pulls in the value of the remoteCopySources key in the CMakeSettings.json file for the currently selected configuration:
{
  "version": "0.2.1",
  "configurations": [
    {
      "type": "default",
      "project": "CMakeLists.txt",
      "projectTarget": "CMakeHelloWorld.exe (Debug\\CMakeHelloWorld.exe)",
      "name": "CMakeHelloWorld.exe (Debug\\CMakeHelloWorld.exe)",
      "args": ["${cmake.remoteCopySources}"]
    }
  ]
}
Environment variables defined in CMakeSettings.json can also be used in launch.vs.json using the syntax ${env.VARIABLE_NAME}. In Visual Studio 2019 version 16.4 and later, debug targets are automatically launched using the environment you specify in CMakeSettings.json. You can unset an environment variable by setting it to null.
Launch.vs.json reference
There are many launch.vs.json properties to support all your debugging scenarios. The following properties are common to all debug configurations, both remote and local:
projectTarget: Specifies the CMake target to invoke when building the project. Visual Studio autopopulates this property if you enter launch.vs.json from the Debug Menu or Targets View. This value must match the name of an existing debug target listed in the Startup Item dropdown.env: Additional environment variables to add using the syntax:"env": { "DEBUG_LOGGING_LEVEL": "trace;info", "ENABLE_TRACING": "true" }args: Command-line arguments passed to the program to debug.
Launch.vs.json reference for remote projects and WSL
In Visual Studio 2019 version 16.6, we added a new debug configuration of type: cppgdb to simplify debugging on remote systems and WSL. Old debug configurations of type: cppdbg are still supported.
Configuration type cppgdb
name: A friendly name to identify the configuration in the Startup Item dropdown.project: Specifies the relative path to the project file. Normally, you don't need to change this path when debugging a CMake project.projectTarget: Specifies the CMake target to invoke when building the project. Visual Studio autopopulates this property if you enter launch.vs.json from the Debug Menu or Targets View. This target value must match the name of an existing debug target listed in the Startup Item dropdown.debuggerConfiguration: Indicates which set of debugging default values to use. In Visual Studio 2019 version 16.6, the only valid option isgdb. Visual Studio 2019 version 16.7 or later also supportsgdbserver.args: Command-line arguments passed on startup to the program being debugged.env: Additional environment variables passed to the program being debugged. For example,{"DISPLAY": "0.0"}.processID: Linux process ID to attach to. Only used when attaching to a remote process. For more information, see Troubleshoot attaching to processes using GDB.
Additional options for the gdb configuration
program: Defaults to"${debugInfo.fullTargetPath}". The Unix path to the application to debug. Only required if different than the target executable in the build or deploy location.remoteMachineName: Defaults to"${debugInfo.remoteMachineName}". Name of the remote system that hosts the program to debug. Only required if different than the build system. Must have an existing entry in the Connection Manager. Press Ctrl+Space to view a list of all existing remote connections.cwd: Defaults to"${debugInfo.defaultWorkingDirectory}". The Unix path to the directory on the remote system whereprogramis run. The directory must exist.gdbpath: Defaults to/usr/bin/gdb. Full Unix path to thegdbused to debug. Only required if using a custom version ofgdb.preDebugCommand: A Linux command to run immediately before invokinggdb.gdbdoesn't start until the command completes. You can use the option to run a script before the execution ofgdb.
Additional options allowed with the gdbserver configuration (16.7 or later)
program: Defaults to"${debugInfo.fullTargetPath}". The Unix path to the application to debug. Only required if different than the target executable in the build or deploy location.Tip
Deploy is not yet supported for local cross-compilation scenarios. If you are cross-compiling on Windows (for example, using a cross-compiler on Windows to build a Linux ARM executable) then you'll need to manually copy the binary to the location specified by
programon the remote ARM machine before debugging.remoteMachineName: Defaults to"${debugInfo.remoteMachineName}". Name of the remote system that hosts the program to debug. Only required if different than the build system. Must have an existing entry in the Connection Manager. Press Ctrl+Space to view a list of all existing remote connections.cwd: Defaults to"${debugInfo.defaultWorkingDirectory}". Full Unix path to the directory on the remote system whereprogramis run. The directory must exist.gdbPath: Full Windows path to thegdbused to debug.gdbserverPath: Defaults tousr/bin/gdbserver. Full Unix path to thegdbserverused to debug.preDebugCommand: A Linux command to run immediately before startinggdbserver.gdbserverdoesn't start until the command completes.
Deployment options
Use the following options to separate your build machine (defined in CMakeSettings.json) from your remote debug machine.
remoteMachineName: Remote debug machine. Only required if different than the build machine. Must have an existing entry in the Connection Manager. Press Ctrl+Space to view a list of all existing remote connections.disableDeploy: Defaults tofalse. Indicates whether build/debug separation is disabled. Whenfalse, this option allows build and debug to occur on two separate machines.deployDirectory: Full Unix path to the directory onremoteMachineNamethat the executable gets copied to.deploy: An array of advanced deployment settings. You only need to configure these settings when you want more granular control over the deployment process. By default, only the files necessary for the process to debug get deployed to the remote debug machine.sourceMachine: The machine from which the file or directory is copied. Press Ctrl+Space to view a list of all the remote connections stored in the Connection Manager. When building natively on WSL, this option is ignored.targetMachine: The machine to which the file or directory is copied. Press Ctrl+Space to view a list of all the remote connections stored in the Connection Manager.sourcePath: The file or directory location onsourceMachine.targetPath: The file or directory location ontargetMachine.deploymentType: A description of the deployment type.LocalRemoteandRemoteRemoteare supported.LocalRemotemeans copying from the local file system to the remote system specified byremoteMachineNamein launch.vs.json.RemoteRemotemeans copying from the remote build system specified in CMakeSettings.json to the different remote system specified in launch.vs.json.executable: Indicates whether the deployed file is an executable.
Execute custom gdb commands
Visual Studio supports executing custom gdb commands to interact with the underlying debugger directly. For more information, see Executing custom gdb lldb commands.
Enable logging
Enable MIEngine logging to see what commands get sent to gdb, what output gdb returns, and how long each command takes. Learn more
Configuration type cppdbg
The following options can be used when debugging on a remote system or WSL using the cppdbg configuration type. In Visual Studio 2019 version 16.6 or later, configuration type cppgdb is recommended.
name: A friendly name to identify the configuration in the Startup Item dropdown.project: Specifies the relative path to the project file. Normally, you don't need to change this value when debugging a CMake project.projectTarget: Specifies the CMake target to invoke when building the project. Visual Studio autopopulates this property if you enter launch.vs.json from the Debug Menu or Targets View. This value must match the name of an existing debug target listed in the Startup Item dropdown.args: Command-line arguments passed on startup to the program being debugged.processID: Linux process ID to attach to. Only used when attaching to a remote process. For more information, see Troubleshoot attaching to processes using GDB.program: Defaults to"${debugInfo.fullTargetPath}". The Unix path to the application to debug. Only required if different than the target executable in the build or deploy location.remoteMachineName: Defaults to"${debugInfo.remoteMachineName}". Name of the remote system that hosts the program to debug. Only required if different than the build system. Must have an existing entry in the Connection Manager. Press Ctrl+Space to view a list of all existing remote connections.cwd: Defaults to"${debugInfo.defaultWorkingDirectory}". Full Unix path to the directory on the remote system whereprogramis run. The directory must exist.environment: Additional environment variables passed to the program being debugged. For example,"environment": [ { "name": "ENV1", "value": "envvalue1" }, { "name": "ENV2", "value": "envvalue2" } ]pipeArgs: An array of command-line arguments passed to the pipe program to configure the connection. The pipe program is used to relay standard input/output between Visual Studio andgdb. Most of this array doesn't need to be customized when debugging CMake projects. The exception is the${debuggerCommand}, which launchesgdbon the remote system. It can be modified to:Export the value of the environment variable DISPLAY on your Linux system. In the following example, this value is
:1."pipeArgs": [ "/s", "${debugInfo.remoteMachineId}", "/p", "${debugInfo.parentProcessId}", "/c", "export DISPLAY=:1;${debuggerCommand}", "--tty=${debugInfo.tty}" ],Run a script before the execution of
gdb. Ensure execute permissions are set on your script."pipeArgs": [ "/s", "${debugInfo.remoteMachineId}", "/p", "${debugInfo.parentProcessId}", "/c", "/path/to/script.sh;${debuggerCommand}", "--tty=${debugInfo.tty}" ],
stopOnEntry: A boolean that specifies whether to break as soon as the process is launched. The default is false.visualizerFile: A .natvis file to use when debugging this process. This option is incompatible withgdbpretty printing. Also setshowDisplayStringwhen you set this property.showDisplayString: A boolean that enables the display string when avisualizerFileis specified. Setting this option totruecan cause slower performance during debugging.setupCommands: One or moregdbcommand(s) to execute, to set up the underlying debugger.miDebuggerPath: The full path togdb. When unspecified, Visual Studio searches PATH first for the debugger.Finally, all of the deployment options defined for the
cppgdbconfiguration type can be used by thecppdbgconfiguration type as well.
Debug using gdbserver
You can configure the cppdbg configuration to debug using gdbserver. You can find more details and a sample launch configuration in the Microsoft C++ Team Blog post Debugging Linux CMake Projects with gdbserver.